We sometimes use affiliate links in our content, when clicking on those we might receive a commission at no extra cost to you. By using this website you agree to our terms and conditions and privacy policy.
“Do the opposite,” he wrote. “If they pump it, short it. If they dump it, go long.”
This advice tapped into trader frustration with headline-driven volatility.
Throughout the five-week conflict, Trump’s social media updates on Iran peace talks, energy infrastructure, or military progress repeatedly caused sharp swings in oil, stocks, and futures.
Markets would spike on optimistic signals only to fade later, or sell off on negative reports before rebounding.
Analysts noted that such moves created opportunities for those fading the initial reaction, especially when actual oil supply disruptions remained limited compared to fear-driven trading.
The conflict has reshaped trading dynamics since late February 2026.
Oil prices surged on threats to the Strait of Hormuz and Iranian energy sites, pushing Brent crude well above $115.
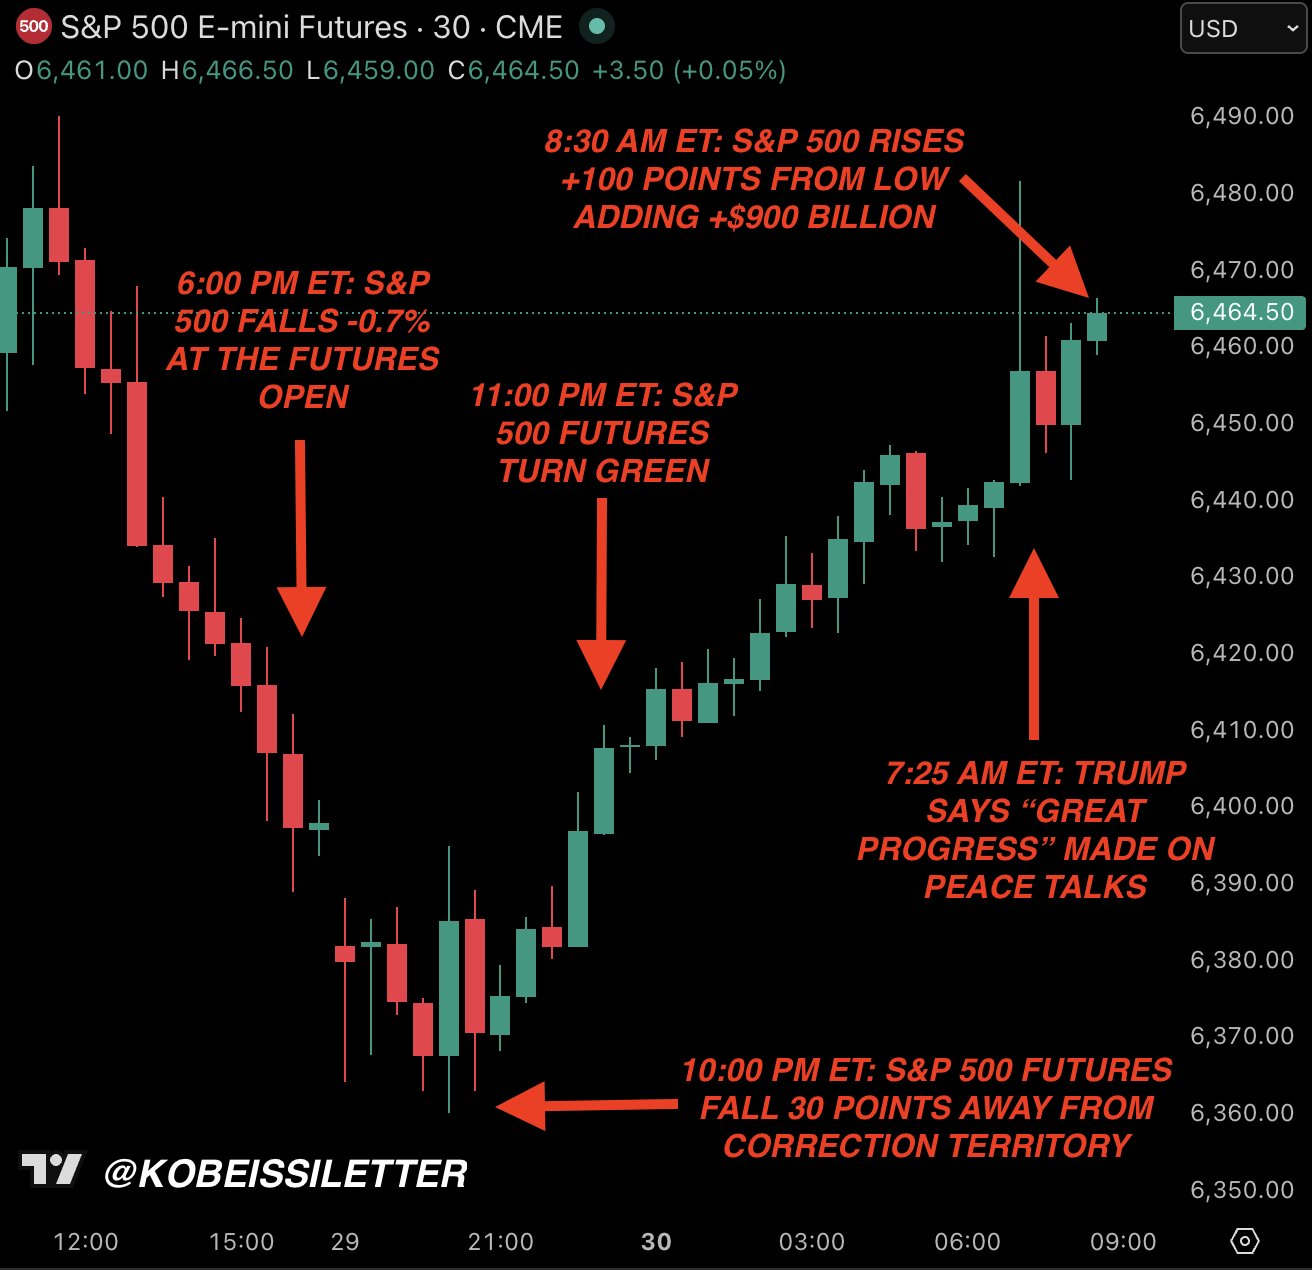
At 4:12 PM ET on March 30, he issued the warning. By 6:00 PM ET, S&P 500 futures opened nearly 1% lower, dipping close to correction territory.
Traders braced for further downside amid fresh Iran-related headlines.
Yet by 11:00 PM ET, futures had erased all losses and turned positive.
Then, at 7:25 AM ET the next morning, Trump posted that “great progress” was being made on Iran peace talks.
Iran’s reverse indicator is playing accurately. Credit: The Kobeissi Letter on X.
The result was clear: stocks staged a sharp rebound.
The S&P 500 climbed more than 100 points from its overnight low, adding roughly $900 billion in market capitalization in a single session.
Commentators like The Kobeissi Letter highlighted the irony: Iran’s top political figure had just delivered better short-term guidance than many Wall Street analysts.
The episode underscored how sentiment, rather than fundamentals, drove much of the action.
Bond market reactions to broader Trump policies, including tariffs, further amplified volatility.
Similar patterns appeared earlier in the conflict. Positive Trump updates often preceded short-term rallies that later reversed, while negative headlines created buyable dips.
The “reverse indicator” worked in this case because markets quickly priced in hopes of de-escalation, even as oil remained elevated above $115 per barrel and risks in the Strait of Hormuz persisted.
Does the Reverse Indicator Apply to Crypto?
Bitcoin and broader crypto markets trade 24/7, so traditional pre-market dynamics don’t apply in the same way. Still, headline sensitivity remains.
When Ghalibaf posted on March 30, Bitcoin had just come off a relatively flat weekend.
It began climbing early the next day, moving ahead of the S&P 500 rebound and signaling early positioning by crypto traders.
Crypto’s response to the Iran conflict shows mixed parallels.
The initial strikes on Feb. 28 triggered a risk-off move, with Bitcoin dropping to around $63,000 and more than $300 million in liquidations across exchanges.
However, the asset showed resilience.
By mid-March, Bitcoin had recovered toward $74,000 at times, posting net gains of roughly 2–10% since the conflict began, while the S&P 500 fell around 2–4% and gold declined nearly 4%.
Unlike traditional markets, crypto benefited from continuous trading.
At the same time, individuals and entities in the region turned to crypto to preserve capital, with notable outflows from local exchanges as sanctions and conflict intensified.
This reinforced Bitcoin’s role as a potential neutral asset, though it still behaved more like a risk asset during periods of acute stress.
The reverse-indicator logic could extend to crypto if headline-driven sentiment continues to dominate.
Positive developments may spark short-term rallies followed by profit-taking, while negative news could create oversold dips.
However, crypto’s higher volatility and its correlation with tech stocks during macro stress mean the strategy is far from reliable.
Inflation pressures from sustained oil prices above $100 have also weighed on risk assets, including crypto, at times.
Prashant Jha is a seasoned crypto journalist based in Delhi, India, with a Bachelor’s Degree in Computer Science Engineering. Passionate about the evolving world of blockchain and cryptocurrencies, he has been a dedicated voice in the industry since 2018. Prashant’s expertise lies in regulatory reporting, where he unravels complex legal and financial developments with clarity and precision. Before joining CCN in 2024, he honed his craft at Cointelegraph, establishing himself as a trusted name in crypto journalism.
His coverage spans major industry events, including the high-profile collapses of FTX, Three Arrows Capital (3AC), and LUNA, offering readers insightful analyses of their regulatory and market implications. Prashant’s technical background enables him to bridge the gap between intricate blockchain technology and its real-world applications, making his work accessible to novices and experts.
Beyond his professional pursuits, Prashant is an avid music enthusiast, often exploring diverse genres to unwind. A sports lover, he has a particular passion for cricket and frequently engages in discussions about the game. His multifaceted interests and sharp journalistic instincts make him a valuable contributor to CCN, where he continues shaping the crypto landscape's narrative.