The 300-day cycle reflects recovery duration, not where Bitcoin price goes next.
Bitcoin may see sideways movement, volatility, and rebounds before reclaiming previous highs.
Bitcoin’s recent correction from its October 2025 peak of $126,000 to around $66,000 has pushed the asset into a 48% drawdown, reigniting debate over how long the recovery could take. While Bitcoin’s volatility is well-known, new data from Ecoinometrics suggests that the depth of the drawdown may provide clues about the timeline for recovery, not necessarily the direction of price.
According to the research, there is a clear historical relationship between Bitcoin’s drawdown depth and recovery duration. Specifically, every additional 10% drop in Bitcoin historically adds roughly 80 days to the time required to reclaim previous highs. With Bitcoin currently down about 48% from its $126,000 peak, the model points to roughly 300 days for a full recovery cycle.
The deeper Bitcoin’s drawdowns, the longer they last.
There is a clear relationship between how far Bitcoin falls and how long it takes to recover.
Historically, every additional 10% of drawdown adds roughly 80 days to the duration.
This estimate is not a price prediction, but rather a time-based framework that helps investors understand how long similar drawdowns have historically taken to recover.
Bitcoin’s Current Drawdown: Where the Market Stands
Bitcoin reached its cycle peak near $126,000 in October 2025 before entering a prolonged correction. Since then, the price has dropped to around $66,000, representing a 48% decline from the top.
Based on the Ecoinometrics model:
10% drawdown → 80 days recovery
30% drawdown → 200+ days recovery
48% drawdown → 300 days recovery
This places Bitcoin’s current cycle in mid-range drawdown territory, deeper than typical corrections during bull markets but still shallower than full bear-market resets.
Historically, such drawdowns tend to lead to extended consolidation periods before the next major breakout.
What the 300-Day Recovery Cycle Actually Means
The 300-day recovery estimate does not mean Bitcoin will move sideways for 300 days. Instead, it reflects the average time historically required to reclaim previous all-time highs after similar drawdowns.
This recovery period typically includes:
Relief rallies
Sideways consolidation
Volatility spikes
Further corrections
Gradual trend reversal
Bitcoin rarely experiences straight-line recoveries. Instead, markets often move through multiple accumulation phases before a sustained uptrend resumes.
For investors, the takeaway is simple:
The deeper the correction, the longer the rebuilding phase.
How Much Time Has Already Passed?
According to the data, roughly 172 days have already passed since the October 2025 peak, leaving approximately 125 to 130 days remaining, assuming the cycle low has already been reached near $60,000.
However, analysts caution that the cycle low may not yet be confirmed, meaning the timeline could extend further if Bitcoin experiences additional downside.
This is an important distinction:
If the bottom is already in → Recovery may occur within months
If further downside occurs → Recovery timeline extends
On-Chain Metrics Suggest Bottom May Not Be Confirmed
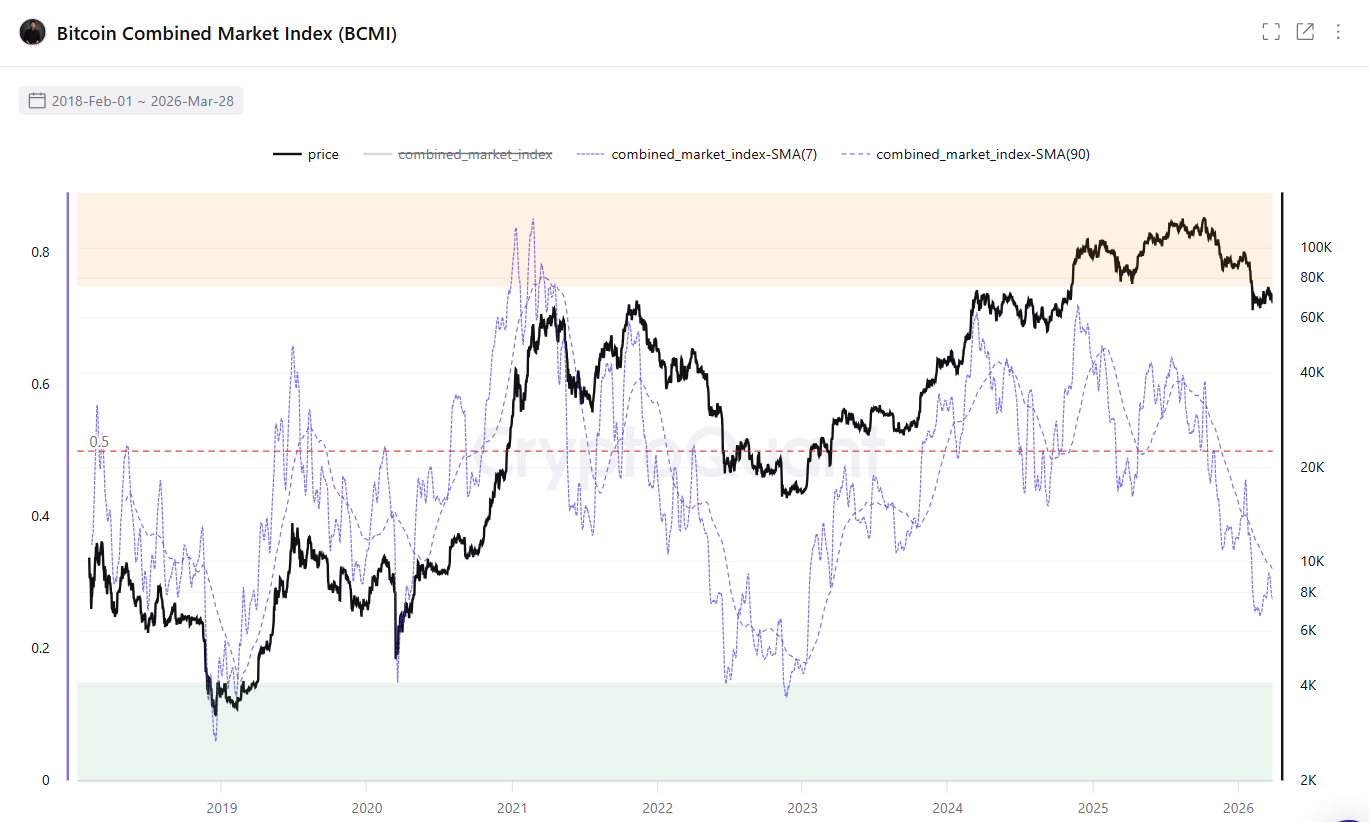
Another indicator supporting caution is the Bitcoin Combined Market Index (BCMI), which aggregates:
Market-value-to-realized-value (MVRV)
Net unrealized profit/loss (NUPL)
Spent output profit ratio (SOPR)
Market sentiment
Currently, the BCMI sits around 0.27, which is above the historical bottom zone near 0.15 seen in previous bear markets.
Bitcoin Combined Market Index (BCMI). | Source: CryptoQuant
Historical comparisons:
2018 bottom → BCMI 0.15
2020 crash → BCMI 0.147
2022 cycle low → BCMI 0.12
Since the index remains elevated relative to past bottoms, Bitcoin may still be in the early-to-mid phase of a broader correction.
Deeper Drawdowns Could Push Recovery Into 2027
If Bitcoin’s decline deepens further, the recovery timeline could stretch even longer.
According to the same Ecoinometrics model:
A 60%+ drawdown historically extends recovery to around 440 days
That scenario could push a full recovery toward Q2 2027
This highlights the sensitivity of recovery timelines to drawdown depth. Even modest additional downside could significantly extend the cycle.
Whale Selling Adds Another Layer of Pressure
Market structure data also suggests continued distribution from larger investors.
Crypto analyst Ardi noted that whale delta reached one of its most aggressive sell levels since October 2024, indicating large holders are selling into current price levels.
According to the analysis, larger players are distributing supply more aggressively than at any point in the past 18 months, suggesting structural resistance above current price levels.
This does not guarantee further downside, but historically, heavy whale selling tends to slow recoveries.
Counter Argument: Bitcoin Often Recovers Faster Than Models Predict
While the drawdown model suggests a longer recovery, there are also arguments for faster recovery scenarios.
1. Institutional Adoption Has Changed Market Structure
Unlike previous cycles, Bitcoin now benefits from:
For example, despite Bitcoin’s drop from $126,000 to the $60,000 range, ETF outflows represented only a fraction of total inflows, suggesting continued long-term institutional demand.
This could shorten recovery timelines compared to past cycles.
2. Bitcoin Has Historically Rebounded After Large Drawdowns
Historical performance shows that Bitcoin often rebounds strongly following deep corrections.
Market data since 2014 shows:
Median gain 31% after six months
Median gain 42% after one year following bear-market conditions
However, this pattern is not guaranteed, and in some cases, Bitcoin remained down significantly even a year later.
The Bigger Picture: Time Horizon vs Price Prediction
The key insight from the 300-day recovery model is not directional, it is temporal.
The data suggests:
The market may require time to rebuild
Volatility likely continues
Consolidation phases are normal
Long-term trend remains intact historically
Importantly, Bitcoin’s past cycles show that extended consolidations often precede major bull runs.
Why This Matters for Investors
For investors, the takeaway is less about where Bitcoin goes next, and more about how long the process may take.
The model suggests:
Recovery may take months, not weeks
Drawdown depth matters more than short-term price moves
Patience historically rewarded long-term holders
Bitcoin’s volatility has always been part of its market structure, and deeper corrections historically required longer recovery periods.
What Comes Next
Bitcoin’s 48% drawdown to $66,000 places the current cycle in a moderate-to-deep correction phase, with historical data suggesting roughly a 300-day recovery timeline.
However, several variables remain:
Further downside could extend recovery
Institutional demand could accelerate recovery
Liquidity conditions will shape market behavior
What remains consistent is Bitcoin’s historical pattern:
The deeper the drawdown, the longer the recovery, but often, the stronger the next cycle.
The 300-day recovery cycle refers to the estimated time Bitcoin historically takes to reclaim its previous all-time high after a drawdown of similar size. It does not mean Bitcoin will move sideways for 300 days.
Is Bitcoin still in a bull market?
Historically, Bitcoin has experienced 30%–60% drawdowns within broader bull cycles. A 48% correction does not necessarily mean the bull market is over, but it suggests a longer consolidation phase.
Could Bitcoin recover faster than 300 days?
Yes. Strong institutional demand, ETF inflows, or improving macro conditions could accelerate recovery. Bitcoin has previously defied historical timelines.
Could Bitcoin fall further?
Yes. If Bitcoin drops below $60,000, the drawdown deepens, and historical data suggests longer recovery timelines. Deeper corrections typically extend consolidation periods.
Disclaimer:
The information provided in this article is for informational purposes only. It is not intended to be, nor should it be construed as, financial advice. We do not make any warranties regarding the completeness, reliability, or accuracy of this information. All investments involve risk, and past performance does not guarantee future results. We recommend consulting a financial advisor before making any investment decisions.
Onkar Singh has three years of experience as a digital finance content creator. Throughout his career, he has collaborated with various DeFi projects and crypto media outlets. In his leisure time, he enjoys fitness activities at the gym and watching movies across different genres. Balancing his professional and personal interests, Onkar continues to contribute to the digital finance landscape while pursuing his hobbies.


 Easy
Easy