Home / Analysis / Crypto / Technical Analysis / Bitcoin (BTC) Price Pumps Past $71K After Trump’s ‘Very Good and Productive’ Statement, but Retraces as Iran Denies Claim
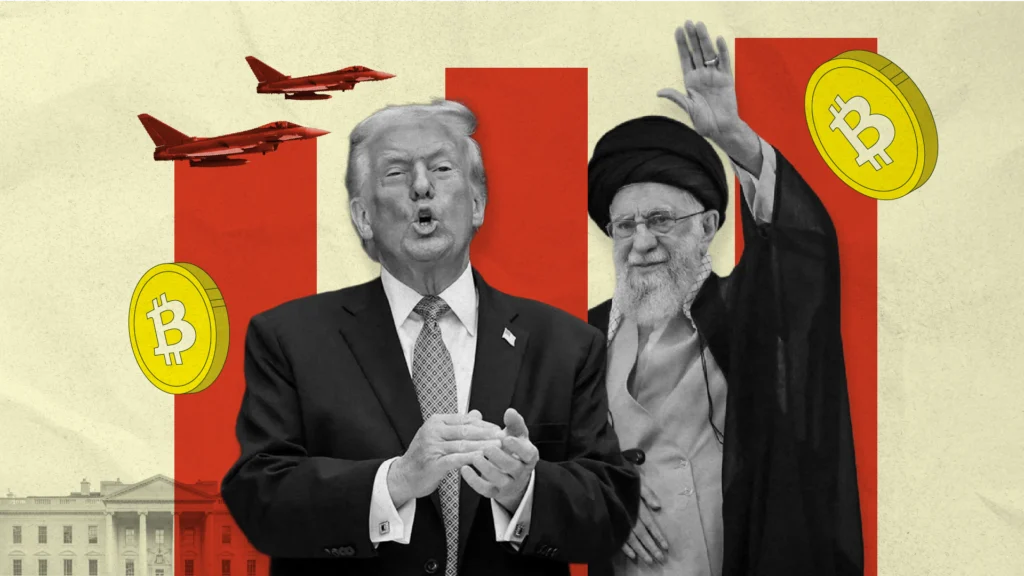
Here's how Bitcoin reacted to the latest development between US and Iran | Credit: Hameem Sarwar
Share
Key Takeaways
Bitcoin surged above $71,000 within minutes after a post by Trump claiming productive conversations.
The rally quickly cooled after Iranian officials issued a statement denying the “tenor and tone” of the talks.
BTC remains trapped within a symmetrical triangle on the daily chart, with the next move unclear.
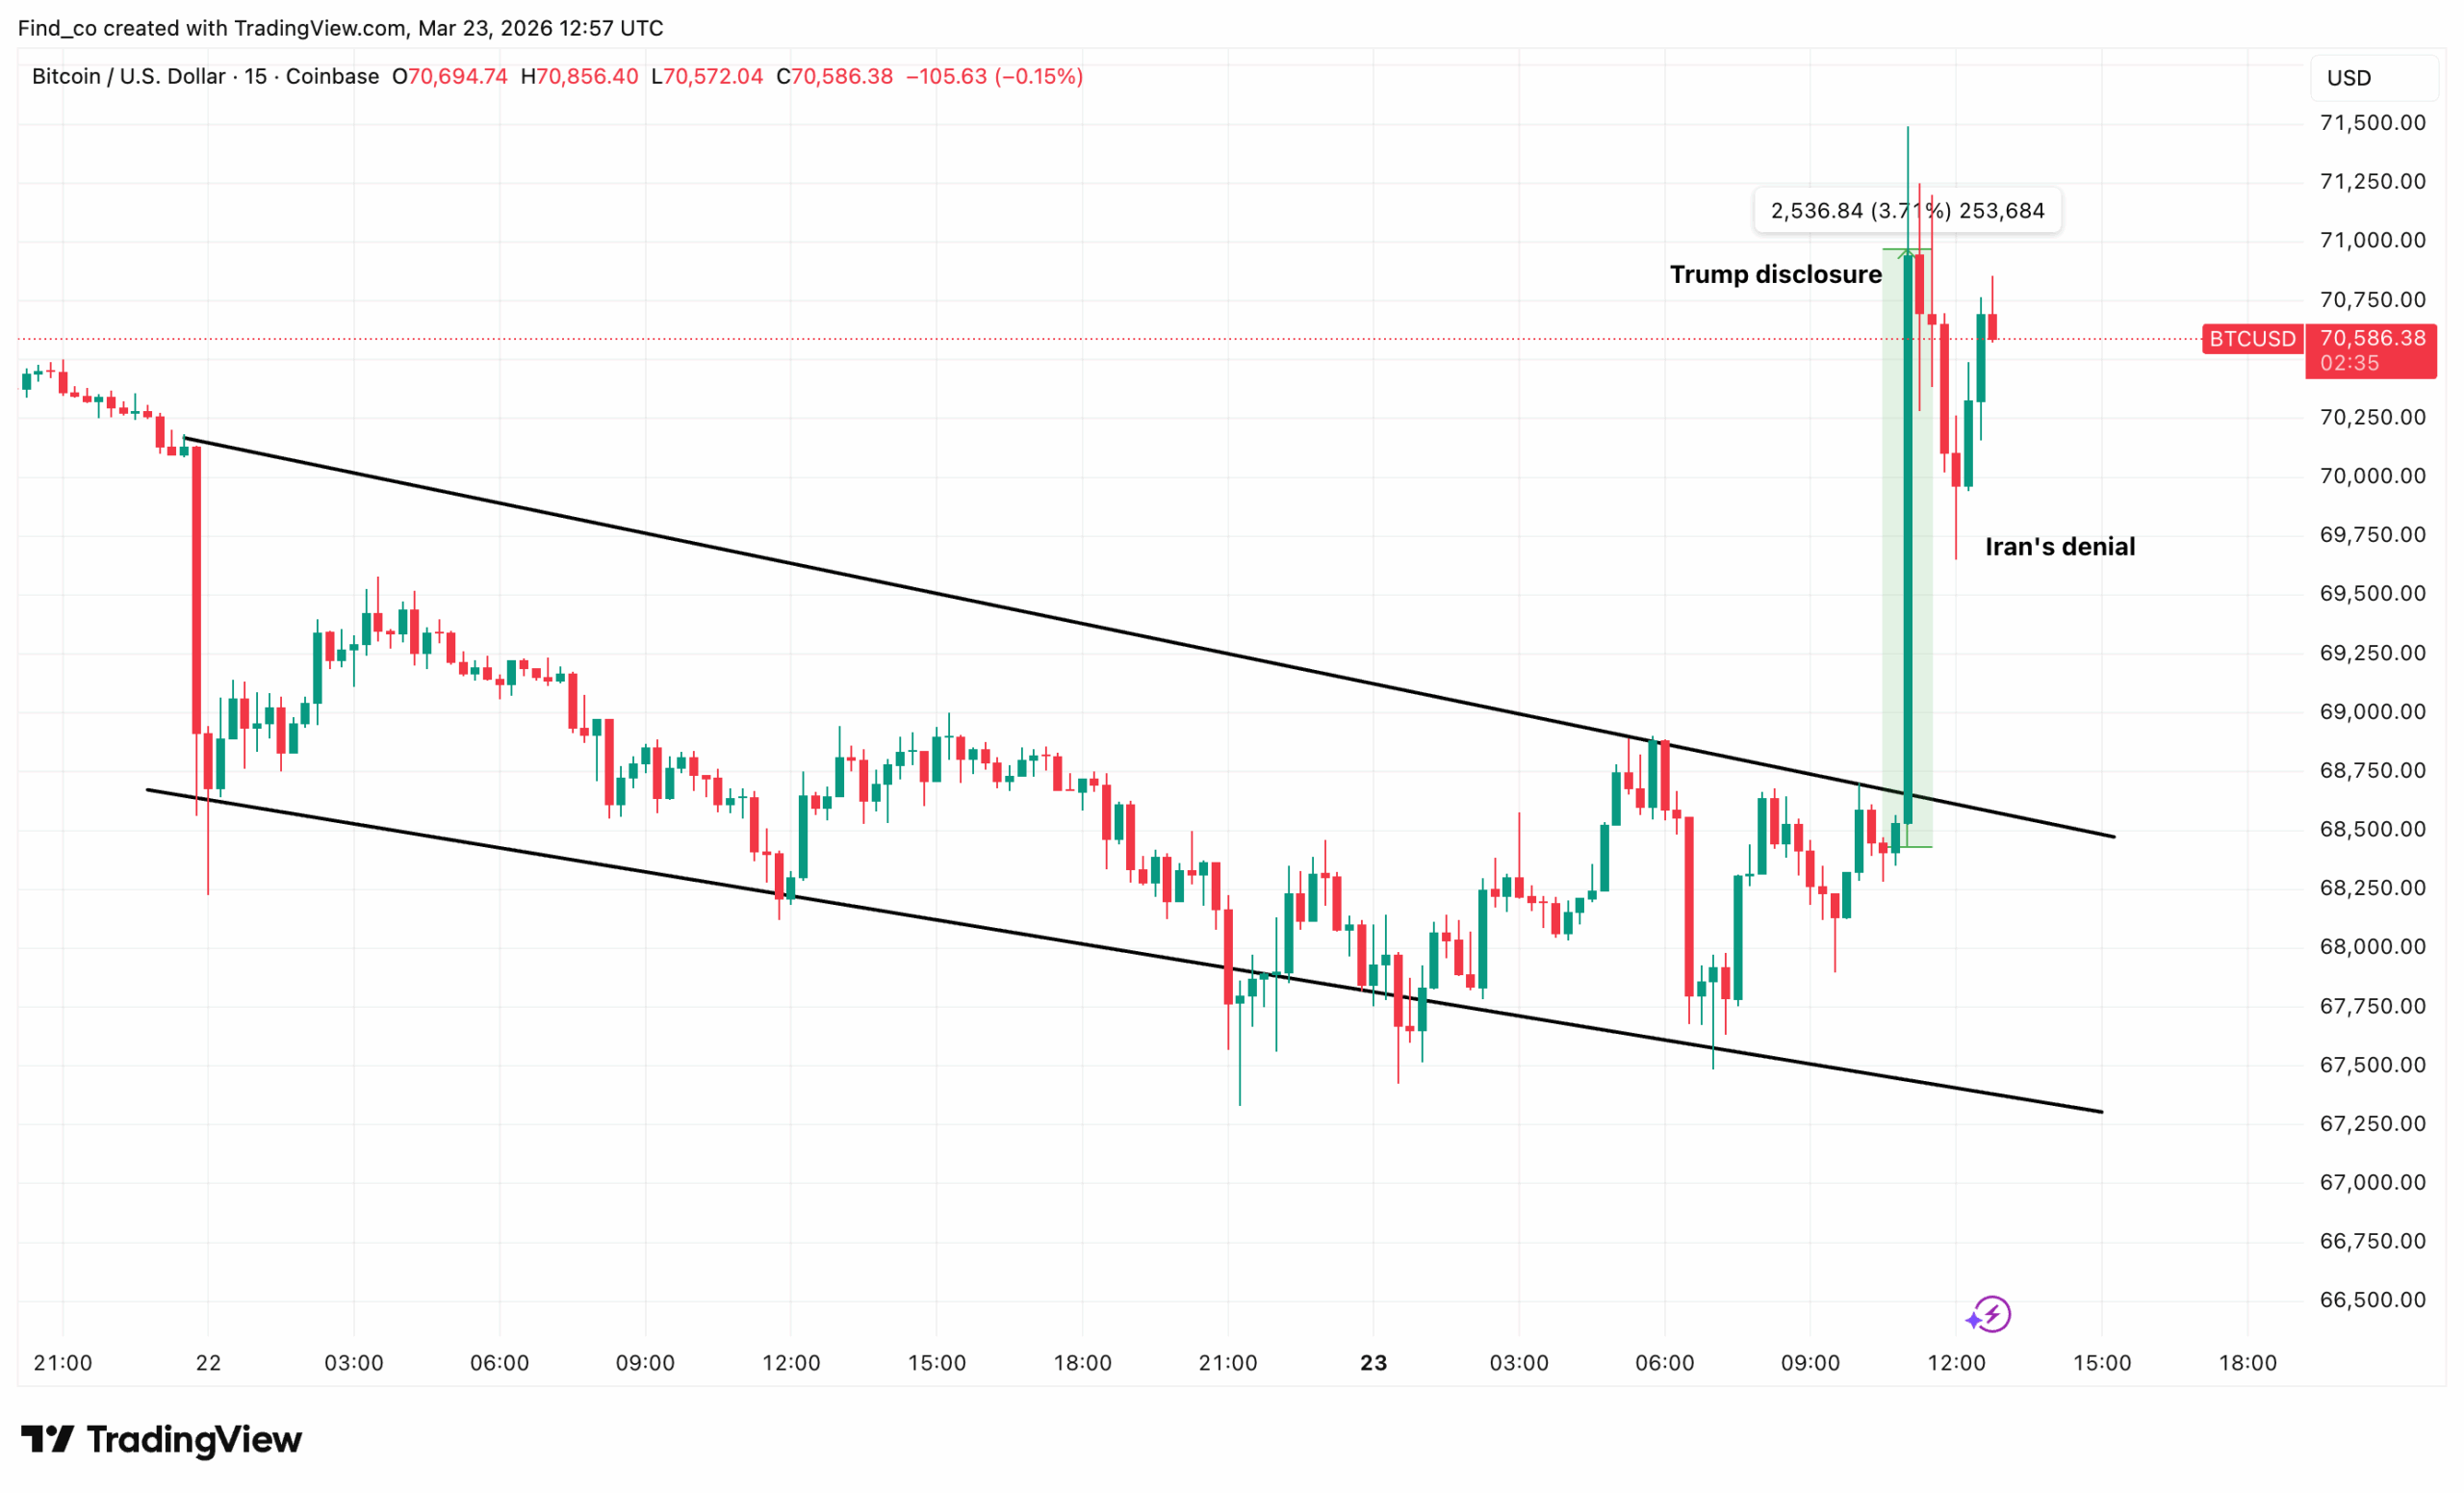
A few hours ago, Bitcoin’s (BTC) price suddenly jumped above $71,000.
This happened within minutes as the coin previously traded below $68,000.
While traders wondered what had happened, CCN learned that President Donald Trump had disclosed ongoing talks between the U.S. and Iran.
However, shortly after, Bitcoin’s price dropped. Here is why, and what could lie ahead for BTC.
The Full Sequence: What Happened?
Bitcoin had erased last week’s rally, sliding below $68,000. This happened as President Donald Trump issued a 48-hour ultimatum to Iran to reopen the Strait of Hormuz or face strikes on its power plants.
This triggered about $299 million in liquidations over 24 hours, with roughly 85% of them targeting long positions.
Then Monday arrived with a completely different tone. Bitcoin’s price surged after US President Donald Trump said the nation would postpone attacks on Iran’s power plants for 5 days.
“I AM PLEASE TO REPORT THAT THE UNITED STATES OF AMERICA, AND THE COUNTRY OF IRAN, HAVE HAD, OVER THE LAST TWO DAYS, VERY GOOD AND PRODUCTIVE CONVERSATIONS REGARDING A COMPLETE AND TOTAL RESOLUTION OF OUR HOSTILITIES IN THE MIDDLE EAST. BASED ON THE TENOR AND TONE OF THESE IN DEPTH, DETAILED, AND CONSTRUCTIVE CONVERSATIONS, WITCH WILL CONTINUE THROUGHOUT THE WEEK, I HAVE INSTRUCTED THE DEPARTMENT OF WAR TO POSTPONE ANY AND ALL MILITARY STRIKES AGAINST IRANIAN POWER PLANT” Trump said in a Truth Social post.
However, the rally did not last long as Iran responded.
Iran’s response to Trump’s claim about peace talks was unambiguous. According to CCN’s findings, the country stated that the talks Trump described either did not happen in the form he presented.
While details of the uncertainty about the war remain sketchy, analysts argue that the surge in the U.S. 10-year treasury yield may have played a part.
Does Trump Want the US Out of Trouble?
At the time of writing, the bond market is sending an uncomfortable message.
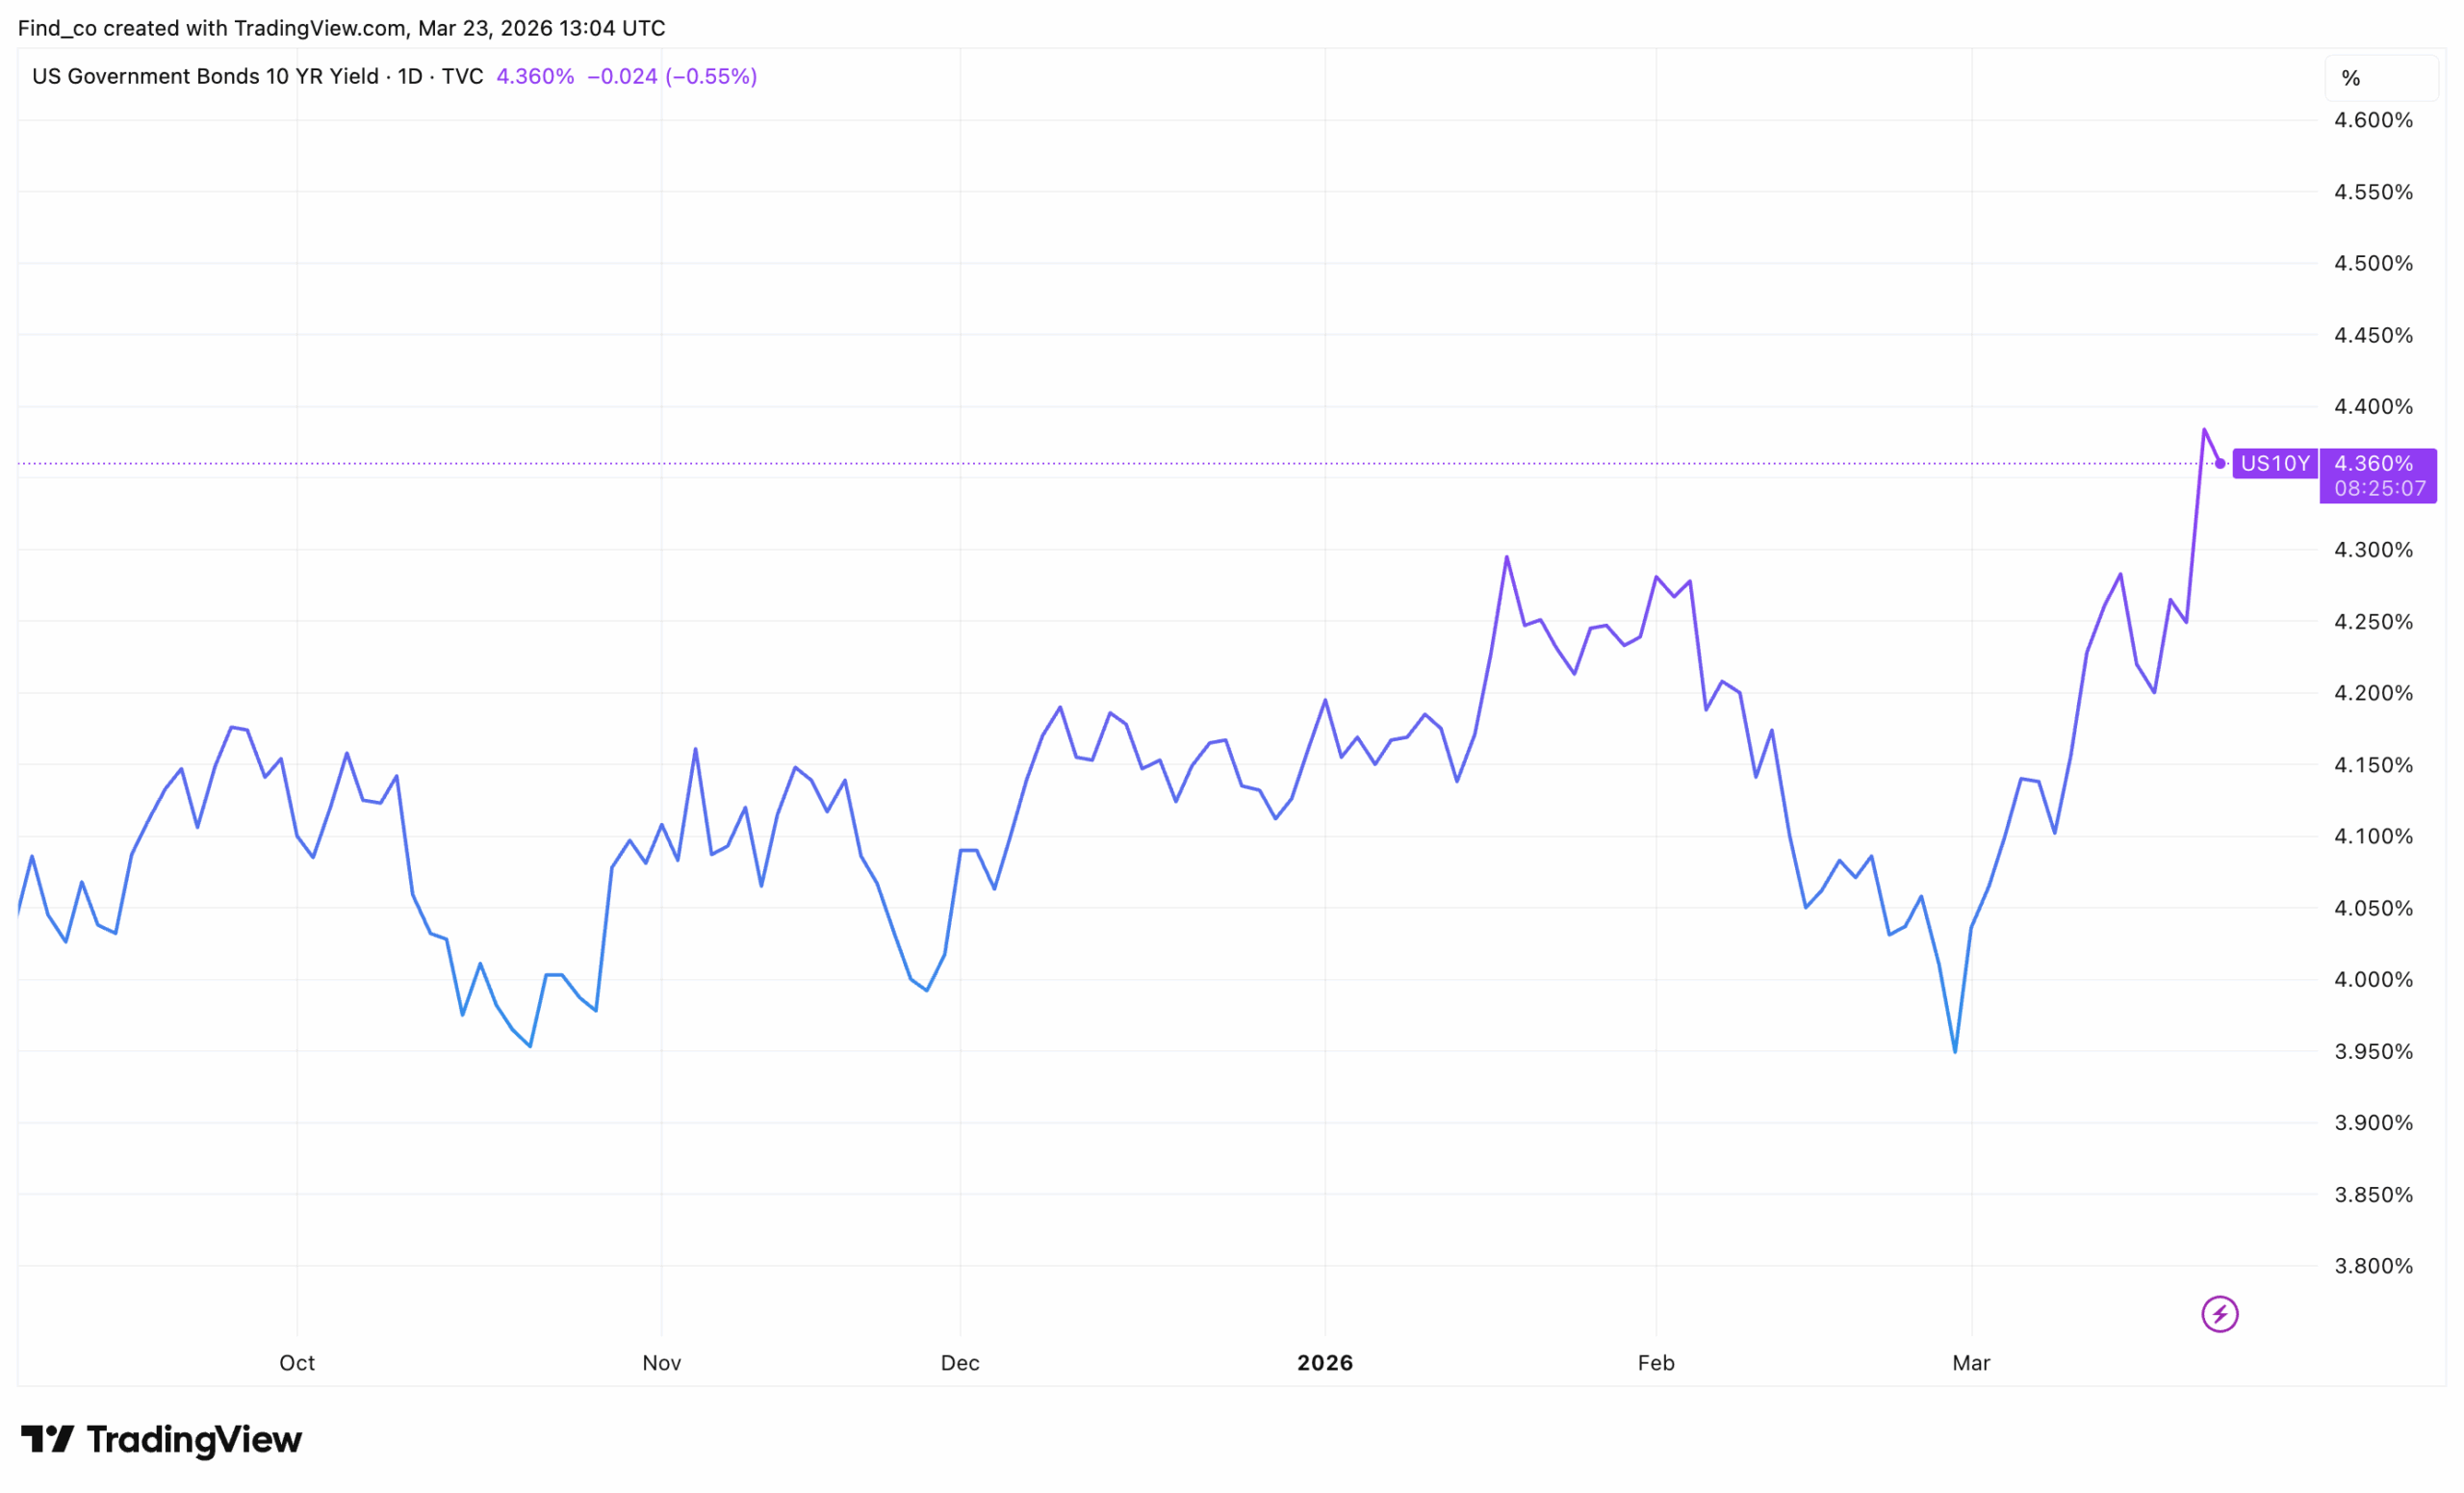
The U.S. 10-year Treasury yield climbed to 4.360% on March 23. In turn, the chart tells the story of how geopolitics shattered a fragile calm and unleashed a new inflation threat on American consumers.
The setup was deceptively quiet. Yields drifted between 4.0% and 4.35% through late 2025 and into early 2026.
Then came Feb. 28, when joint US-Israeli airstrikes targeting Iranian leadership triggered retaliatory missile and drone strikes, and Iran’s subsequent closure of the Strait of Hormuz disrupted roughly 20% of global oil supplies.
Rather than falling on safe-haven demand, the 10-year yield climbed from 3.96% at the end of February. Within the first week of fighting, it reached 4.26%.
The mechanism is straightforward. Before the attacks on Iran began, Brent crude traded around $72.50 a barrel.
After the conflict erupted, it surged toward $107, while inflation was already trending above the Fed’s 2% target.
Consequently, the Fed voted to leave interest rates unchanged at 3.50%–3.75%, with markets increasingly pricing in rate increases this year to contain higher prices.
US 10-Year Treasury Yield Chart | Credit: TradingView
Looking ahead, prolonged conflict could force significant increases in defense spending, further widening deficits and putting upward pressure on Treasury term premiums.
Until the Strait of Hormuz reopens and oil stabilizes, yields, and inflation pressure have room to climb further.
BTC Price Prediction: Mixed Signals
For Bitcoin’s price, it does not seem likely to sustain a breakout. However, the market value could continue to consolidate.
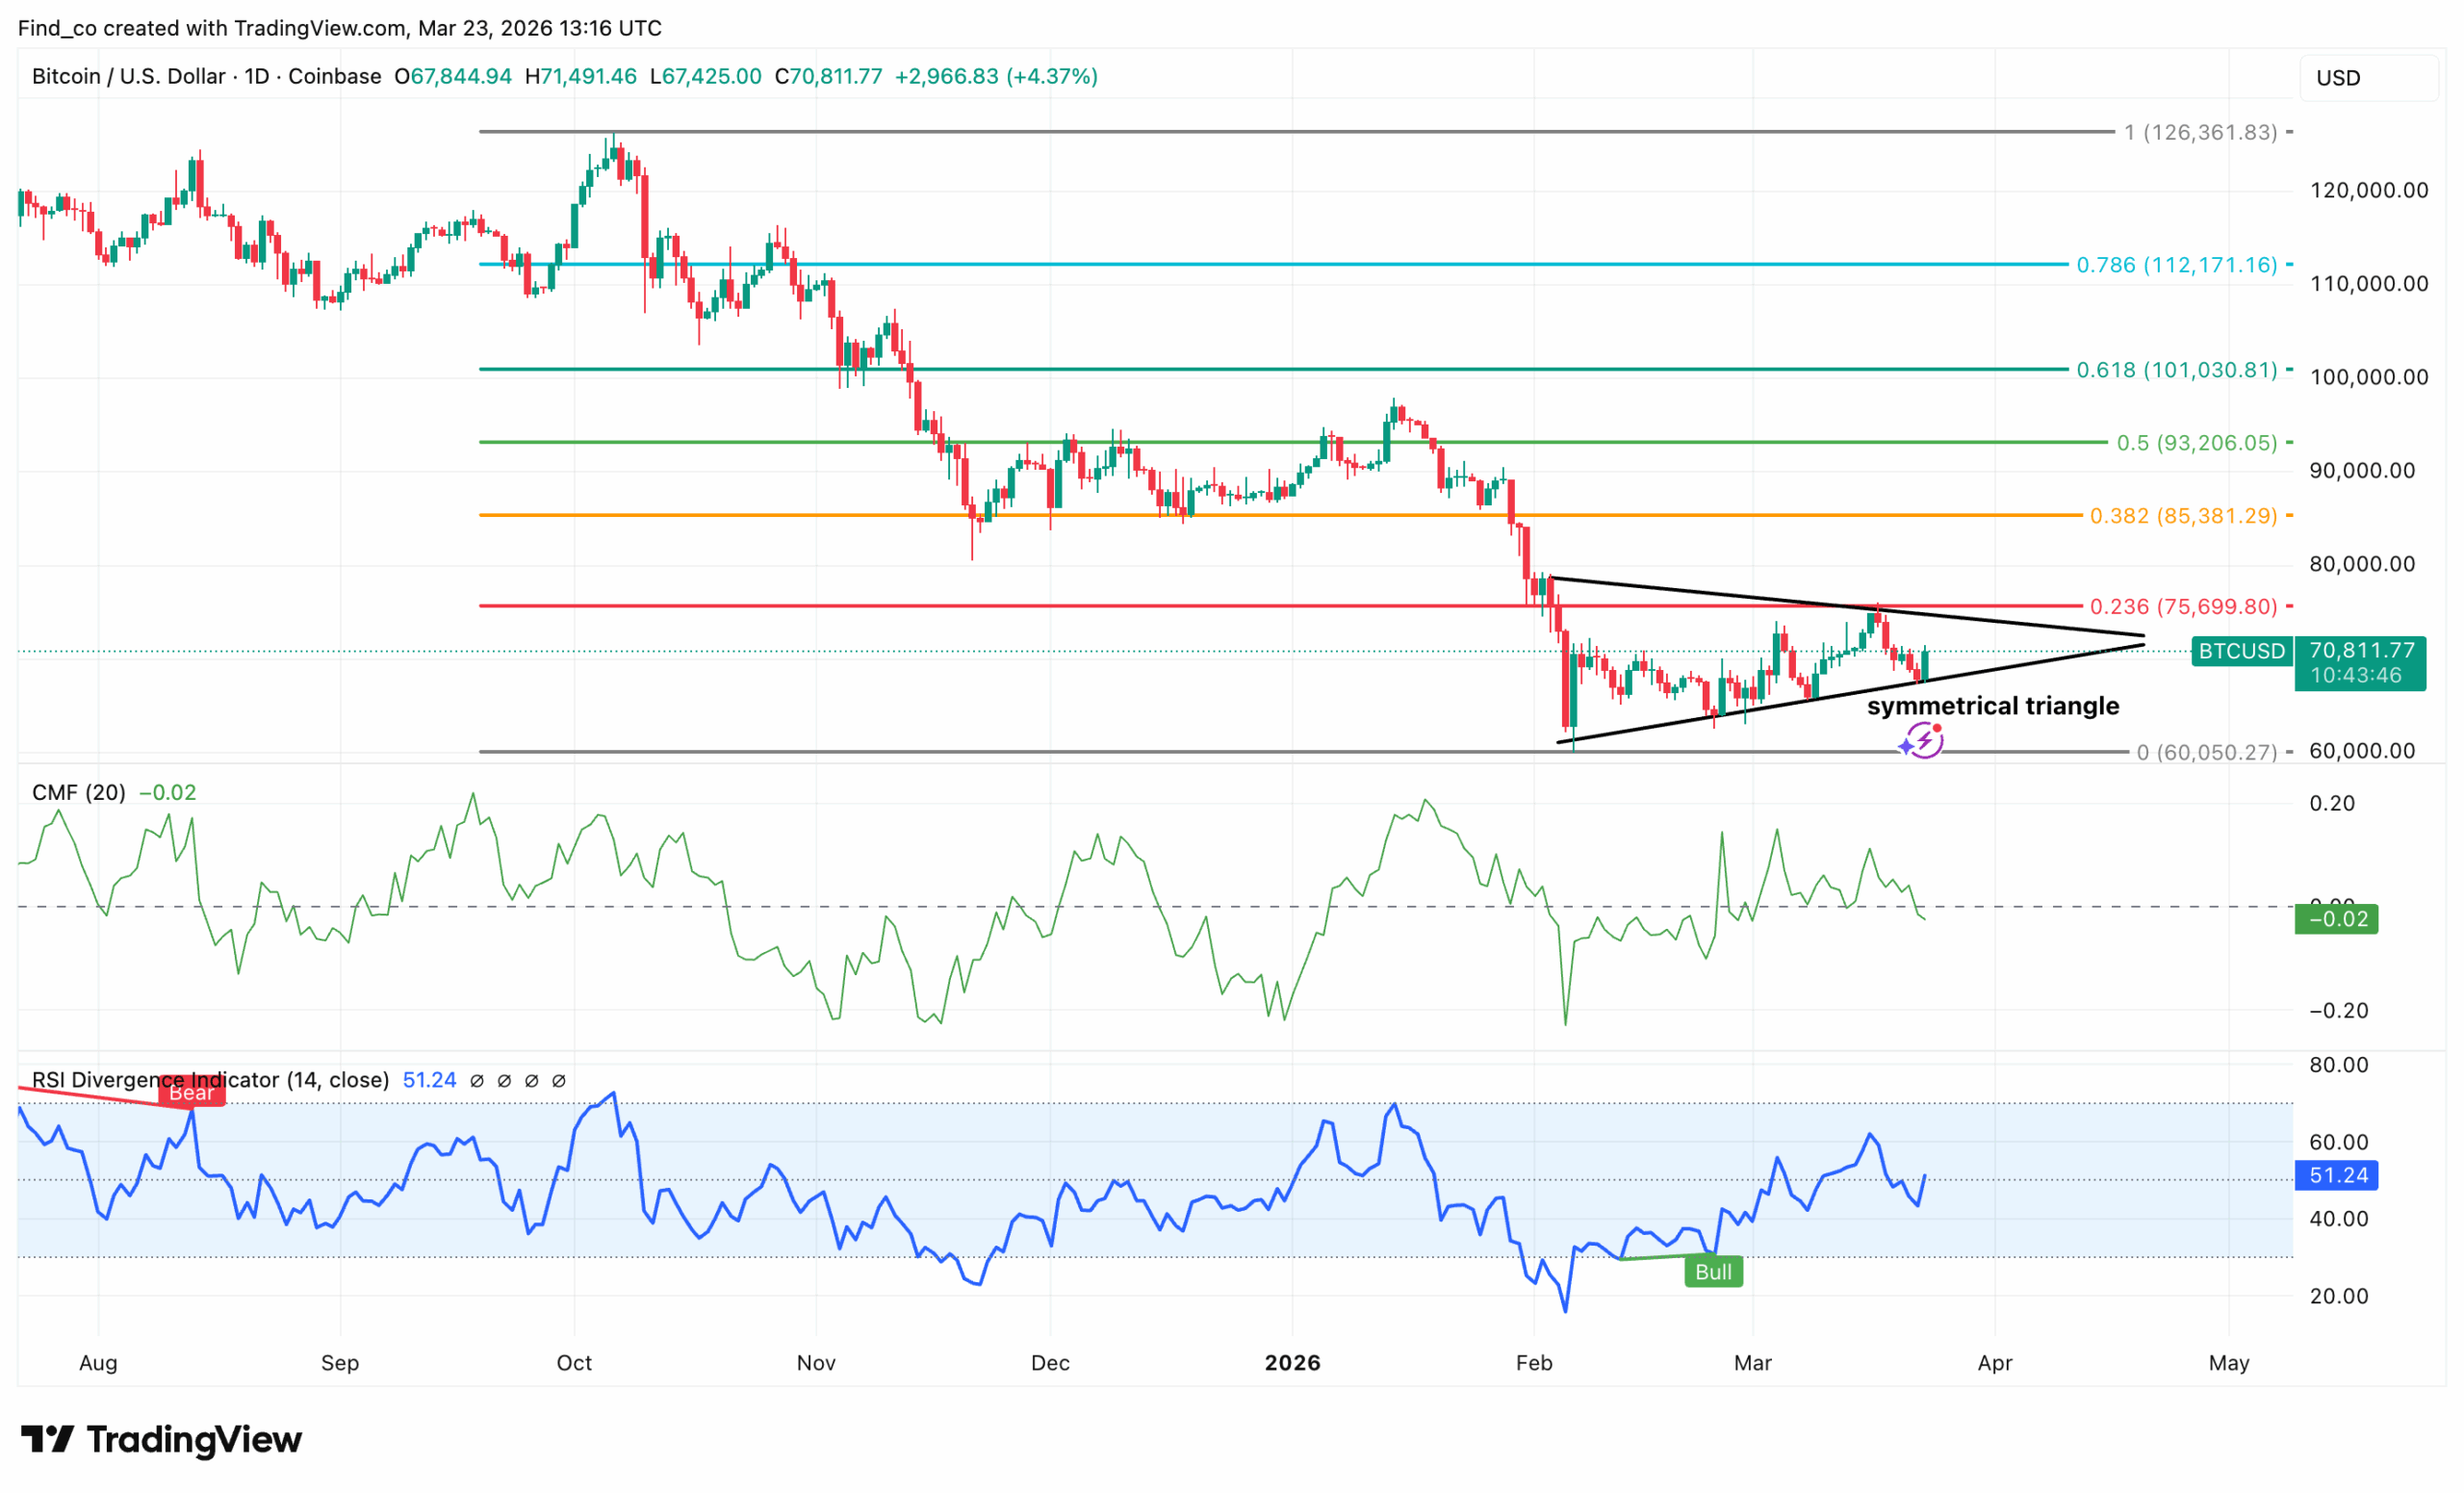
Looking at the daily chart, BTC/USD surged 4.37% to $70,811.
This surge happened as a strong green candle arrived at a technically critical moment. However, the coin is still stuck in a symmetrical triangle.
However, context matters. After peaking near $126,000, BTC endured a punishing decline through late 2025 and into February 2026, bottoming at around $60,050.
That low, however, sparked a bullish RSI divergence signal. History shows that signals rarely lie.
Since then, Bitcoin’s price has been quietly recovering within a tightening symmetrical triangle.
A daily close above $75,700 (the 0.236 Fibonacci level) would represent a genuine breakout and open the door toward $85,381 (the 0.382 Fibonacci level).
But the Chaikin Money Flow (CMF) adds a cautious nuance, however. At -0.02, it sits just barely below the zero line, signaling that capital flow remains marginally negative.
Disclaimer:
The information provided in this article is for informational purposes only. It is not intended to be, nor should it be construed as, financial advice. We do not make any warranties regarding the completeness, reliability, or accuracy of this information. All investments involve risk, and past performance does not guarantee future results. We recommend consulting a financial advisor before making any investment decisions.
Victor Olanrewaju is a crypto analyst and reporter at CCN with deep roots in on-chain research and technical analysis. His crypto journey began in 2017, but it was the 2020 Uniswap airdrop that sparked a full-time pivot into the space.
With a foundation in copywriting, Victor honed his craft creating high-converting content for leading crypto brokers — most notably an XRP price prediction that ranked #1 on Google during the 2021 bull run.
He later joined AMBCrypto in 2022, where he combined storytelling with technical and on-chain analysis to cover key market narratives.
In 2024, he expanded his expertise at BeInCrypto, collaborating with analysts and using tools like Glassnode, Santiment, and IntoTheBlock to break down Bitcoin and altcoin trends.
At CCN, Victor covers the top cryptocurrencies, memecoins, macro shifts, blending real-time insights with deep-dive metrics.
He holds a Bachelor’s degree in Physics from the University of Ibadan, equipping him to simplify complex data for a wide audience. Follow his work or connect on LinkedIn or X.