Home / Education / Crypto / Investing / XRP Investors Face $50.8B in Unrealized Losses with 36.8B Tokens Currently Underwater — Here’s Why This Red Zone Matters
XRP investors are facing $50.8B in unrealized losses as 36.8B tokens fall underwater. On-chain data, SOPR trends, and XRP’s realized price signal a critical phase for the market. | Credit: CCN.com
Share
Key Takeaways
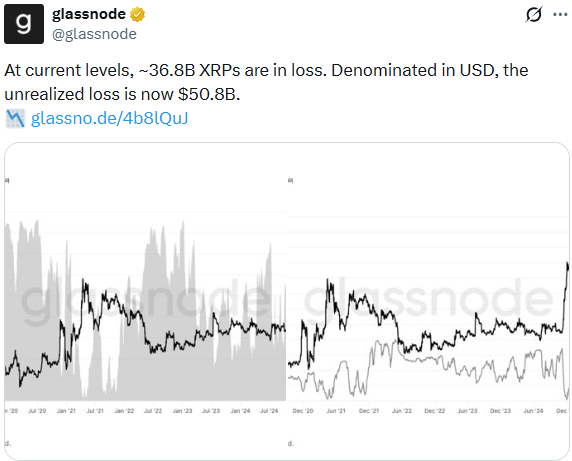
Around 36.8 billion XRP tokens are currently held at a loss, representing roughly $50.8 billion in unrealized losses across the network.
The SOPR (7-day EMA) has dropped from 1.16 in July 2025 to around 0.96, showing that many investors are now selling XRP at a loss.
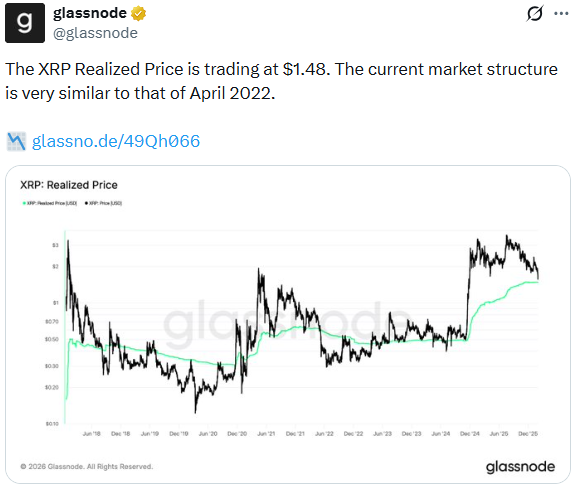
XRP is trading close to its Realized Price of $1.48, which represents the average acquisition price of all coins on the network.
Analysts note similarities to the April 2022 market setup, when XRP approached its Realized Price before entering a deeper bearish phase.
XRP investors are entering a critical phase of the market cycle as on-chain data suggests that tens of billions of dollars in holdings are now underwater. According to recent blockchain analytics, roughly 36.8 billion XRP tokens are currently below their acquisition price, representing about $50.8 billion in unrealized losses for holders.
This shift comes as XRP has lost its aggregate holder cost basis, triggering increased selling pressure and growing investor anxiety. Several key on-chain indicators, including the Spent Output Profit Ratio (SOPR) and Realized Price, are now flashing signals that resemble previous bearish phases in XRP’s history.
While some investors see the current “red zone” as a warning sign, others believe it could mark a turning point that historically precedes long consolidation periods before recovery.
Understanding what these indicators mean can help explain why the market is closely watching XRP’s next move.
What “Unrealized Losses” Mean for XRP Investors
In crypto markets, unrealized losses occur when investors hold assets that are currently worth less than the prices they originally paid.
These losses are “realized” only if the asset is sold at that lower price.
In XRP’s case, on-chain data shows that a large portion of the circulating supply is currently held at a cost basis higher than the current market price. This means many holders would lock in a loss if they sold today.
At current levels, 36.8 billions XRP are in loss. | Credit: Glassnode X profile
One of the clearest signals of this shift comes from the Spent Output Profit Ratio (SOPR), an indicator that tracks whether investors are selling their coins at a profit or a loss.
When SOPR is above 1, investors are generally selling at a profit. When it falls below 1, it means investors are selling at a loss.
The drop below 1 indicates that a growing number of XRP holders are now exiting positions while underwater, a pattern often associated with market stress and capitulation.
This change has effectively flipped on-chain profitability into negative territory, suggesting the broader investor base is no longer sitting on gains.
What Is the Importance of XRP’s Realized Price
Another key metric that helps analysts understand XRP’s market structure is the Realized Price, currently around $1.48.
Realized Price represents the average cost basis of all circulating coins, calculated using the price at which each token last moved on the blockchain.
If the market price trades above the Realized Price, the average holder is in profit.
If the price falls below it, most investors are considered underwater.
Since 2024, XRP has largely traded above this level, meaning the majority of holders have been sitting on unrealized gains. However, as XRP recently dropped below $1.60, the gap between the market price and the Realized Price has narrowed significantly.
The XRP Realized Price is at $1.48. | Credit: Glassnode X profile
This shift has raised concerns among analysts because similar conditions appeared during the 2022 bear market.
In April 2022, XRP approached its Realized Price during a market transition phase.
The retest of this level failed, leading to a deeper decline.
That move eventually pushed XRP toward its cycle low later in the year.
According to on-chain analytics firm Glassnode, the current market structure looks strikingly similar to that earlier period. Because of this historical precedent, the proximity between XRP’s price and the Realized Price has become one of the most closely watched signals in the market today.
If the price holds above the Realized Price, it could signal that investors are still defending their cost basis.
If the price breaks below it, selling pressure could intensify as more holders move into loss territory.
Understanding the MVRV Indicator and “Fair Value”
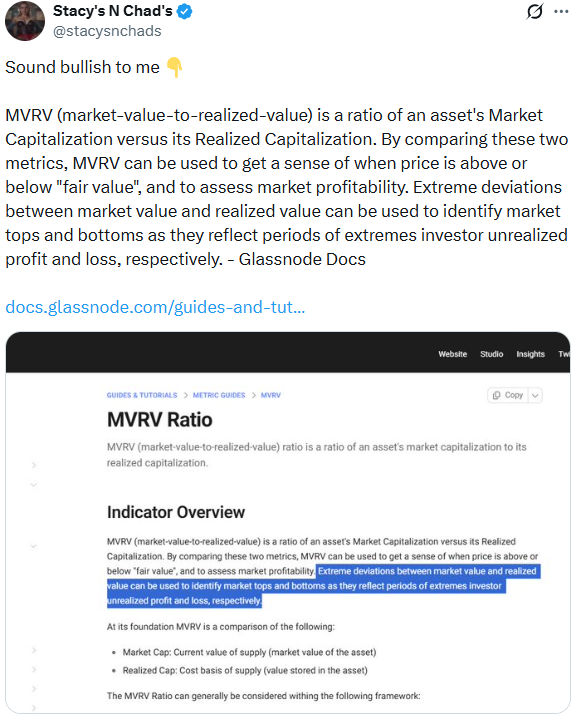
Another important on-chain metric investors are using to evaluate XRP’s current position is the Market Value to Realized Value (MVRV) ratio.
Market value: The total market capitalization based on the current price.
Realized value: The total value of all coins based on their last transaction price.
By comparing these values, analysts can estimate whether an asset is overvalued or undervalued relative to the average investor’s cost basis.
When the market value is much higher than the realized value, investors are sitting on large unrealized profits, often a sign of market euphoria near the top.
Conversely, when market value approaches or falls below realized value, it typically indicates investor pain and widespread unrealized losses, conditions sometimes associated with market bottoms.
Market observers believe this is bullish for XRP. | Credit: Stacy’s N Chad’s X profile
In the case of XRP, the shrinking gap between market price and Realized Price suggests that profitability across the network has been steadily declining since late 2024.
After a strong rally that year pushed XRP significantly above its cost basis levels, profit margins began to shrink as tokens changed hands at higher prices.
This gradual shift raised the network’s average cost basis while the market price stalled.
The recent decline has accelerated that trend, pushing the market closer to a point where many investors are holding losing positions.
These signals suggest the market may be entering a phase in which investor sentiment weakens and selling pressure increases, at least in the short term.
However, historically, these phases also tend to mark periods where long-term investors begin accumulating assets at lower valuations.
Key XRP Price Levels to Watch
Beyond on-chain indicators, technical analysts are also watching key support and resistance levels that could determine XRP’s next move.
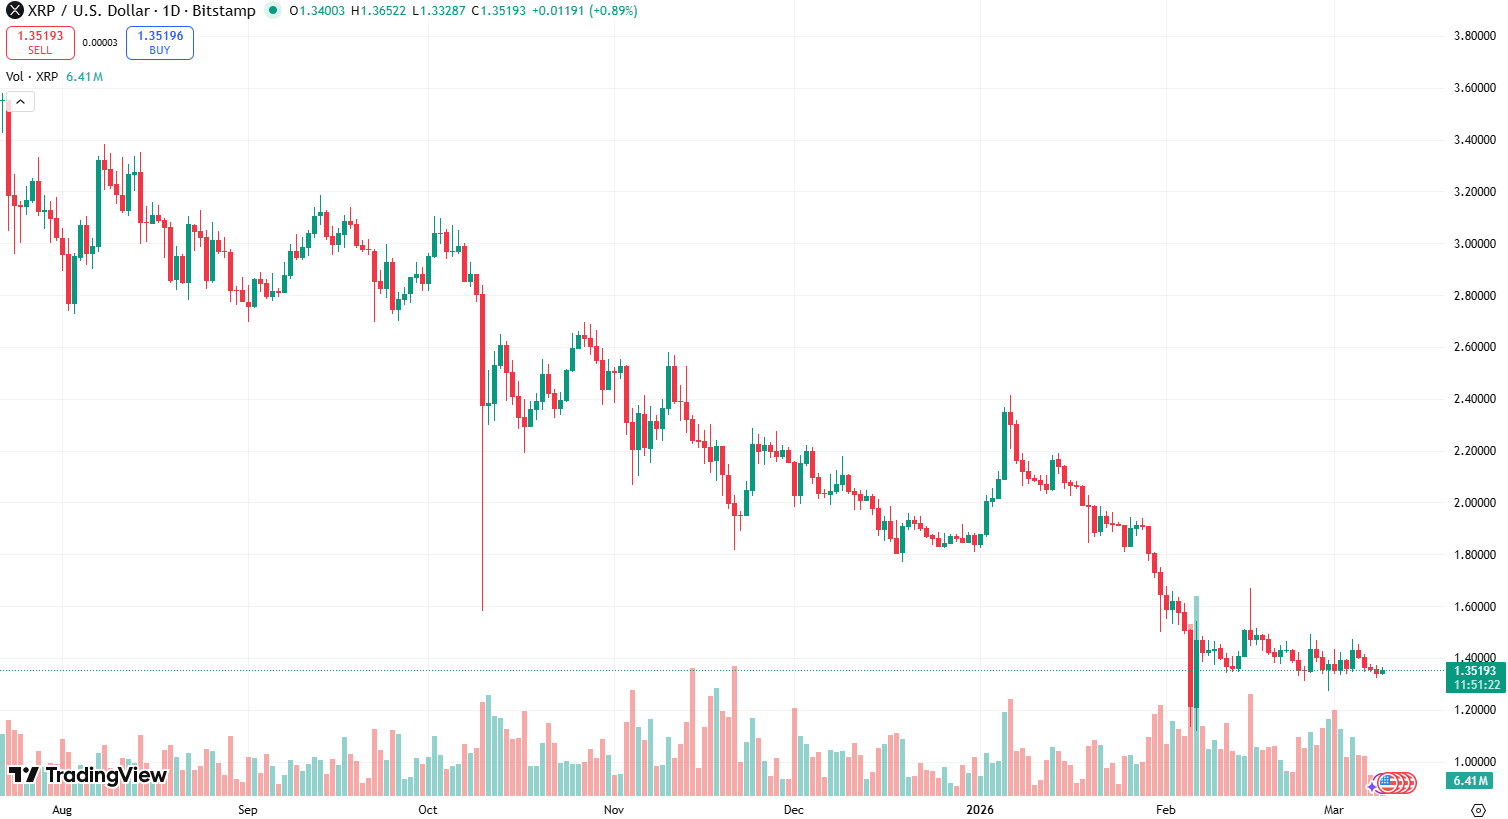
According to technical analysis, XRP is currently trading within a parallel channel, highlighting several important price levels.
The most immediate resistance level sits near $1.86, which could limit upward momentum if the market attempts a recovery.
On the downside, the first key support level is around $1.30, close to the Realized Price level.
XRP/USD daily chart. | Credit: TradingView
If that support fails, the next major level could appear around $1.02, which represents a deeper structural support zone.
At the time of writing, XRP was trading near $1.34, roughly 15% lower over the past week, placing the asset close to the midpoint between these key levels.
36.8 billion XRP tokens are currently underwater, meaning their holders bought at higher prices than the current market value.
These holdings represent roughly $50.8 billion in unrealized losses across the network.
SOPR (7-day EMA) fell from 1.16 in July 2025 to about 0.96, suggesting investors are increasingly selling at a loss.
On-chain profitability has flipped negative, meaning the average transaction is now realizing losses rather than gains.
XRP is trading close to its Realized Price of $1.48, which represents the average cost basis of all circulating tokens.
Why the XRP ‘Red Zone’ Matters for the Market
Periods when a large share of investors are underwater often mark psychologically important phases in market cycles.
When prices fall below many investors’ cost basis, selling pressure can increase as holders attempt to exit positions.
At the same time, such conditions can also signal the late stages of bearish trends, when weaker hands exit the market and stronger hands begin accumulating.
This dynamic is often referred to as capitulation, a phase where panic selling eventually clears the way for long-term stabilization.
In previous cycles, similar on-chain signals have appeared near market bottoms for several cryptocurrencies.
However, they can also persist for extended periods during bear markets.
If the price holds above the Realized Price, it could signal that investors are still willing to defend their cost basis levels.
But as XRP broke below $1.48, it would place the average holder underwater, potentially increasing selling pressure and extending the current downtrend.
Analysts are currently paying attention to:
A drop below the Realized Price would mean the majority of XRP investors are underwater.
Similar on-chain conditions appeared during the April 2022 market transition into a bear phase.
Investor sentiment tends to weaken when prices approach the network’s average cost basis.
Historically, these periods can trigger either capitulation selling or long-term accumulation.
At the same time, long-term investors may interpret such conditions differently.
Periods of widespread unrealized losses historically coincide with valuation resets, during which assets transition from speculative to accumulation phases.
For XRP, the key question now is whether the current red zone represents the start of a deeper downside, or the foundation for the next recovery cycle.
Either way, the combination of on-chain signals, investor psychology, and macro market conditions will likely determine how this phase unfolds.
What does it mean that XRP investors have $50.8 billion in unrealized losses?
Unrealized losses mean that investors are currently holding XRP that is worth less than the price they originally paid. The losses are only “unrealized” because they become real losses only if investors sell their tokens at the current lower price.
Why are 36.8 billion XRP tokens considered “underwater”?
A token is considered underwater when its current market price is below the holder’s purchase price. Data suggests that about 36.8 billion XRP tokens were acquired at higher prices, meaning those investors would incur losses if they sold now.
What is the XRP realized price and why is it important?
The Realized Price represents the average price at which all XRP tokens last moved on-chain. It acts as an estimate of the average investor cost basis. When the market price is above this level, most investors are in profit. When it falls below it, most investors are in loss.
Why are analysts comparing the current market to 2022?
The current on-chain structure, falling profitability, SOPR below 1, and price approaching the Realized Price, resembles the April 2022 period, which eventually led to a deeper bear market before XRP reached its cycle low.
Disclaimer:
The information provided in this article is for informational purposes only. It is not intended to be, nor should it be construed as, financial advice. We do not make any warranties regarding the completeness, reliability, or accuracy of this information. All investments involve risk, and past performance does not guarantee future results. We recommend consulting a financial advisor before making any investment decisions.
Giuseppe Ciccomascolo began his career as an investigative journalist in Italy, where he contributed to both local and national newspapers, focusing on various financial sectors.
Upon relocating to London, he worked as an analyst for Fitch's CapitalStructure and later as a Senior Reporter for Alliance News. In 2017, Giuseppe transitioned to covering cryptocurrency-related news, producing documentaries and articles on Bitcoin and other emerging digital currencies. He also played a pivotal role in establishing the academy for a cryptocurrency exchange website. Crypto remained his primary area of interest throughout his tenure as a writer for ThirdFloor.


 Easy
Easy