For the first time since Feb. 19, XRP Spot ETFs have recorded a net outflow this week.
The altcoin remains stuck in a consolidation phase, as bulls struggle to reclaim the $1.70 resistance.
For a realistic push toward $2, XRP must first break the descending trendline and reclaim $1.72.
XRP has been one of the more closely watched cryptos since the year began, buoyed by growing institutional interest and the expanding ecosystem of XRP-linked financial products.
But a critical data point has just shifted the near-term narrative. For the first time in weeks, XRP ETFs have recorded an outflow.
As a result of this move, XRP’s price could be at risk. Here is why and what could lie ahead for the altcoin.
XRP ETF Flows Signal Caution
ETF flow data is one of the most reliable real-time indicators of institutional sentiment across asset classes.
Sustained inflows reflect fresh capital entering through regulated, institutional-grade vehicles. However, outflows, even modest ones, reflect the opposite.
Get These Top Crypto Casino Offers Now!
Sponsored
Disclosure
We sometimes use affiliate links in our content, when clicking on those we might receive a commission at no extra cost to you. By using this website you agree to our terms and conditions and privacy policy.
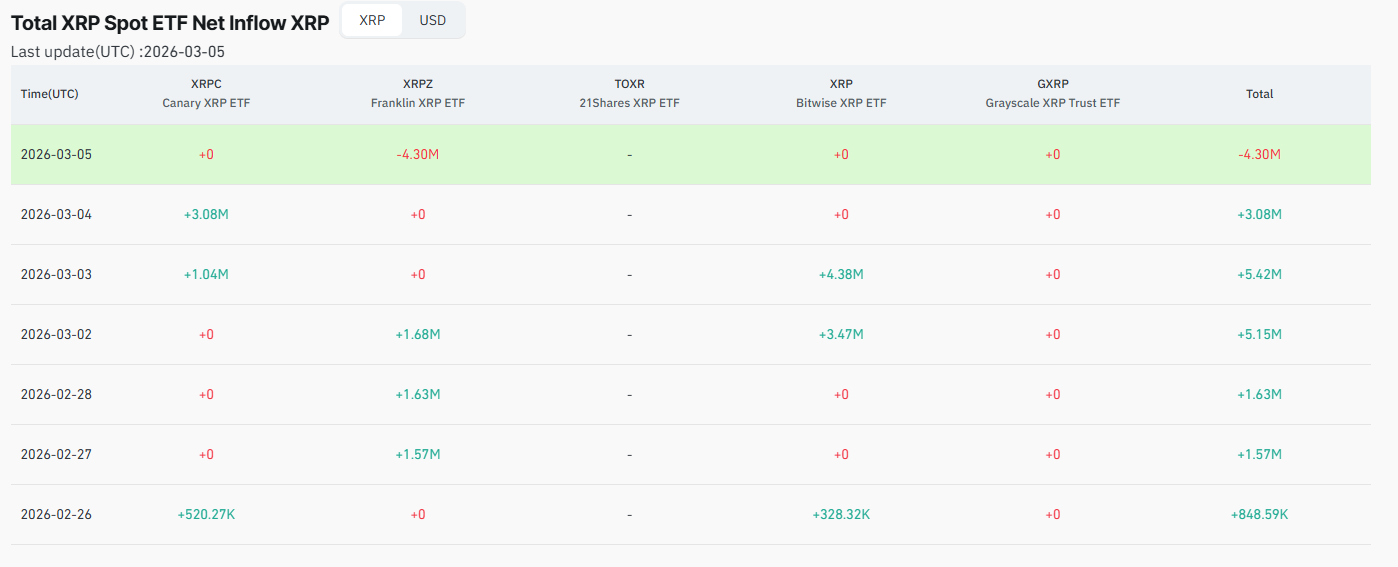
For context, the ETFs’ unbroken inflow streak from Feb. 19 onward had been quietly underpinning XRP’s price resilience amid broader altcoin weakness.
However, institutional flow data presents a more cautious backdrop. XRP Spot ETFs recorded their first net outflow in several sessions on March 5, totaling 4.30 million XRP.
The entire withdrawal came from the Franklin XRP ETF, while other funds, including the Canary XRP ETF, reported no flows during the period.
As a result, the cooling demand could make the $2 level a more difficult target in the near term.
Notably, without consistent ETF inflows to reinforce buying pressure, XRP’s price may struggle to build the momentum required to sustain a breakout toward that psychological resistance.
XRP Trades In Range
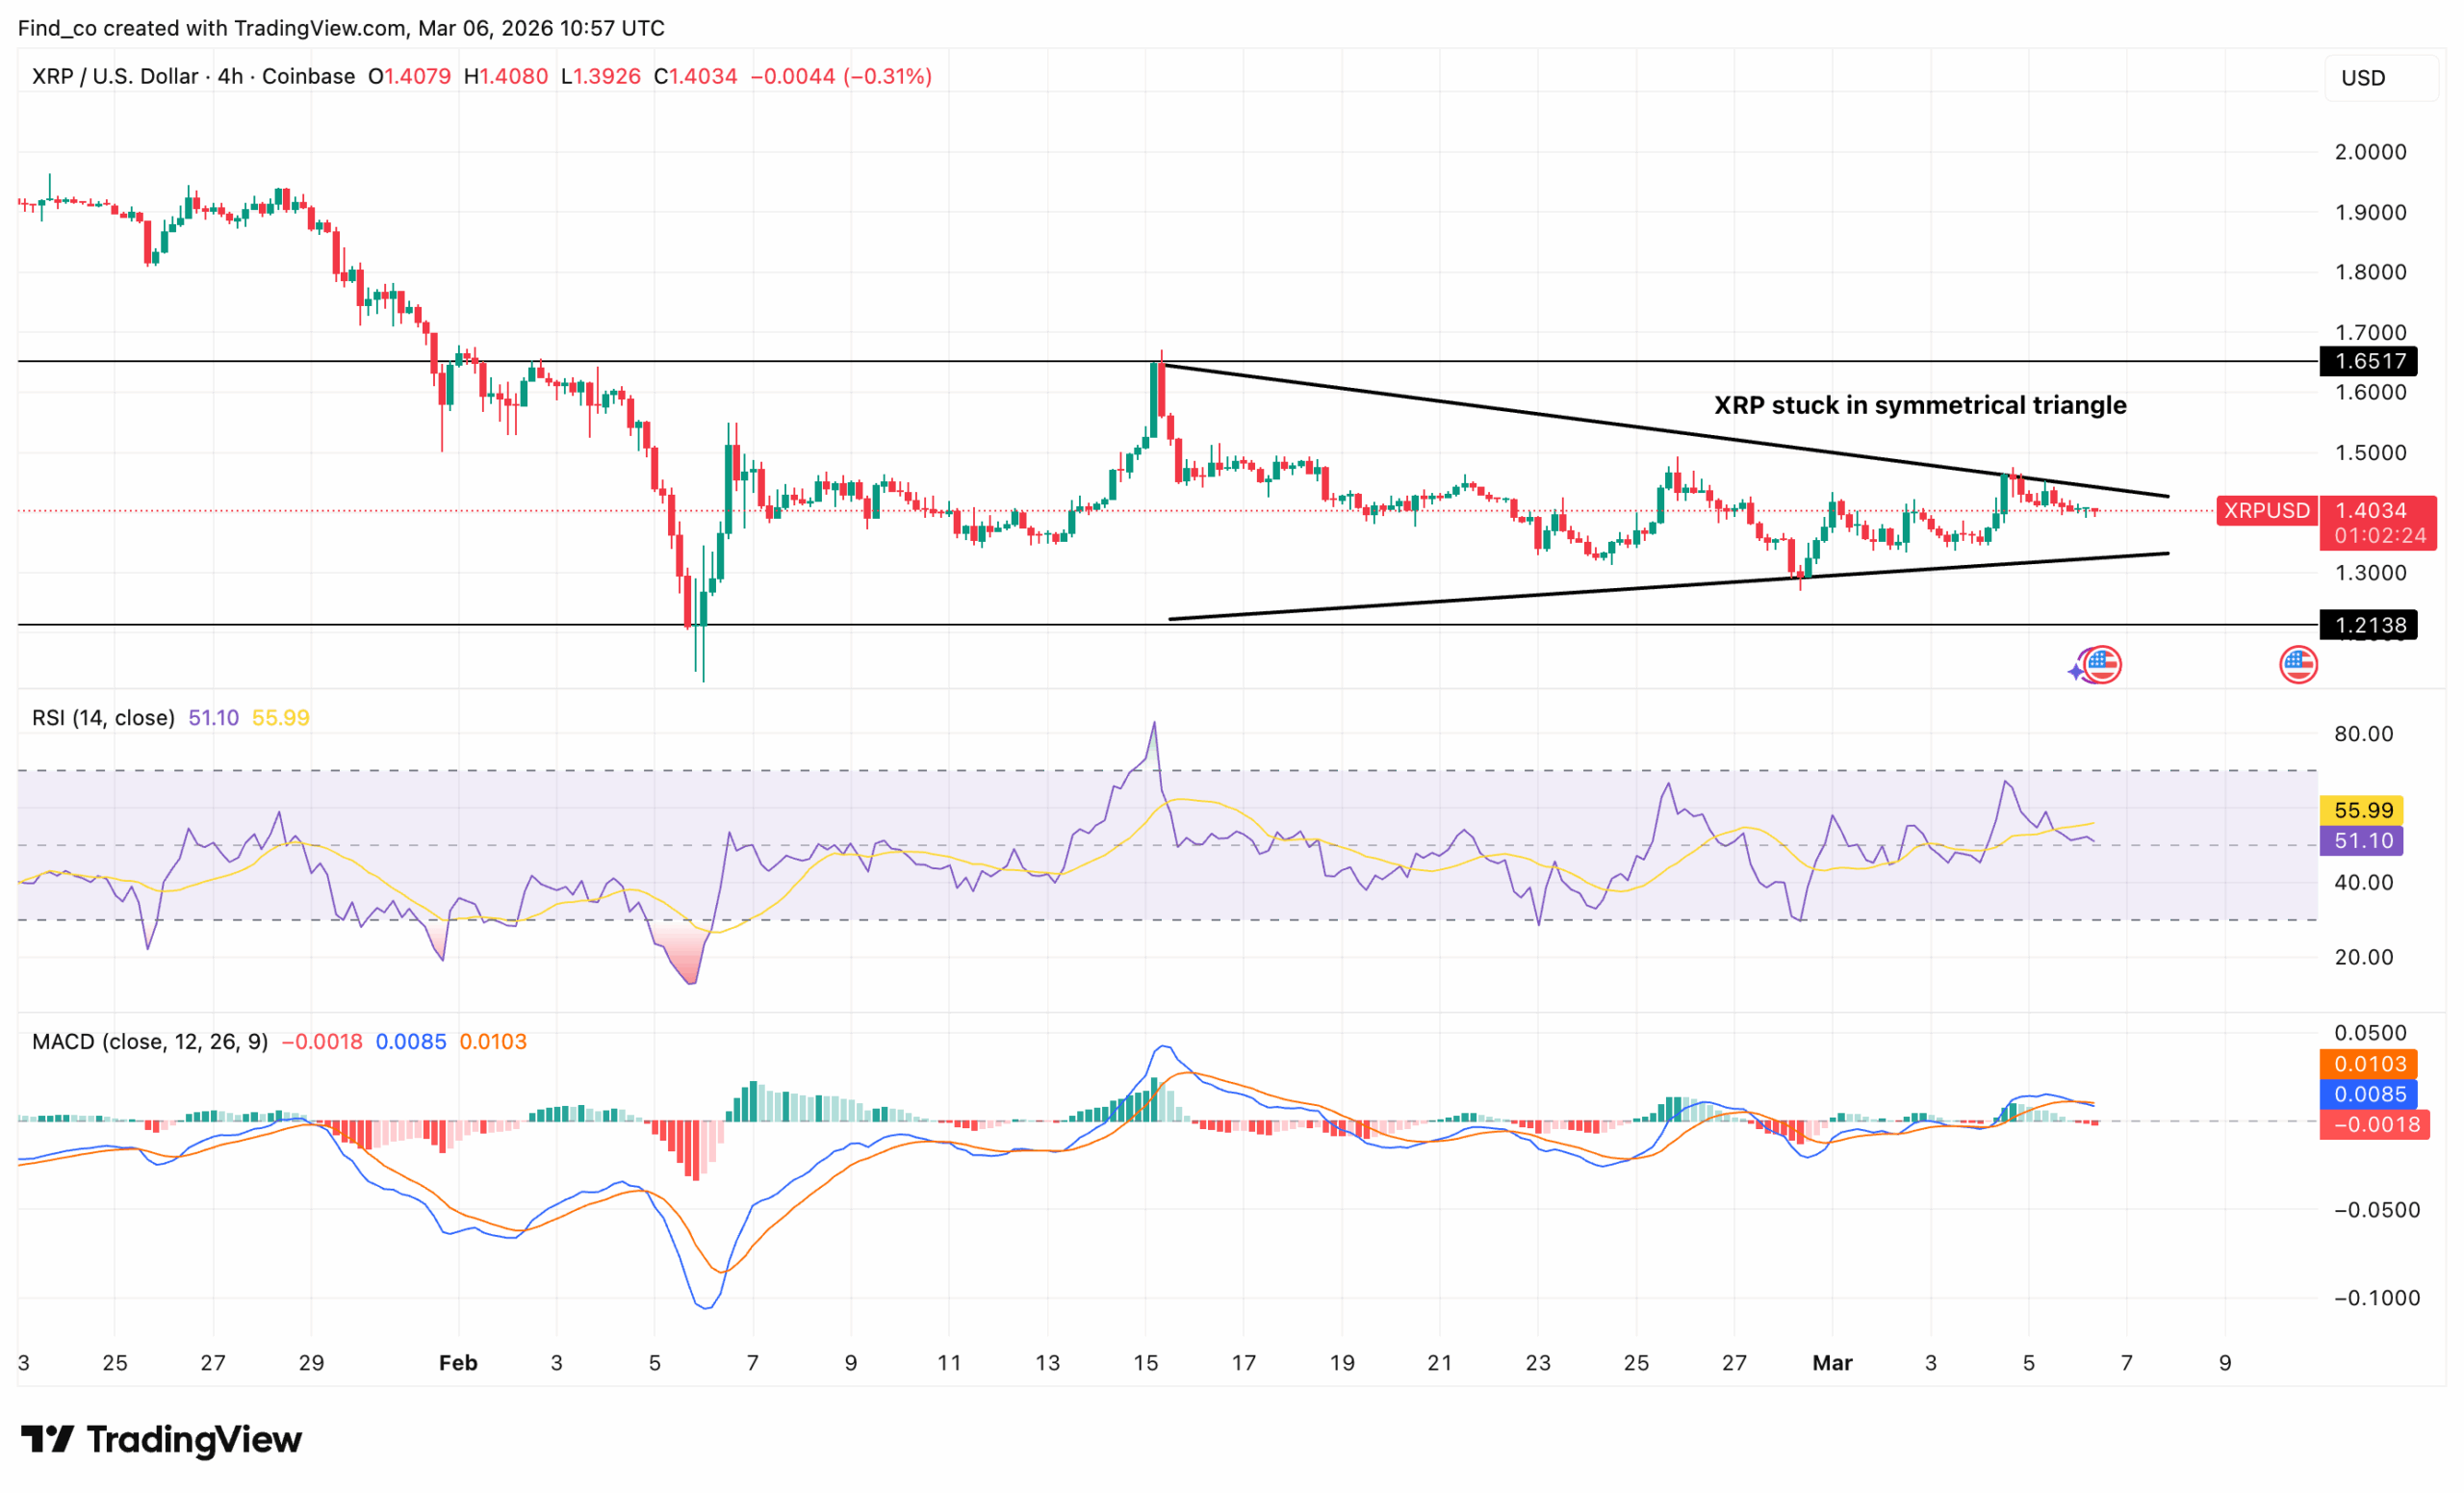
XRP is consolidating after a period of sharp volatility. As shown below, the cryptocurrency is recovering but remains stuck in a symmetrical triangle following a steep early-February sell-off that briefly pushed the price to $1.20.
However, buyers quickly stepped in, triggering a strong impulse rally that briefly tested the $1.65 resistance zone, a level that has historically capped upside moves.
Since then, XRP has entered a sideways consolidation, fluctuating between roughly $1.38 and $1.50. This range suggests the market is currently rebalancing after the earlier volatility spike.
Meanwhile, the price continues to hover around $1.40, signaling a temporary equilibrium between buyers and sellers.
Key momentum indicators on the 4-hour chart suggest a slow improvement in market sentiment.
The Relative Strength Index (RSI) has climbed slightly above the 50 midpoint, indicating that buying pressure is gradually increasing.
However, it remains far from overbought territory, which leaves room for further upside if momentum builds.
At the same time, the Moving Average Convergence Divergence (MACD) indicator is approaching a bullish crossover. The histogram has turned marginally positive, while the signal lines are converging.
Nevertheless, the move remains tentative, as strong confirmation would require sustained bullish candles and rising volume.
If buyers push XRP’s price above $1.50, the upside move could accelerate toward $1.65. A break above that level would likely confirm trend continuation toward higher highs.
XRP Price Forecast: Altcoin at Crossroads
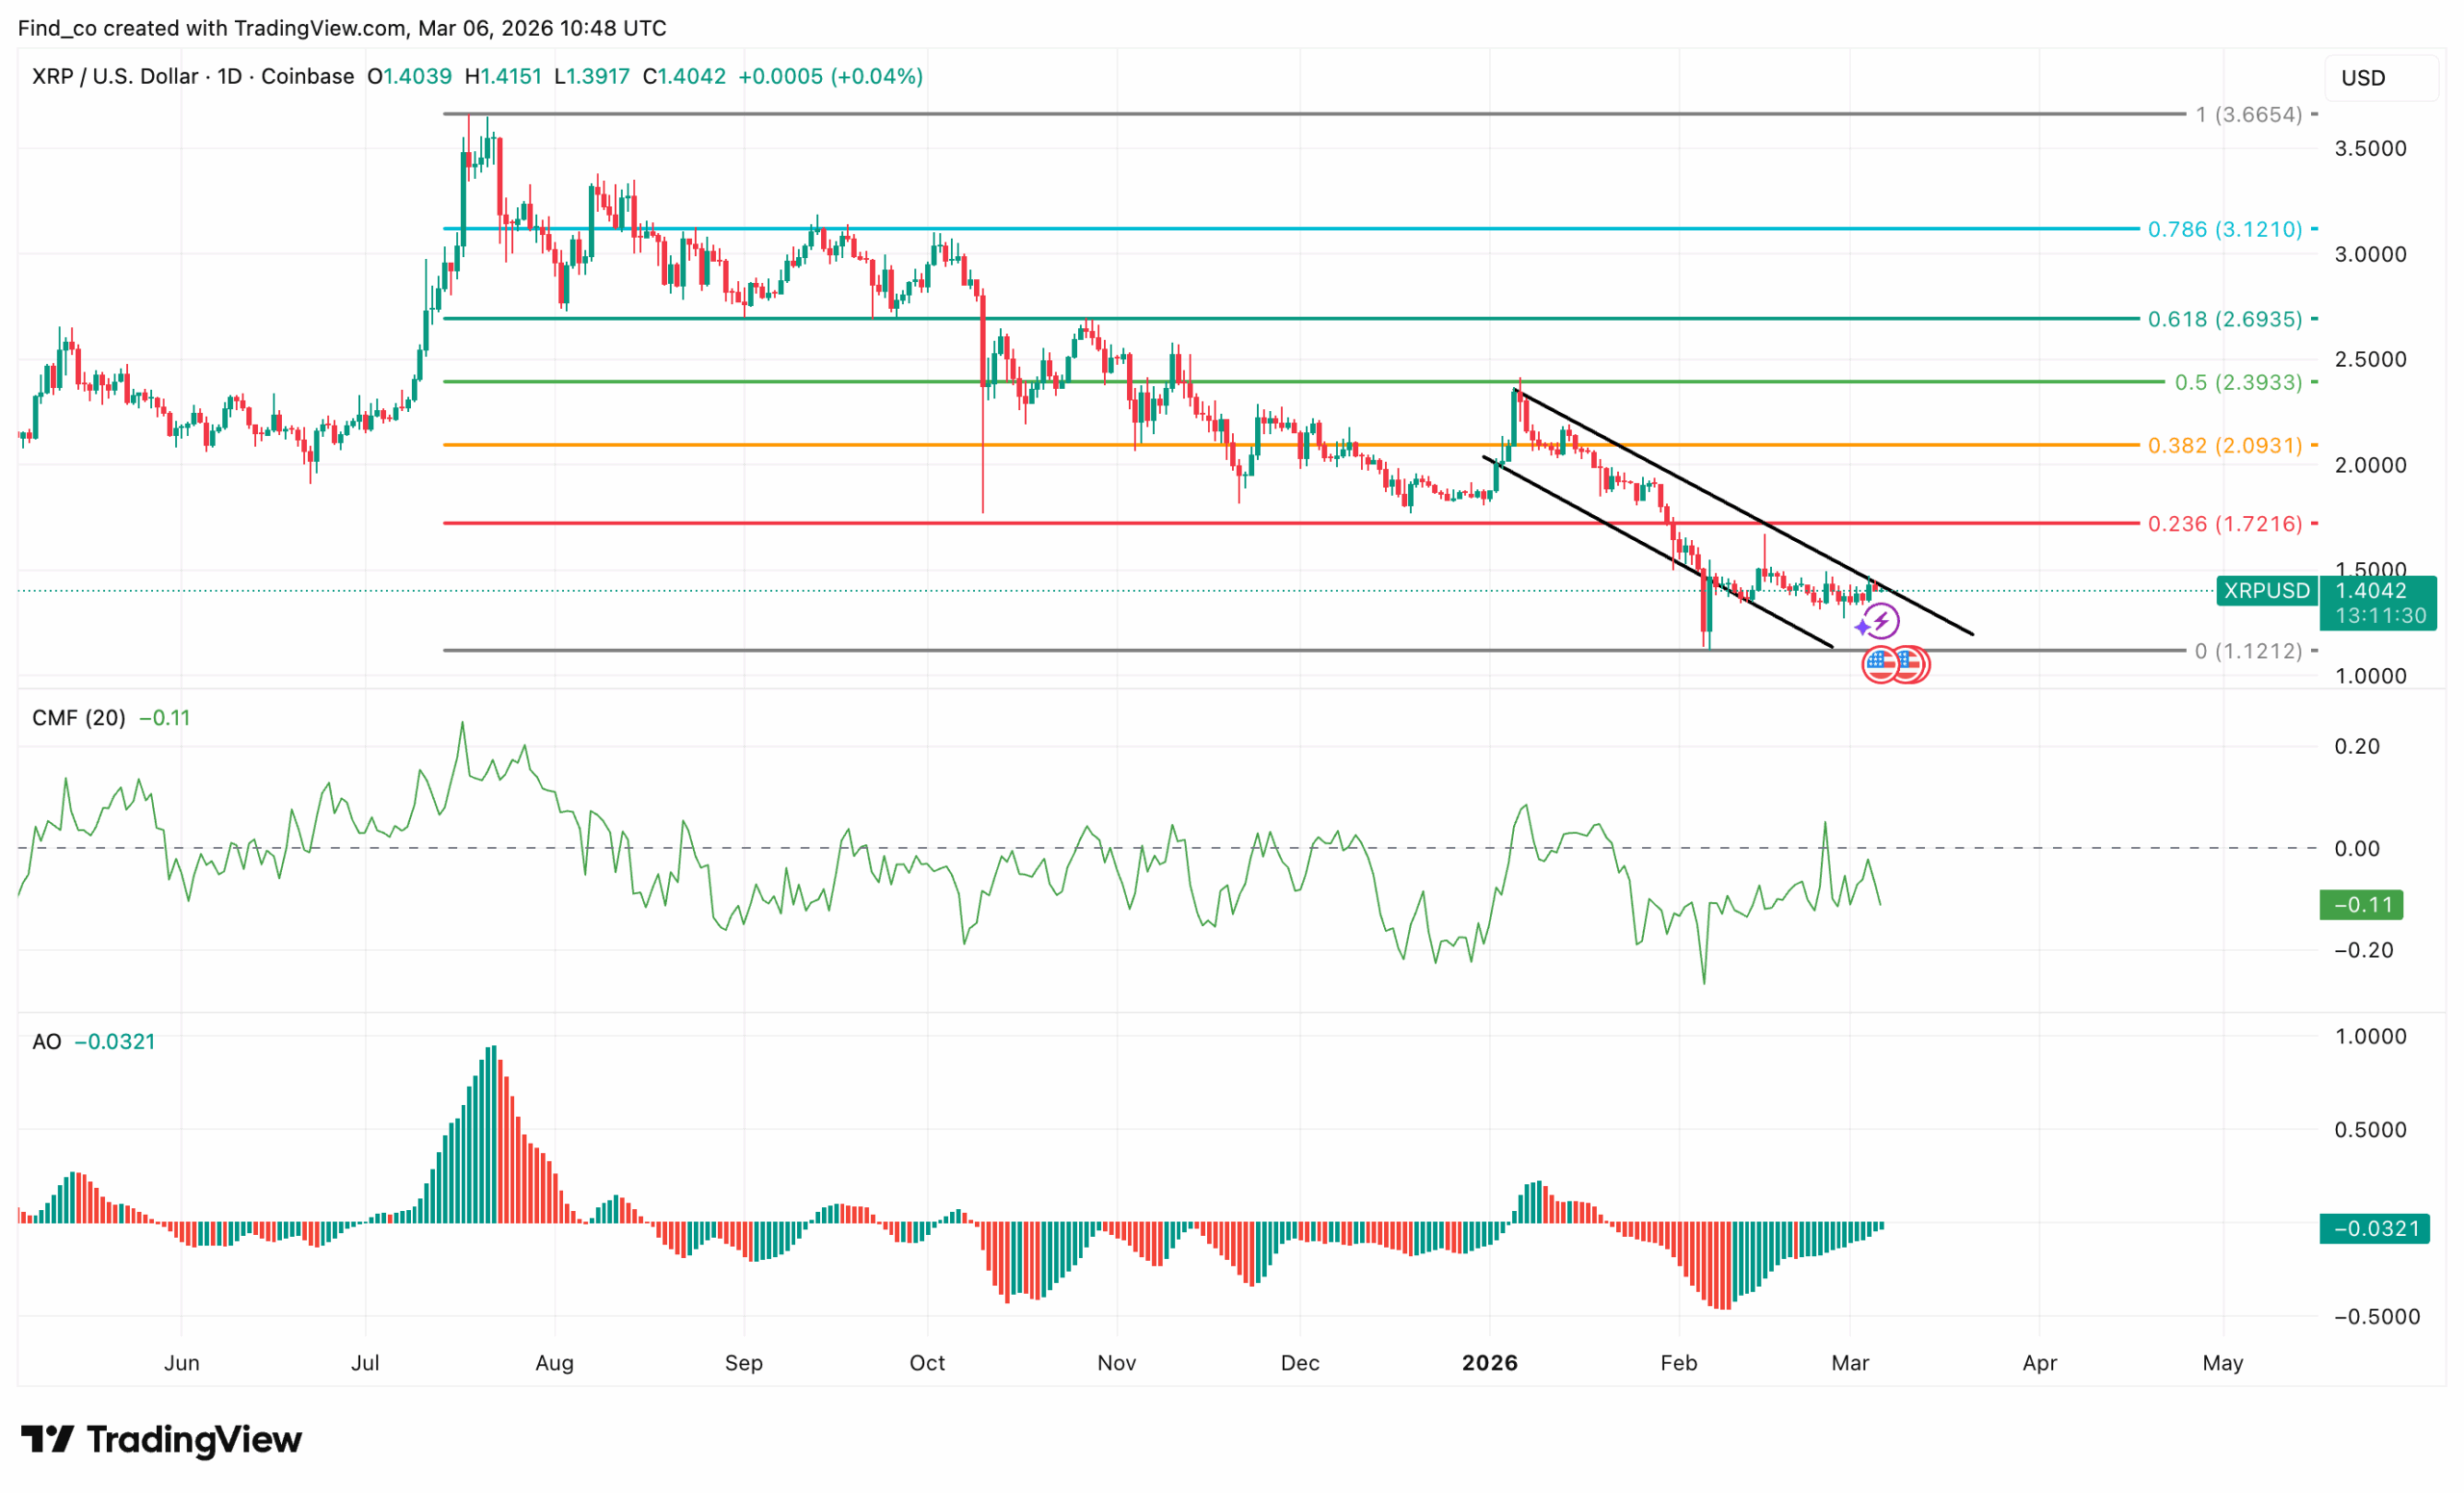
On the daily chart, XRP continues to trade within a broader descending channel, highlighting persistent bearish pressure over the past several months.
Price has repeatedly formed lower highs as sellers defend the structure’s upper boundary.
Consequently, each recovery attempt has struggled to gain traction, keeping the broader trend tilted to the downside.
Recently, the decline pushed XRP into a key support zone near $1.10. Buyers reacted strongly at this level, triggering a sharp rejection and allowing the asset to rebound toward $1.40.
Since then, price has moved into a consolidation phase beneath descending trendline resistance, signaling that sellers still maintain control of the larger structure.
Short-term indicators also reflect this caution. The Chaikin Money Flow (CMF) remains in negative territory, reinforcing ongoing selling pressure.
However, the Awesome Oscillator (AO) still sits below the zero line but has begun printing green histogram bars, signaling that bearish momentum is gradually weakening.
Even so, the path toward the $2 level remains challenging.
XRP’s price must first break the descending trendline and reclaim intermediate resistance near $1.72 before a sustained push toward $2 becomes realistic.
Disclaimer:
The information provided in this article is for informational purposes only. It is not intended to be, nor should it be construed as, financial advice. We do not make any warranties regarding the completeness, reliability, or accuracy of this information. All investments involve risk, and past performance does not guarantee future results. We recommend consulting a financial advisor before making any investment decisions.
Victor Olanrewaju is a crypto analyst and reporter at CCN with deep roots in on-chain research and technical analysis. His crypto journey began in 2017, but it was the 2020 Uniswap airdrop that sparked a full-time pivot into the space.
With a foundation in copywriting, Victor honed his craft creating high-converting content for leading crypto brokers — most notably an XRP price prediction that ranked #1 on Google during the 2021 bull run.
He later joined AMBCrypto in 2022, where he combined storytelling with technical and on-chain analysis to cover key market narratives.
In 2024, he expanded his expertise at BeInCrypto, collaborating with analysts and using tools like Glassnode, Santiment, and IntoTheBlock to break down Bitcoin and altcoin trends.
At CCN, Victor covers the top cryptocurrencies, memecoins, macro shifts, blending real-time insights with deep-dive metrics.
He holds a Bachelor’s degree in Physics from the University of Ibadan, equipping him to simplify complex data for a wide audience. Follow his work or connect on LinkedIn or X.