XRP investors are facing $50.8B in unrealized losses as 36.8B tokens fall underwater. On-chain data, SOPR trends, and XRP’s realized price signal a critical phase for the market. | Credit: CCN.com
Share
Key Takeaways
XRP has posted declining March returns every year since 2023 and is already down 1.39% in March 2026, raising questions about whether the trend will continue.
On-chain data provides a contrarian signal of growing underlying demand despite poor market sentiment.
A failure to attract new demand could send the token toward $1.11, while a bullish reversal opens the door to $1.61.
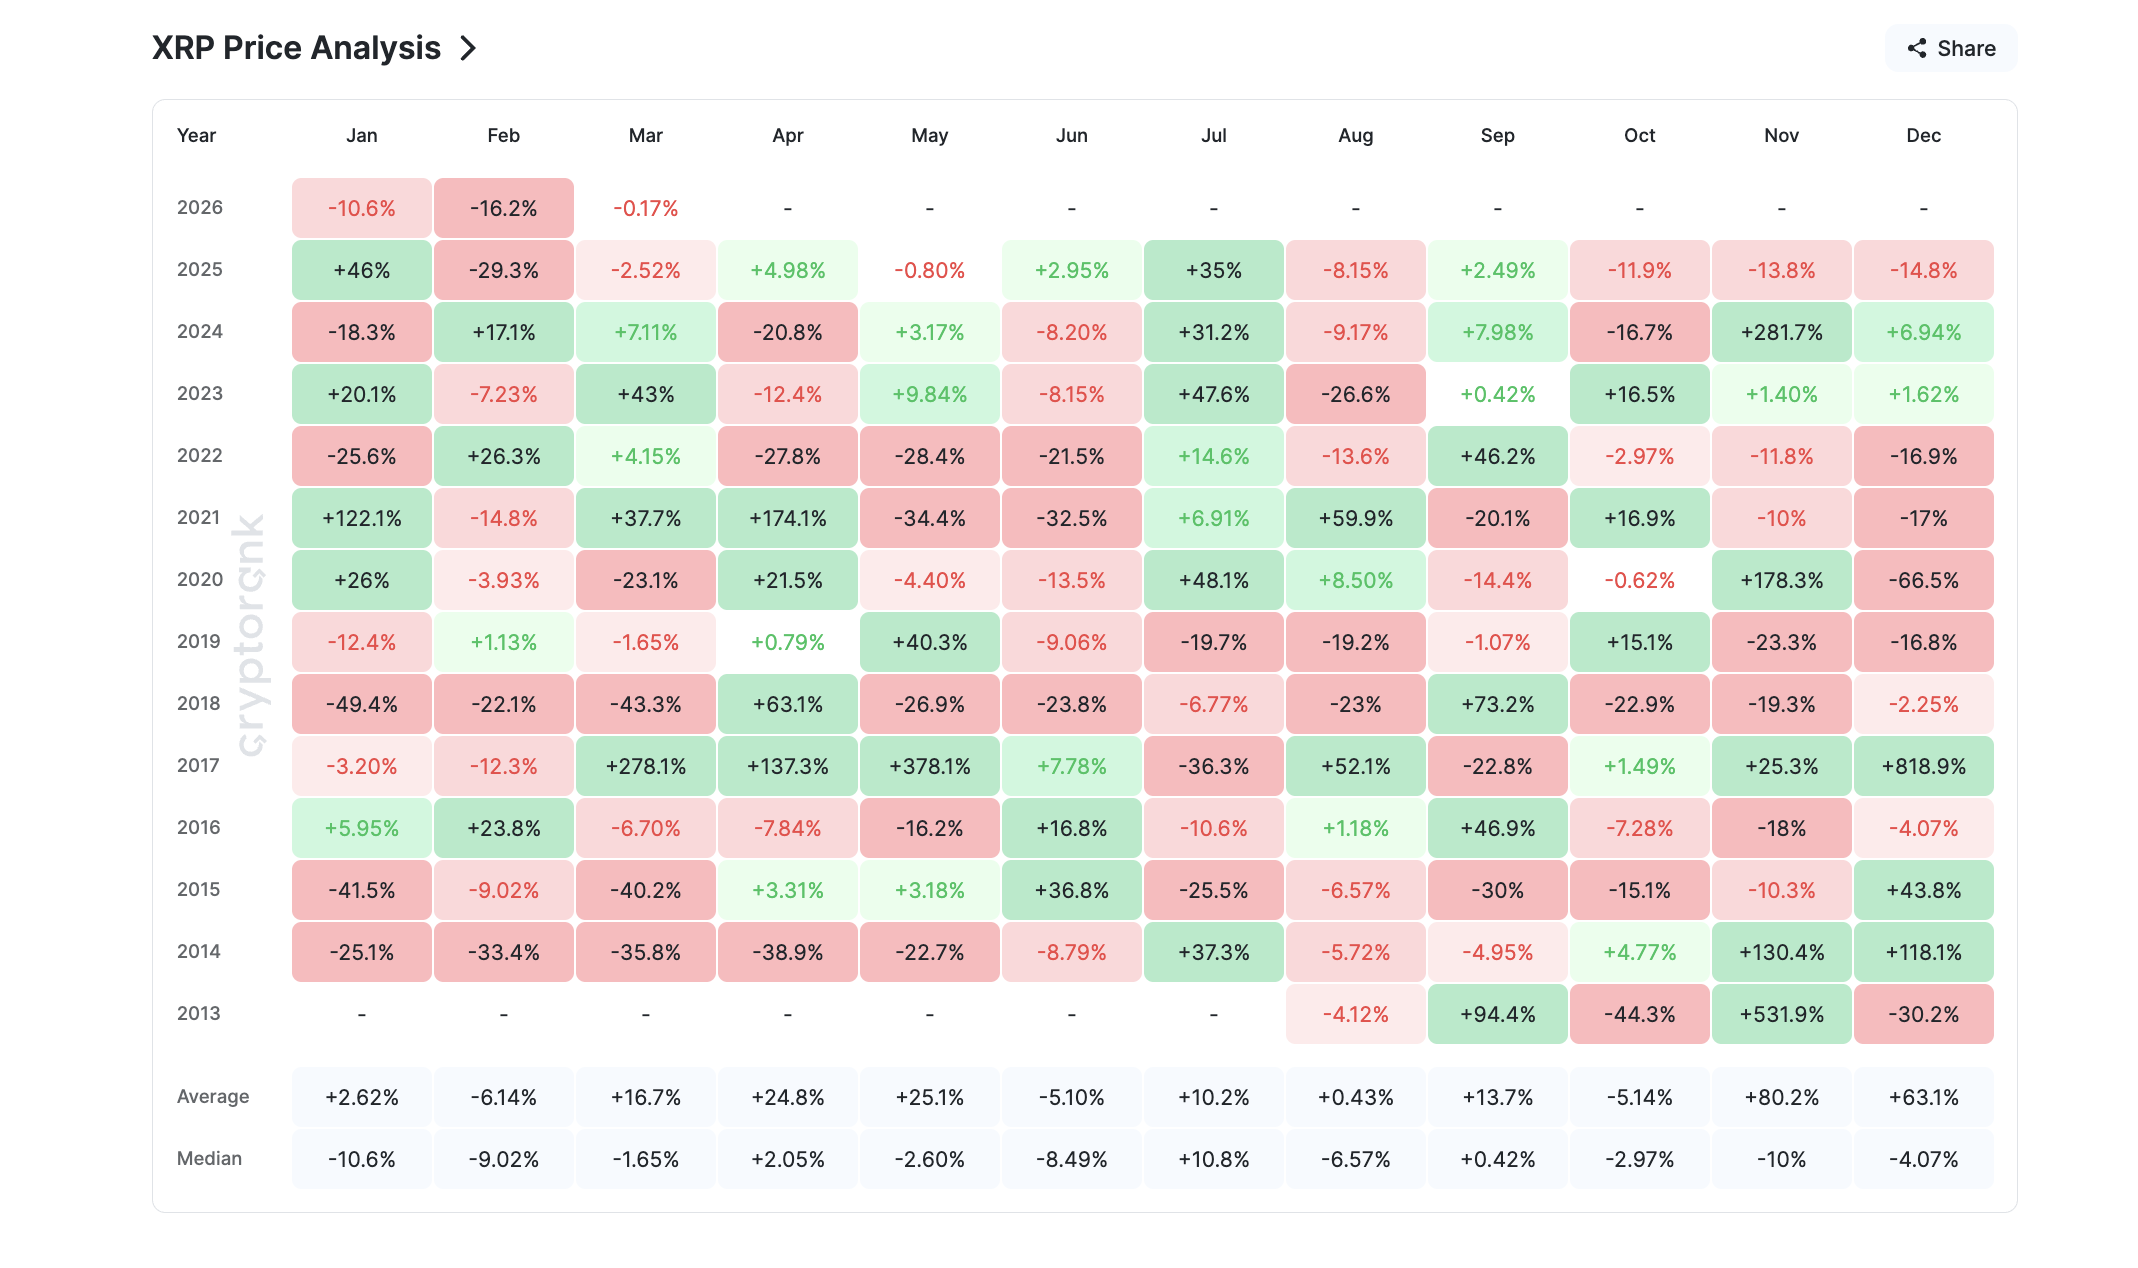
A historical review of XRP’s March performance reveals a steady pattern of declining returns since 2023.
This trend, combined with the current waning market sentiment and challenging macroeconomic conditions, raises questions about where the altcoin is headed as March 2026 begins.
Three Years of Fading March Momentum
Data from CryptoRank shows a steady decline in XRP’s March returns since 2023.
That year, the altcoin surged 43% over the month as market participants bet heavily on a favorable outcome in the SEC v. Ripple case.
The anticipation of Judge Analisa Torres’ summary judgment, which later came in July of that year, triggered a classic “buy the rumor” rally, which delivered one of XRP’s strongest single-month performances.
In March 2024, XRP posted a 7.11% gain, a positive result, but a steep decline from the previous year’s rally.
Then in March 2025, the token slipped further, closing the month down 2.52% as broader market enthusiasm around it cooled.
XRP is already down 1.39% this month. Will the decline continue?
On-Chain Data Tells a Different Story
Broader market sentiment has deteriorated since March began, primarily due to escalating geopolitical tensions in the Middle East. This has kept XRP’s price stuck in a sideways trend, hinting at a continuation of its historical decline.
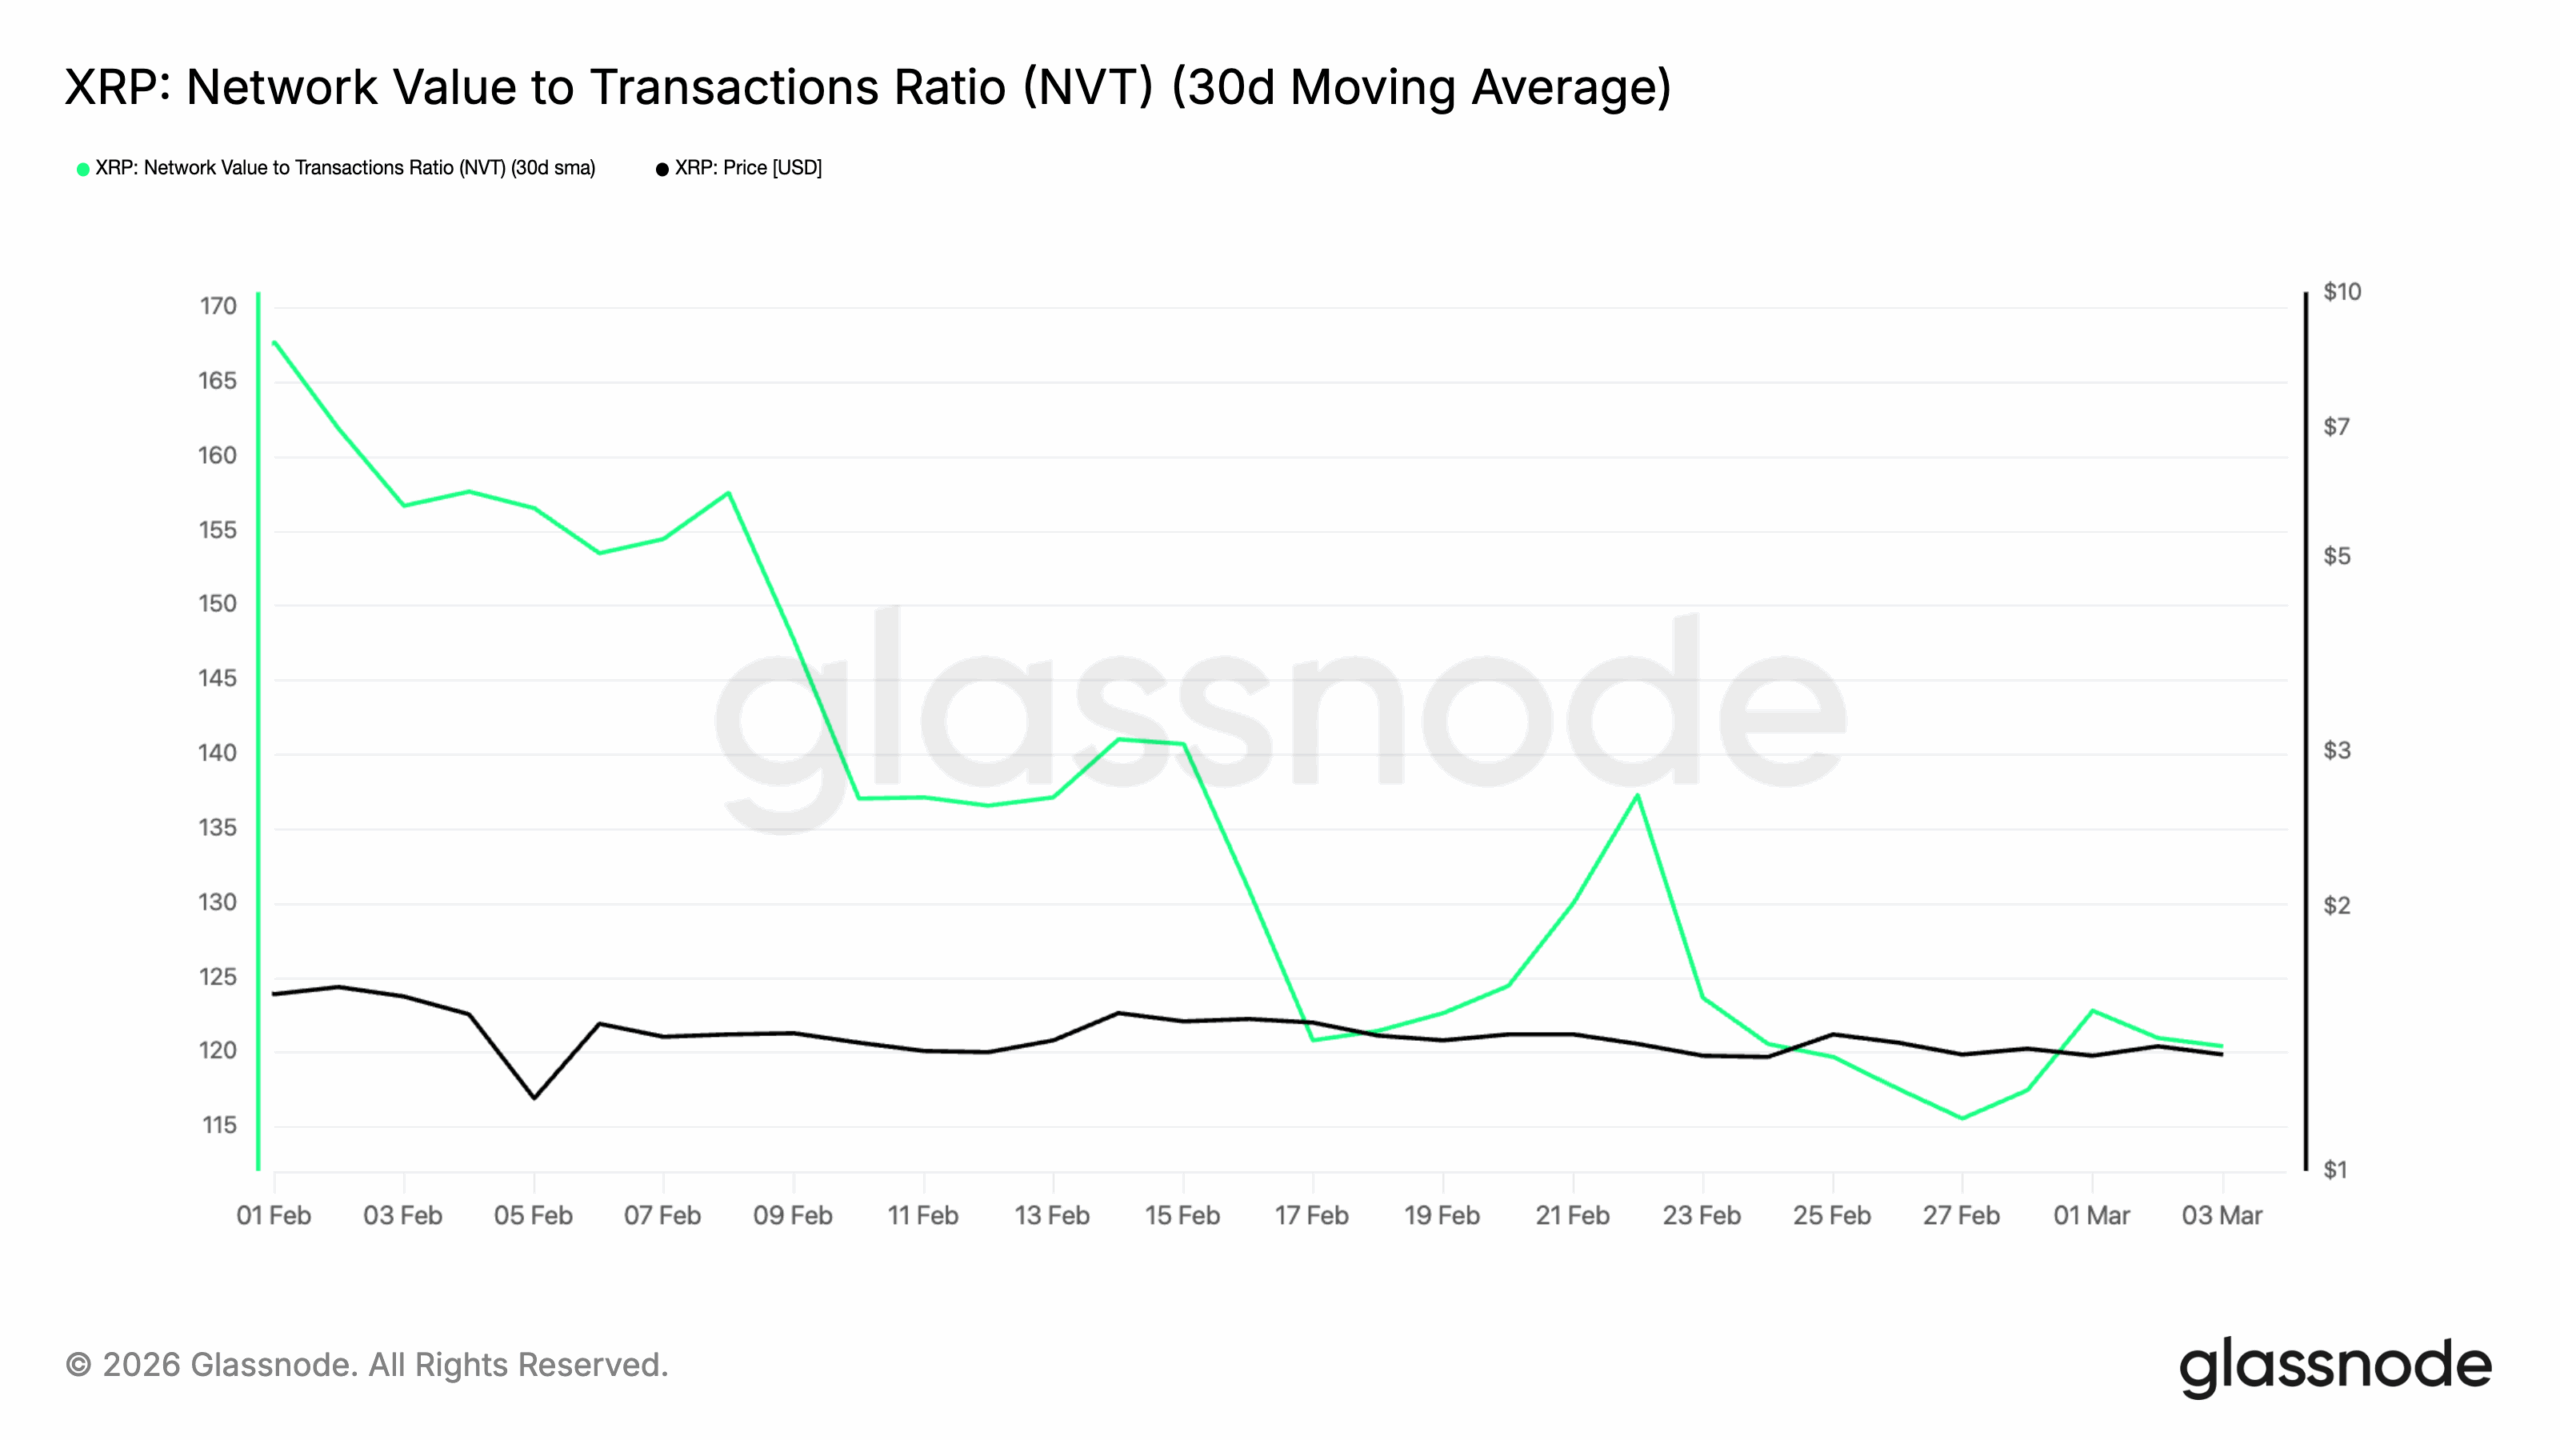
Yet beneath the surface, on-chain data paints a different picture. According to Glassnode, XRP’s Network Value to Transactions (NVT) Ratio (using a 30-day small moving average) has fallen significantly over the past month, a signal that transaction volume on the XRP Ledger is outpacing the token’s current market valuation.
The NVT ratio gauges whether an asset is overvalued or undervalued by comparing its market capitalization to transaction volume.
When the ratio spikes, it signals that an asset’s market capitalization is growing faster than the volume of value being transacted on its network. This trend normally precedes downward price corrections.
On the other hand, when it falls, network transaction volume outpaces market capitalization growth, suggesting potential undervaluation. This presents an attractive entry point for XRP holders, whose strong demand may drive prices higher as the month progresses.
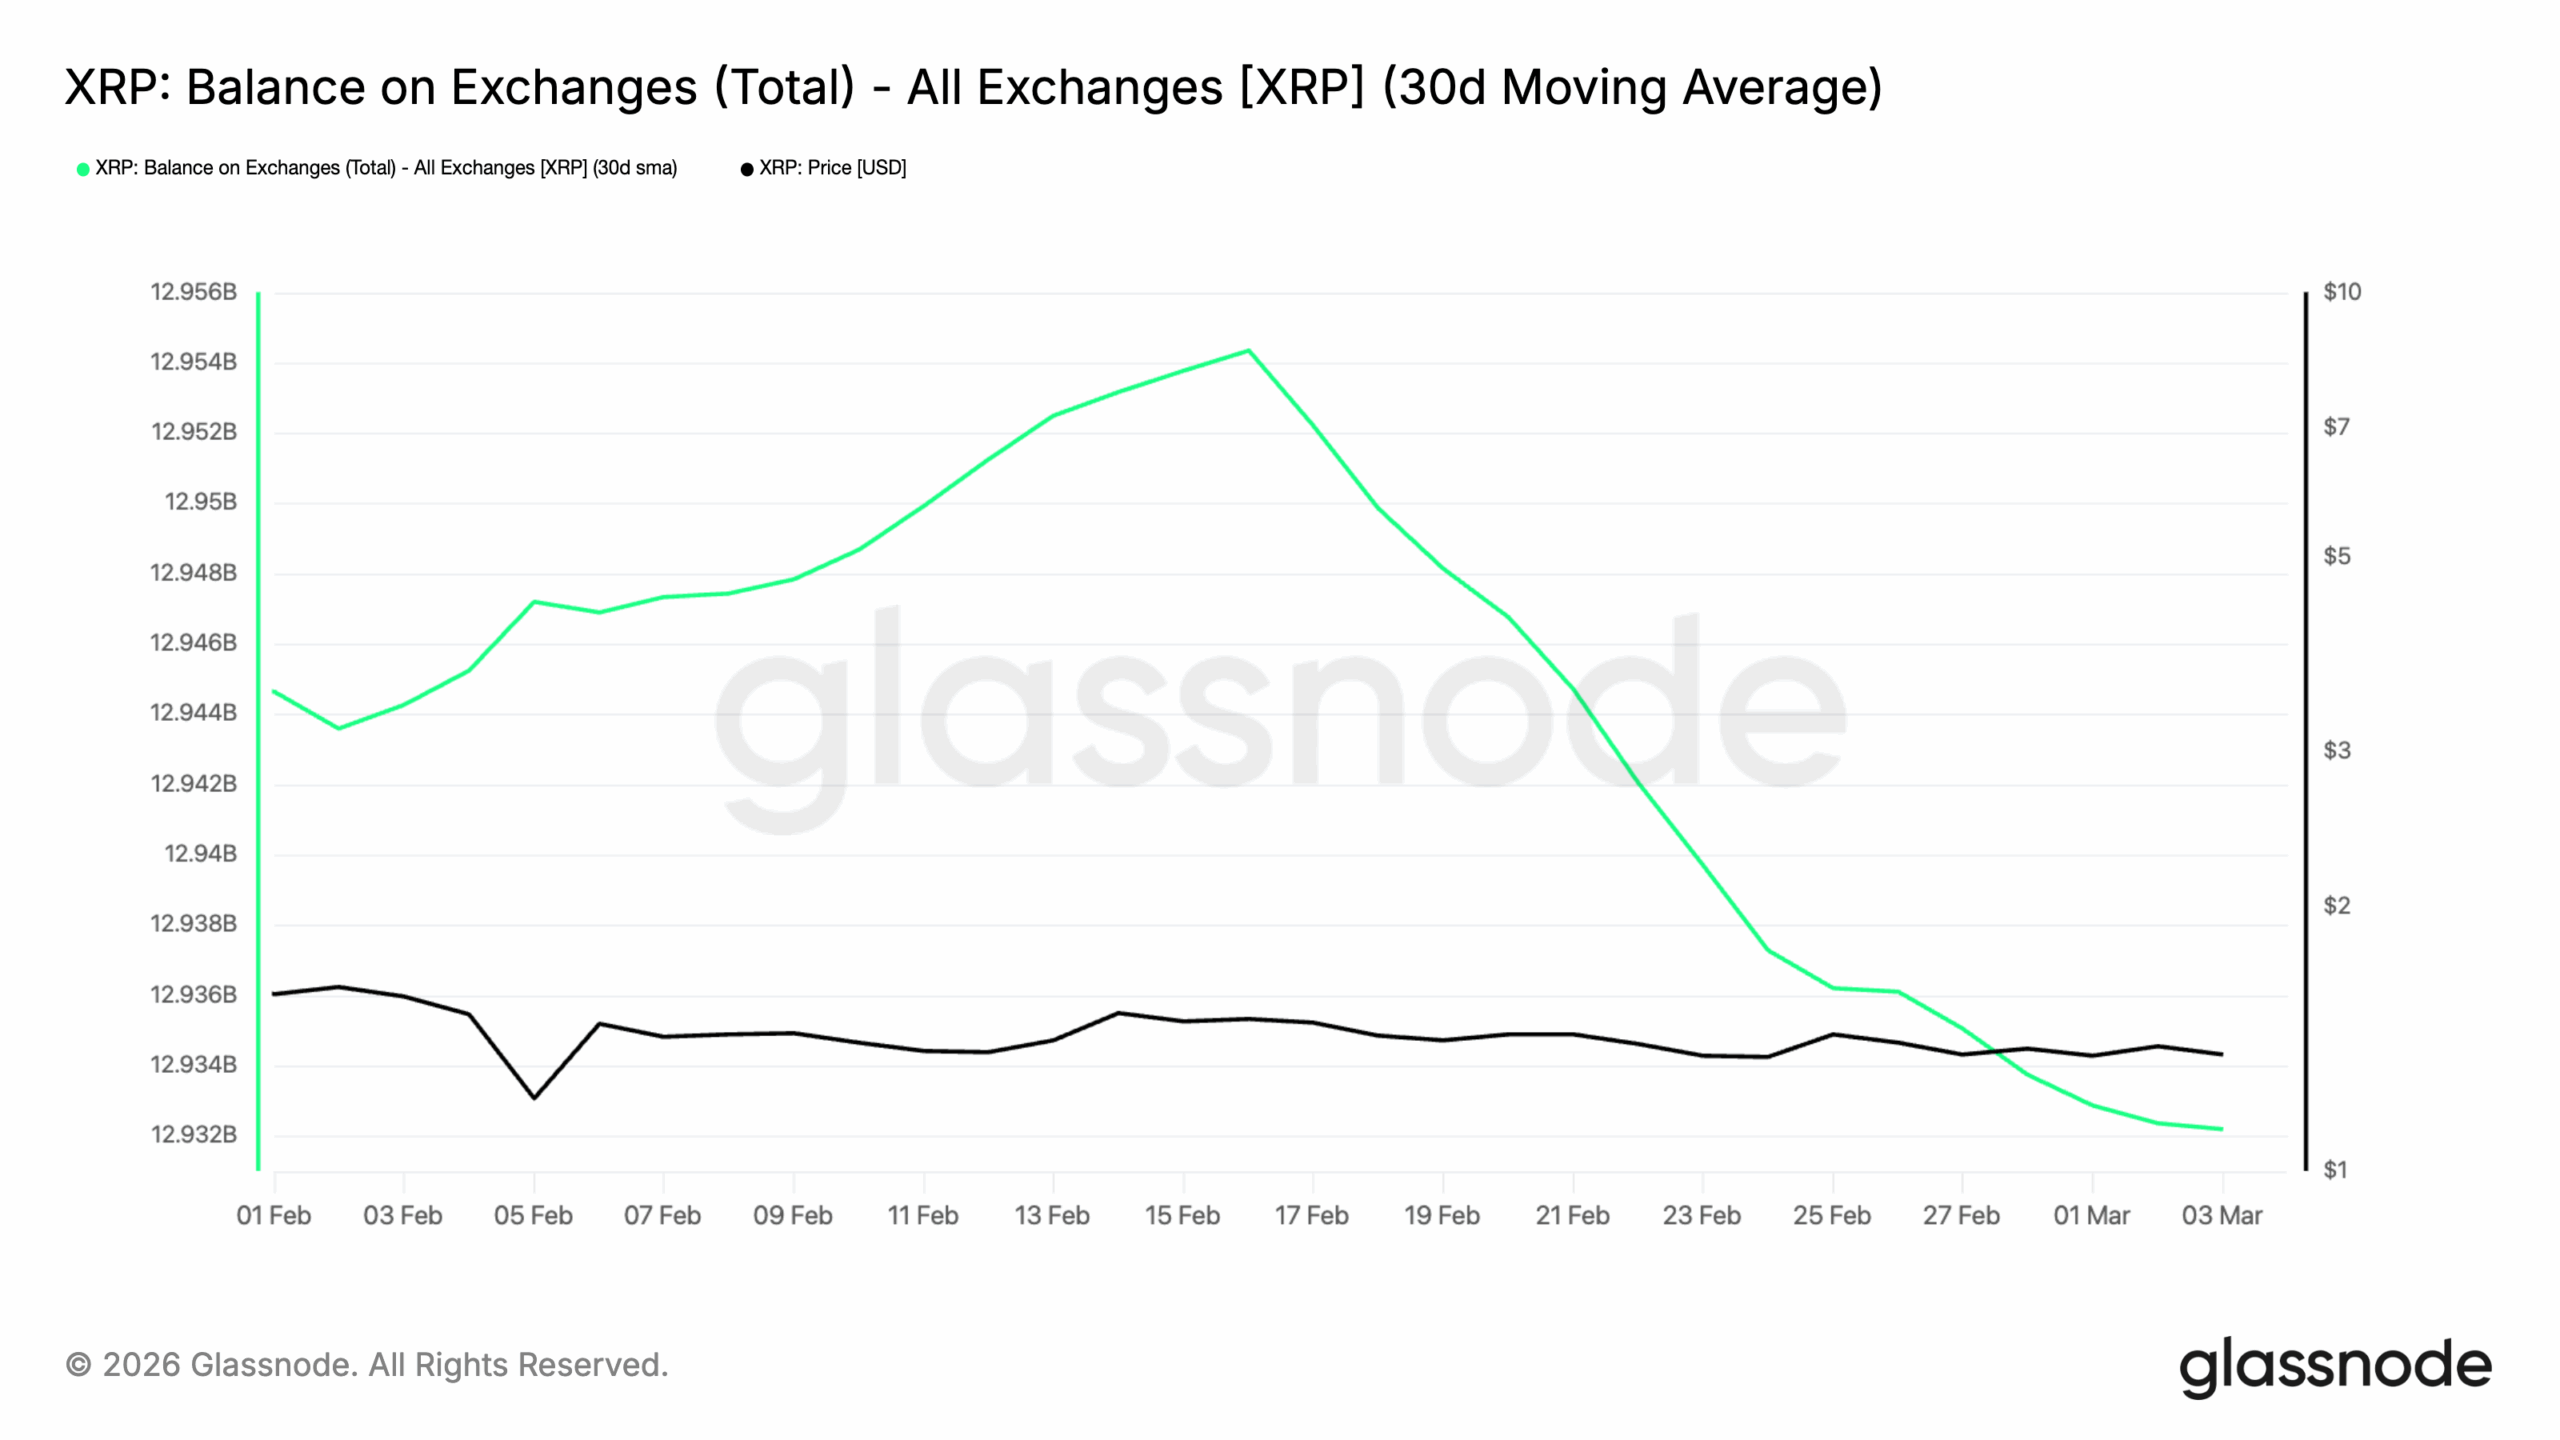
Additionally, XRP’s exchange activity has fallen steadily since mid-February. According to Glassnode, the token’s Exchange Balance currently sits at 12.93 billion XRP, down 0.15% since February 16.
Declining exchange inflows like this typically indicate that holders are opting to keep coins off exchanges rather than positioning for immediate sale.
This trend is particularly interesting considering the general market’s lackluster performance. If it holds, it may drive XRP to close this month recording gains.
CoinRabbit’s Chief Strategy & Growth Officer, Walter Barrett, had this to say:
“While XRP’s March performance has weakened in recent years, current market data suggests a different underlying dynamic. Exchange flows indicate steady spot demand and signs of accumulation. We are also seeing increased XRP inflows on CoinRabbit, including activity from institutional investors, which often reflects the use of the asset as part of broader capital management and preservation strategies. This type of accumulation may signal strengthening investor confidence and could reduce the impact of the seasonal weakness seen in previous years.”
What to Expect from XRP in March 2026
While XRP’s falling NVT ratio and easing exchange activity suggest that underlying demand on the XRPL remains strong, a look at the token’s daily chart reveals that bears still hold the upper hand.
Demand may be building, but the strength of prevailing bearish sentiment means it could take time for this to translate into meaningful price recovery.
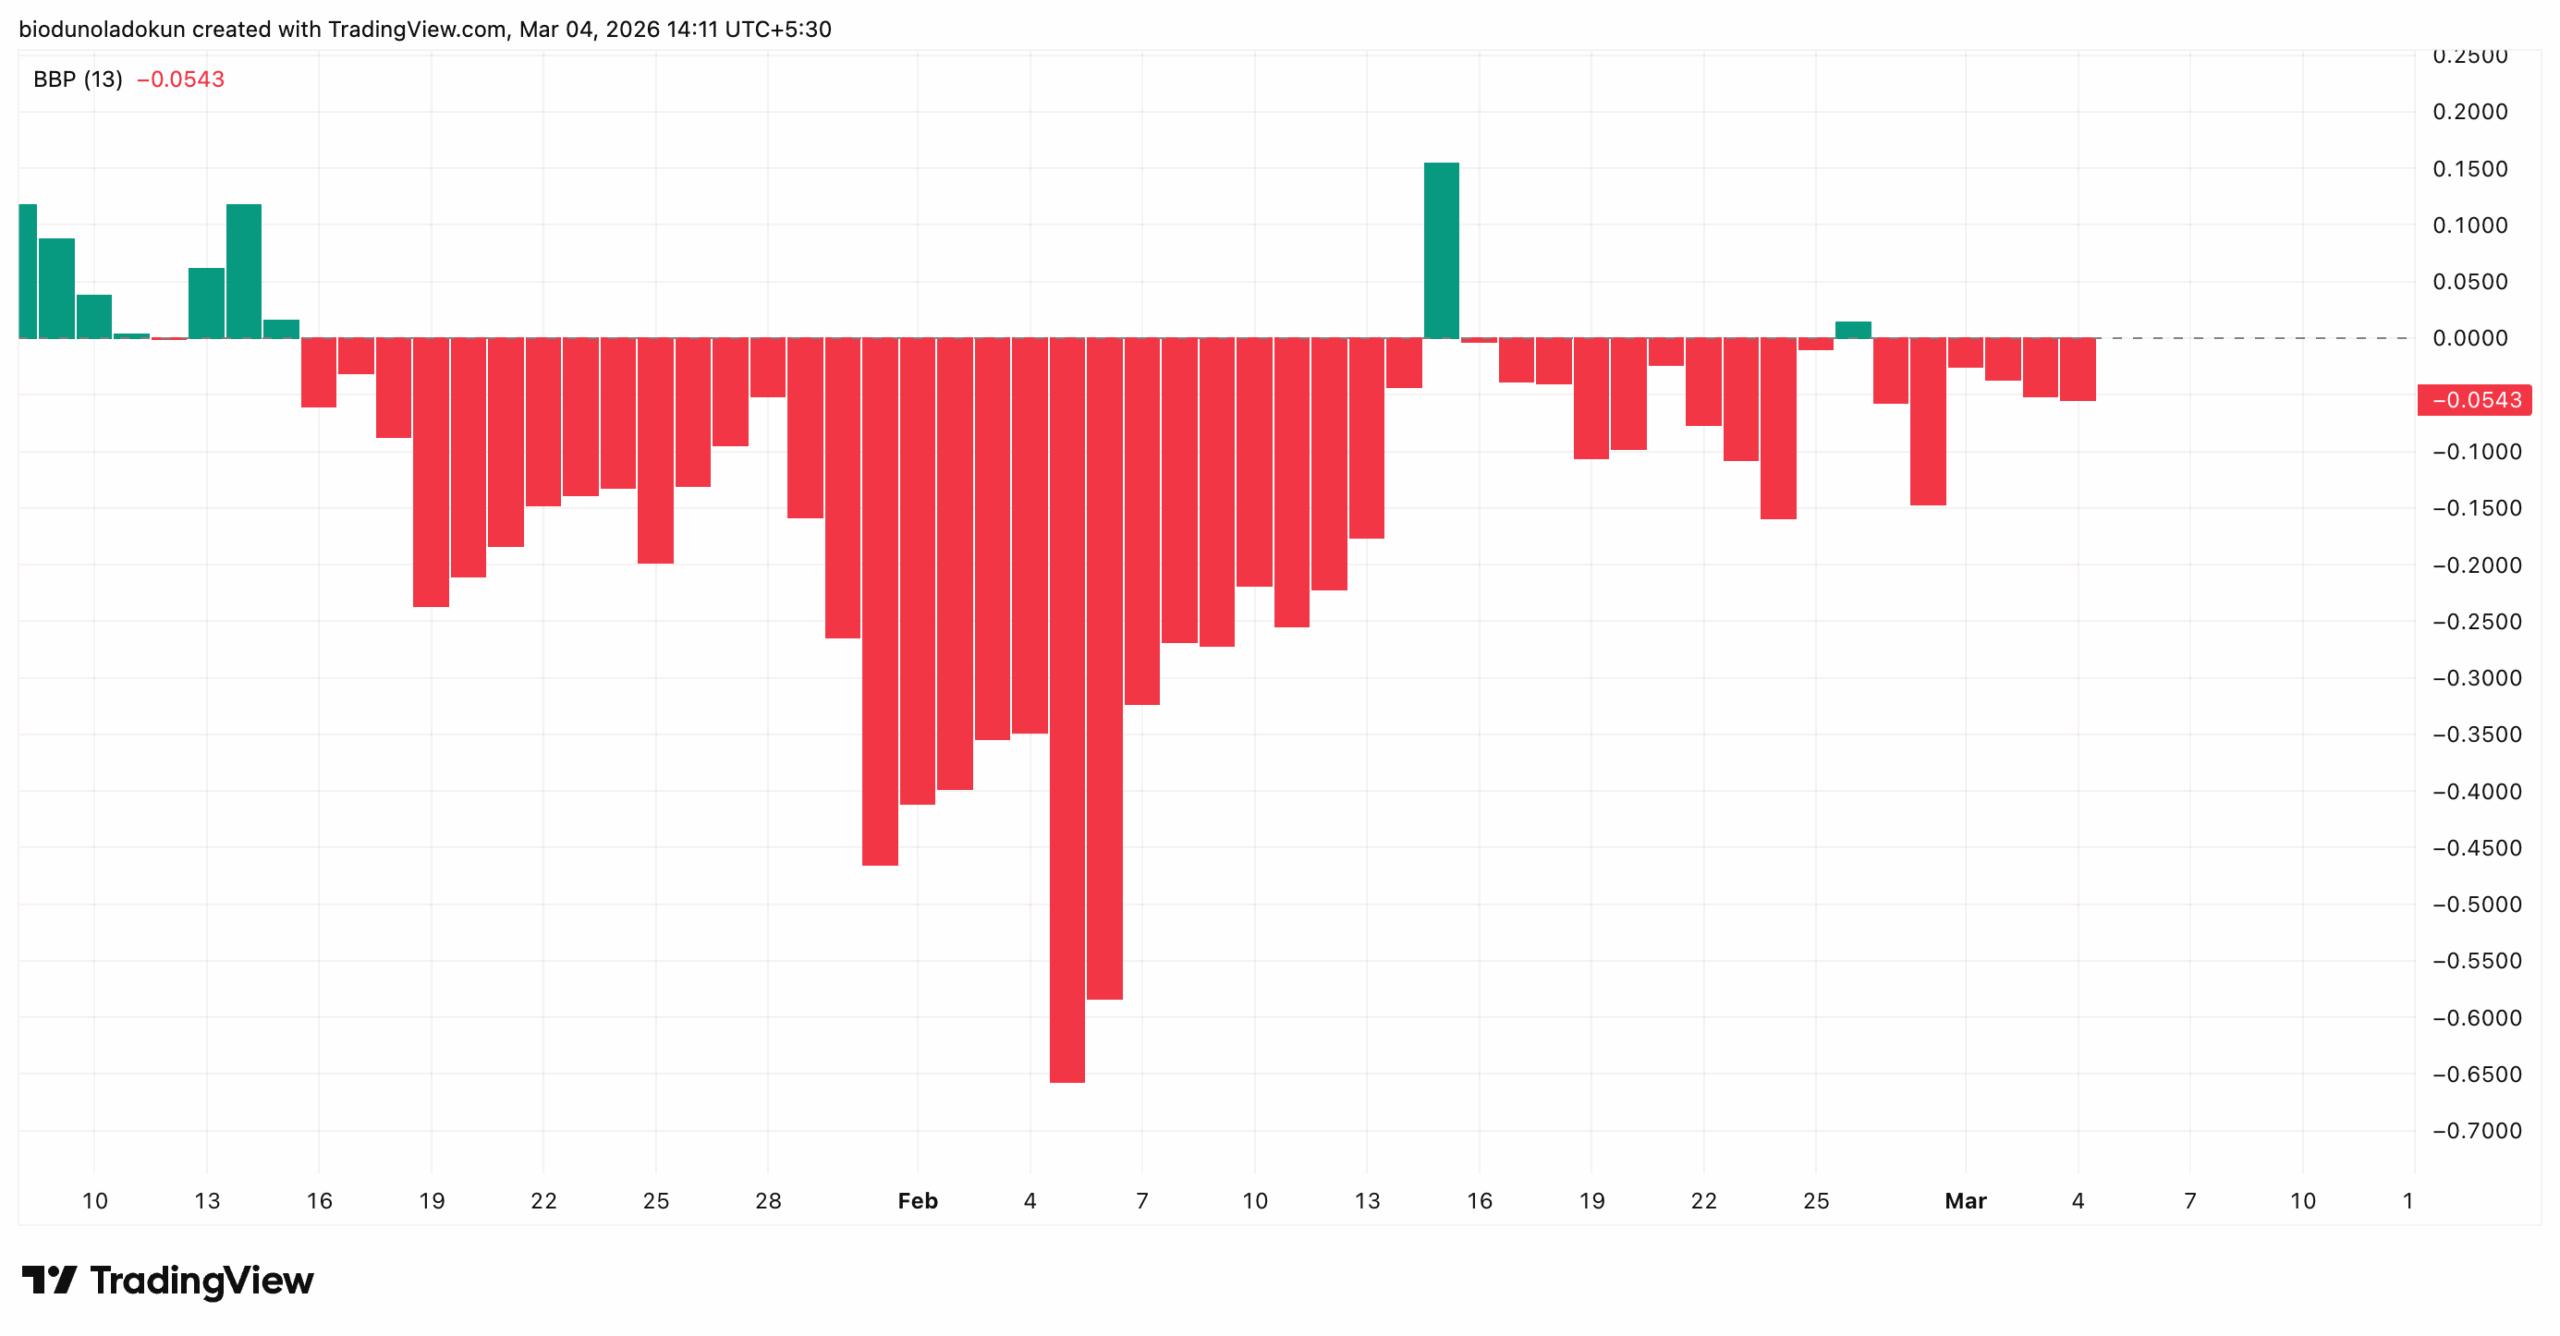
This is reflected in the coin’s Elder-Ray Index, which has returned significantly negative values since January 16.
The Elder-Ray Index measures the strength of bulls and bears in the market by comparing buying pressure (Bull Power) against selling pressure (Bear Power).
When the value is positive, buyers outnumber sellers, suggesting a potential uptrend.
Conversely, when it returns negative values, sellers remain in control.
A sustained sell-side dominance of this duration signals that bears have maintained a firm grip on XRP’s price trajectory for nearly seven weeks, with no decisive shift in momentum yet visible.
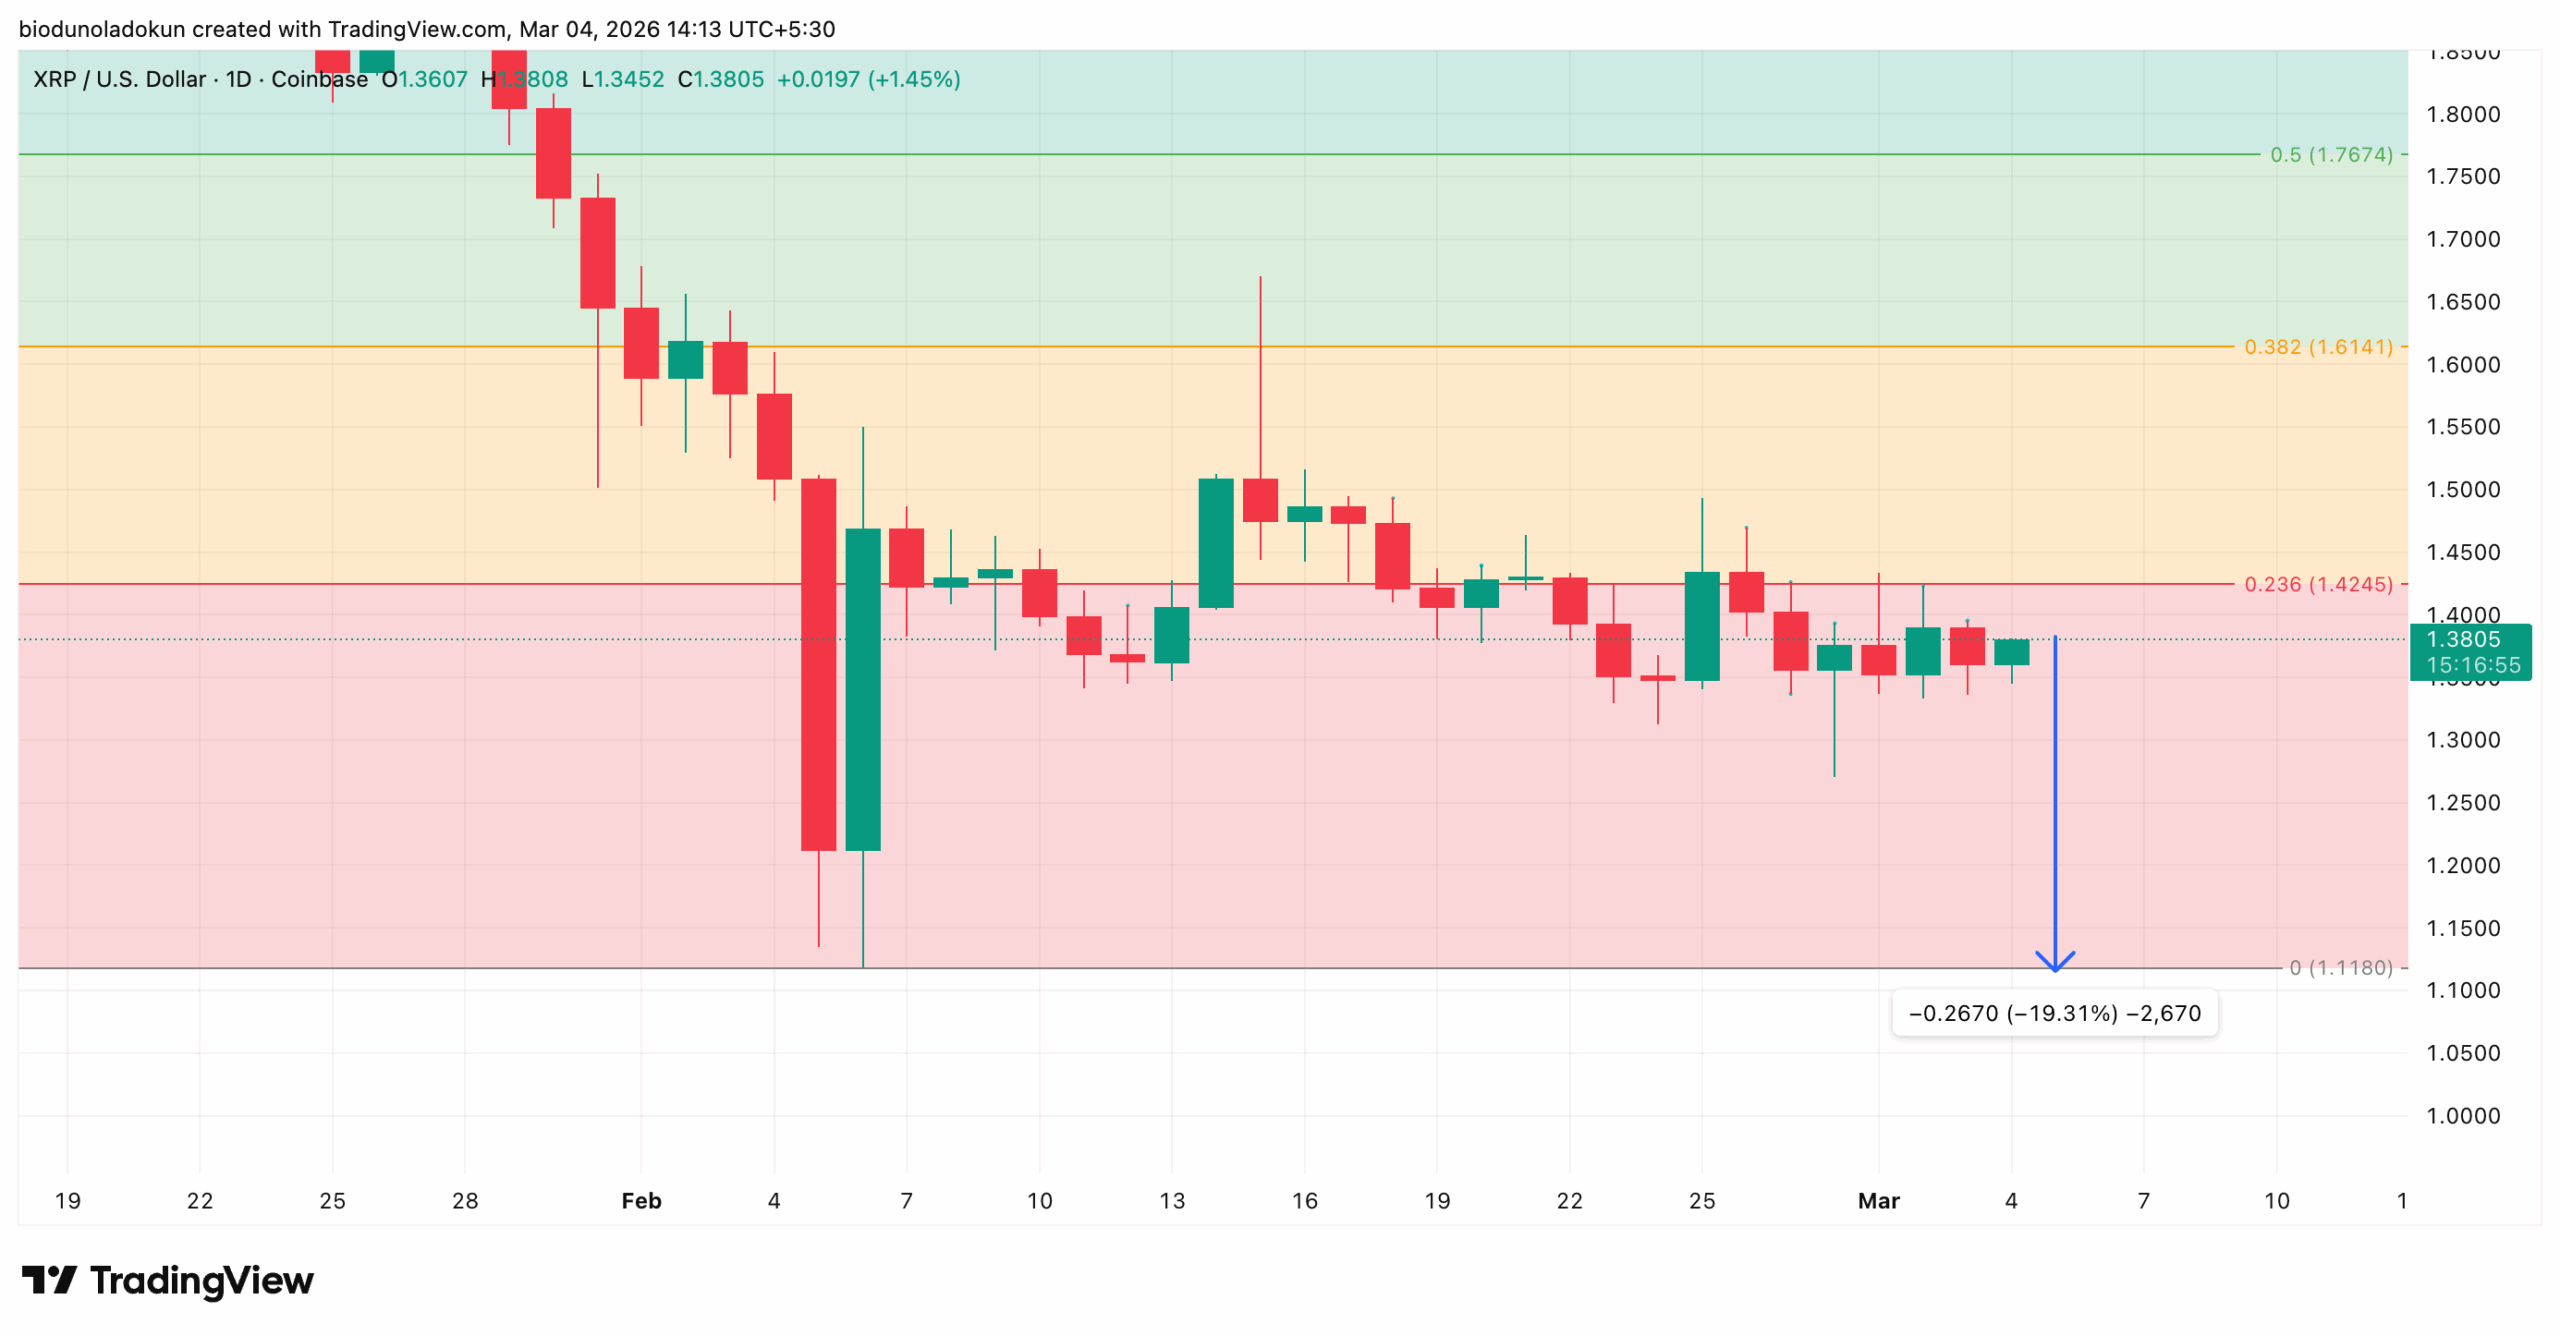
If this trend continues and new demand remains weak, the token could fall toward $1.11, closing the month down nearly 20% from its current price of $1.37.
XRP/USD Daily Chart | Credit: TradingViewHowever, if underlying demand strengthens and the bulls regain dominance, XRP’s price could breach the key resistance at $1.42, climbing to $1.61.
Disclaimer:
The information provided in this article is for informational purposes only. It is not intended to be, nor should it be construed as, financial advice. We do not make any warranties regarding the completeness, reliability, or accuracy of this information. All investments involve risk, and past performance does not guarantee future results. We recommend consulting a financial advisor before making any investment decisions.
Abiodun Oladokun is a Research Analyst at CCN, where he covers cryptocurrency markets with a focus on on-chain analysis, technical assessments, and emerging trends across decentralized finance (DeFi), real-world assets (RWA), artificial intelligence (AI), decentralized physical infrastructure networks (DePIN), Layer 2s, and meme coins.
Prior to CCN, he served as a Senior On-Chain Analyst at BeInCrypto, producing market reports spanning diverse crypto sectors.
Before that, he conducted technical analysis and market assessments of various altcoins at AMBCrypto, where he also contributed long-form quarterly research papers on DeFi, NFTs, DAOs, and scaling architectures, leveraging on-chain platforms including Messari, Santiment, DefiLlama, and Dune Analytics.
He began his crypto career as a research analyst at SixthSense DAO, developing blockchain forensic tools to trace the history of stolen assets.
Abiodun is a lawyer called to the Nigerian Bar and the founder of Ilé Ijó, a Lagos-based electronic dance music collective.