On-chain analysis entails examining blockchain data to understand the behaviour of cryptocurrency networks, such as Bitcoin and Ethereum and to identify market trends.
Web platforms like Glassnode, Bitcoin Magazine Pro, Nansen, and CryptoQuant provide valuable on-chain analysis tools and data.
Key on-chain analysis metrics include exchange reserves, transaction volume, and indicators like the Pi Cycle Top.
On-chain analysis benefits traders by offering trading signals, market timing insights, and risk management strategies.
For crypto traders and long-term investors, knowing when to take profit or buy the dip is rarely straightforward, especially in volatile markets. On-chain analysis offers a more informed approach by examining real-time blockchain data to understand how capital is actually moving across a network.
Unlike traditional methods that rely on price patterns or speculation, on-chain analysis is grounded in transparent, tamper-proof data recorded directly on the blockchain.
On-chain analysis allows traders to logically read real-time sentiment by observing how crypto assets are being moved. During periods of panic or euphoria, this clarity becomes especially valuable for those aiming to protect capital or lock in profits.
This article provides traders and investors with a practical toolkit of on-chain metrics, offering dependable signals in a market often shaped by emotion and noise.
What Is On-Chain Analysis And Why Does It Matter?
On-chain analysis examines blockchain data to uncover valuable insights about a cryptocurrency network’s activity, user behavior, and overall health. By analyzing transaction data, wallet balances, exchange reserves, and many other on-chain metrics, traders and investors can better understand market sentiment, identify trading opportunities, and assess the network’s security.
Different kinds of data can be extracted from the blockchain, making on-chain analysis an important tool when forecasting price movement and market sentiment. Every Bitcoin transfer leaves a trace on this ledger, no matter how small and on-chain analysis is the art of interpreting these movements to gain insights into Bitcoin’s network and its participants.
Unlike technical analysis, which focuses on price patterns, indicators, and support or resistance levels, on-chain analysis offers a transparent, data-driven view of actual blockchain activity. That said, both approaches can complement each other to identify market trends.
How Does On-Chain Analysis Work?
On-chain analysis is the process of converting raw blockchain data into meaningful financial signals. By studying on-chain charts, investors, traders and miners can identify market trends, monitor investor sentiment, and observe how capital flows across a blockchain network.
On-chain data is recorded by nodes, but analysis typically uses processed datasets from blockchain explorers or analytics platforms. These nodes continuously record real-time data, including wallet activity, transaction history, smart contract execution, and network fees.
By processing this stream of blockchain data, these tools reveal behavioral patterns across the network. For example, the MVRV Z-Score compares market value to realized value to identify whether Bitcoin is overvalued or undervalued. Other indicators like exchange inflows/outflows, active address counts, and HODL waves provide signals of market sentiment and asset flow.
Platforms That Provide On-Chain Analysis
To monitor blockchain networks effectively, traders and analysts rely on specialized platforms that convert raw on-chain data into actionable insights.
To effectively monitor on-chain analysis, using the right tools is necessary. Numerous online platforms and software solutions offer reliable access to on-chain data, making it easier to explore blockchain metrics, conduct analysis, and make informed decisions. Some of the most widely used platforms include:
Bitcoin Magazine Pro: Provides live Bitcoin charts and in-depth insights utilizing market cycle and on-chain analysis.
CryptoQuant: An analytics platform providing a wide range of on-chain metrics for Bitcoin, Ethereum, stablecoins, and ERC-20 tokens. CryptoQuant includes market data, exchange reserves, miner data, and short/long-term indicators.
Glassnode Studio: A provider of on-chain data and insights, offering curated dashboards and custom tools for exploring metrics across multiple cryptocurrencies. Its visual tools help users understand blockchain activity and trends.
Nansen: A blockchain analytics platform that combines on-chain data with wallet labels to track smart money movements, DeFi activity, and NFT trends across multiple chains.
Blockchain explorers: Tools like Blockstream.info and Blockchain.com allow users to view individual transactions, track addresses, and inspect blocks in real-time. These explorers provide direct access to raw blockchain data, ideal for detailed transaction analysis.
Key On-Chain Indicators Worth Understanding
Bitcoin: Exchanges Reserve – All Exchanges
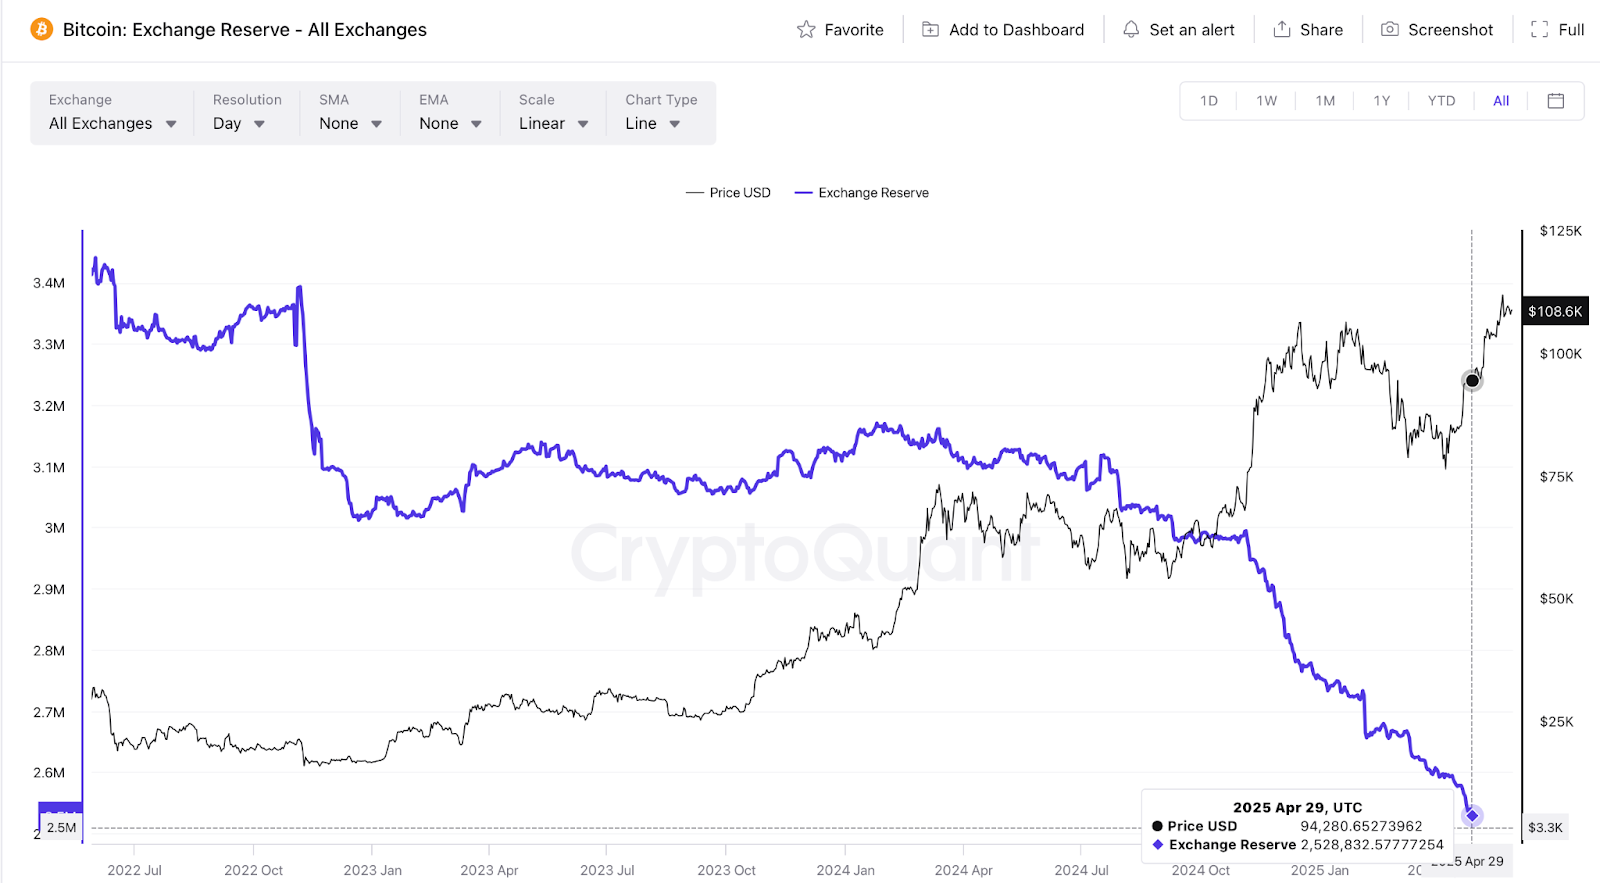
The total amount of Bitcoin reserves held on all exchanges measures the potential coins to sell on the market. This means the exchange reserve is a collective measure of potential coins ready to be sold on exchanges.
Bitcoin: Exchanges Reserve – All Exchanges | Source: CryptoQuant
From mid-2024 to May 2025, Bitcoin exchange reserves declined steadily, as shown in the CryptoQuant chart, signaling ongoing outflows into cold storage and long-term accumulation. By April 29, 2025, reserves dropped below 2.5 million BTC, down from 3.4 million in 2022, meaning significantly less Bitcoin was available for sale.
With fewer coins available for sale, markets become highly responsive to buy-side demand. Even moderate interest can lift prices sharply, as buyers compete for a limited supply. In May 2025, Bitcoin broke past $100,000 while reserves hit a two-year low, highlighting how supply constraints can intensify upward moves during optimistic market conditions.
Ethereum: Exchanges Reserve – All Exchanges
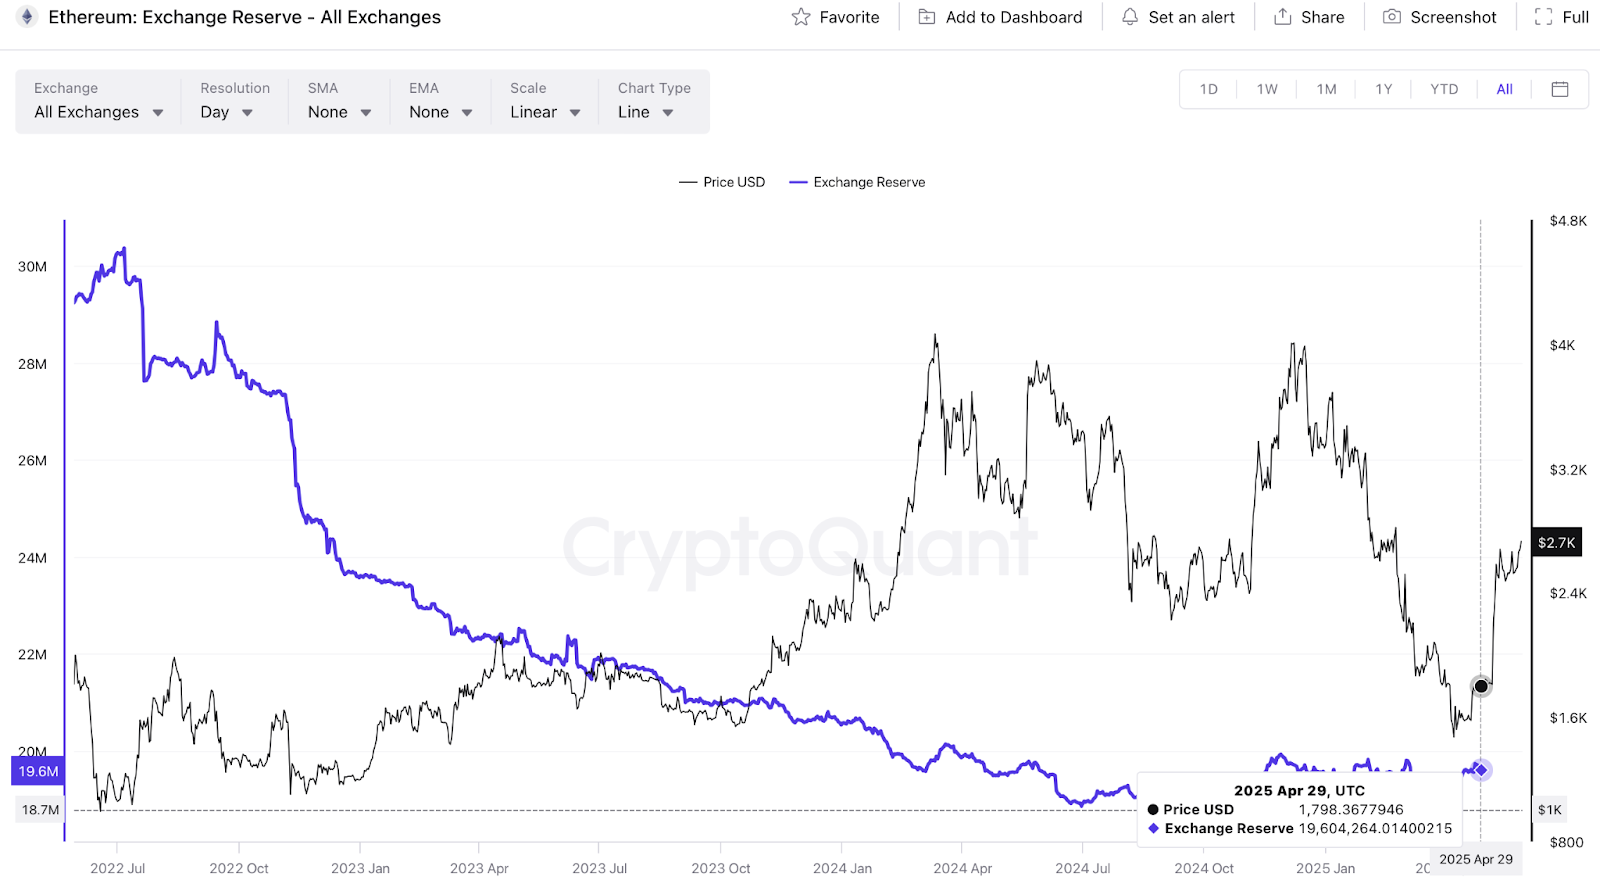
The same principle applies to Ethereum’s exchange reserves for assessing sell pressure. These reserves represent the total amount of Ether available for sale on exchanges, clearly indicating potential selling activity.
Ethereum: Exchanges Reserve – All Exchanges | Source: CryptoQuant
Ethereum’s exchange reserves have flattened since mid-2024, following an earlier drawdown. As of April 2025, balances hovered around 19.6 million ETH, a slight increase, signaling that while ETH isn’t showing Bitcoin-level scarcity, consistent outflows have paused.
This stabilization suggests holders may be waiting for clearer market direction before acting. A flattening of the exchange reserves could also imply preparations for profit-taking on price rallies. If reserves begin rising, it may signal growing sell pressure. However, renewed outflows would point to accumulation and long-term confidence in Ethereum’s value.
Transaction Count (Total) For Both BTC And ETH
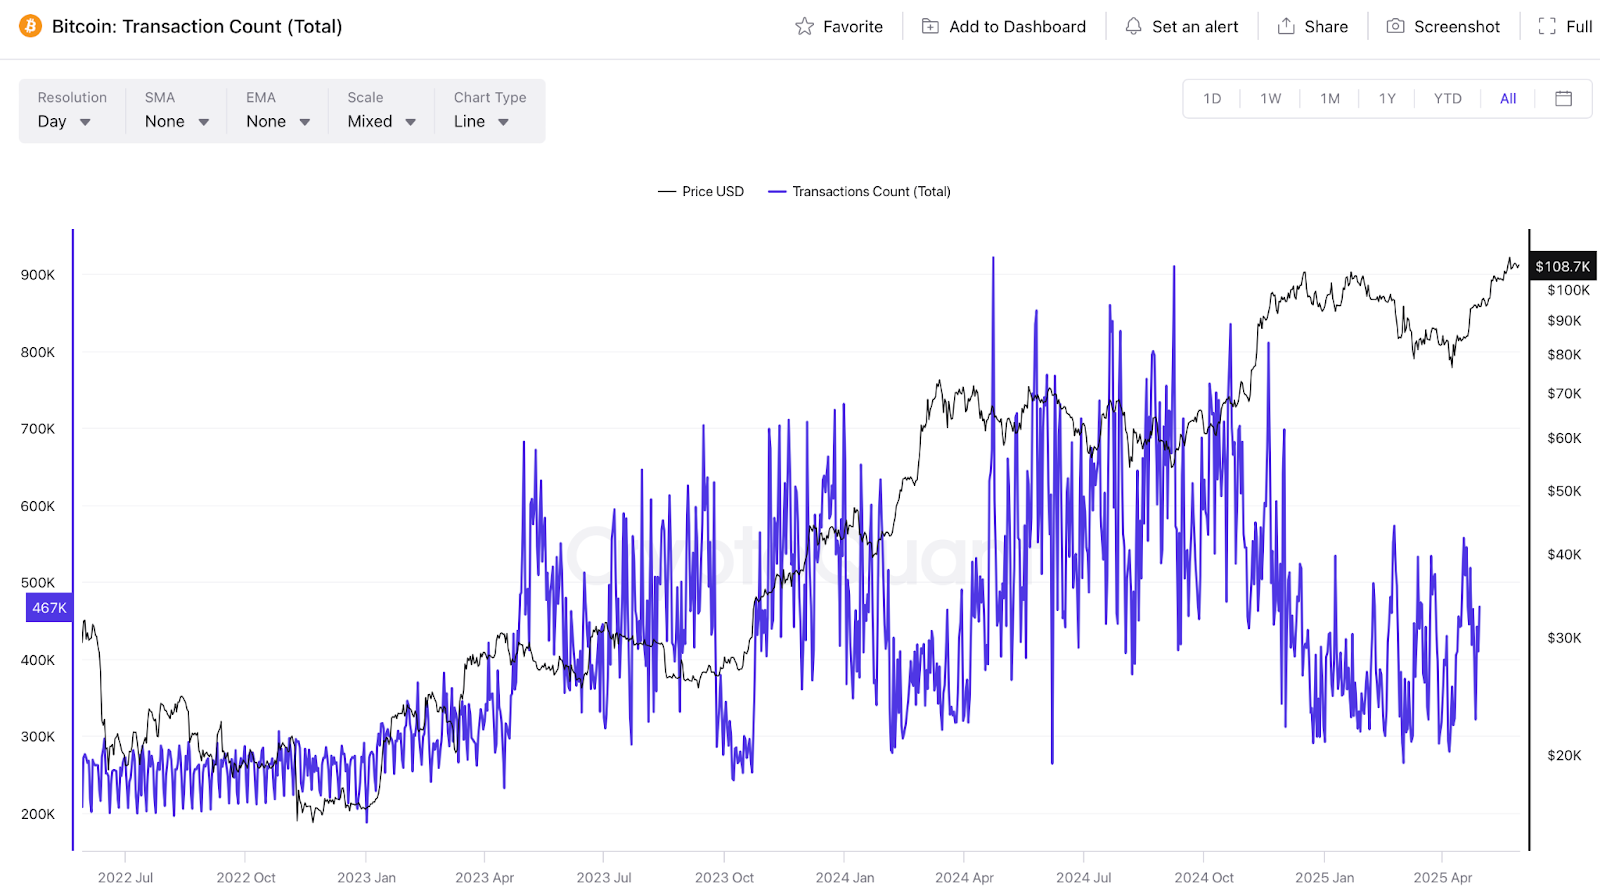
Transaction count measures the total number of confirmed transactions recorded on a blockchain within a given period. In both Bitcoin and Ethereum networks, a sustained rise in transaction count is often interpreted as a proxy for increasing user activity and network demand.
In public blockchains like Bitcoin and Ethereum, an uptick in daily transaction count suggests that the network is processing a higher volume of interactions, whether transfers, smart contract executions, or staking operations.
An increase in transaction counts typically reflects heightened usage and may signal growing adoption, particularly when aligned with rising prices or broader market participation. Conversely, declining transaction activity might indicate market fatigue or lower user engagement, especially during consolidations or bear markets.
Wallet Balances
Analyzing wallet balances can reveal accumulation or distribution patterns among investors. Large wallet movements can be indicative of market sentiment. While not perfect, trends in wallet growth can hint at user adoption, though one user may control multiple addresses.
Other Key On-Chain Metrics To Be Aware Of
Beyond exchange balances and transaction counts, the following metrics help map supply conditions and participant behavior, offering insight into whether the market is leaning toward accumulation, distribution, or incoming volatility.
Realized price bands: Groups coins based on the price at which they were last moved, offering a layered view of investor cost basis. This helps identify support/resistance zones and shows which cohorts are in profit or loss, key for anticipating sell pressure or potential bounce zones.
Miner position index (MPI): Tracks how aggressively miners are sending coins to exchanges. Elevated MPI readings can signal miner-led distribution and potential market tops.
Whale exchange ratio: Assesses the share of large transactions in total exchange inflows. A higher ratio suggests that whales are more active, typically a precursor to large market movements.
Understanding Market Sentiment Through On-Chain Indicators
After examining exchange reserves and transaction data, the next layer of insight comes from on-chain sentiment and valuation metrics. Tools like the Pi Cycle Top, NUPL, and MVRV-Z Score track emotional phases, such as fear, greed, euphoria, and optimism, often aligning with market tops or bottoms.
These indicators bridge behavioral psychology with blockchain data, helping traders and investors time entries and exits more effectively by reducing emotional bias and aligning with broader market sentiment.
PI Cycle Top Indicator
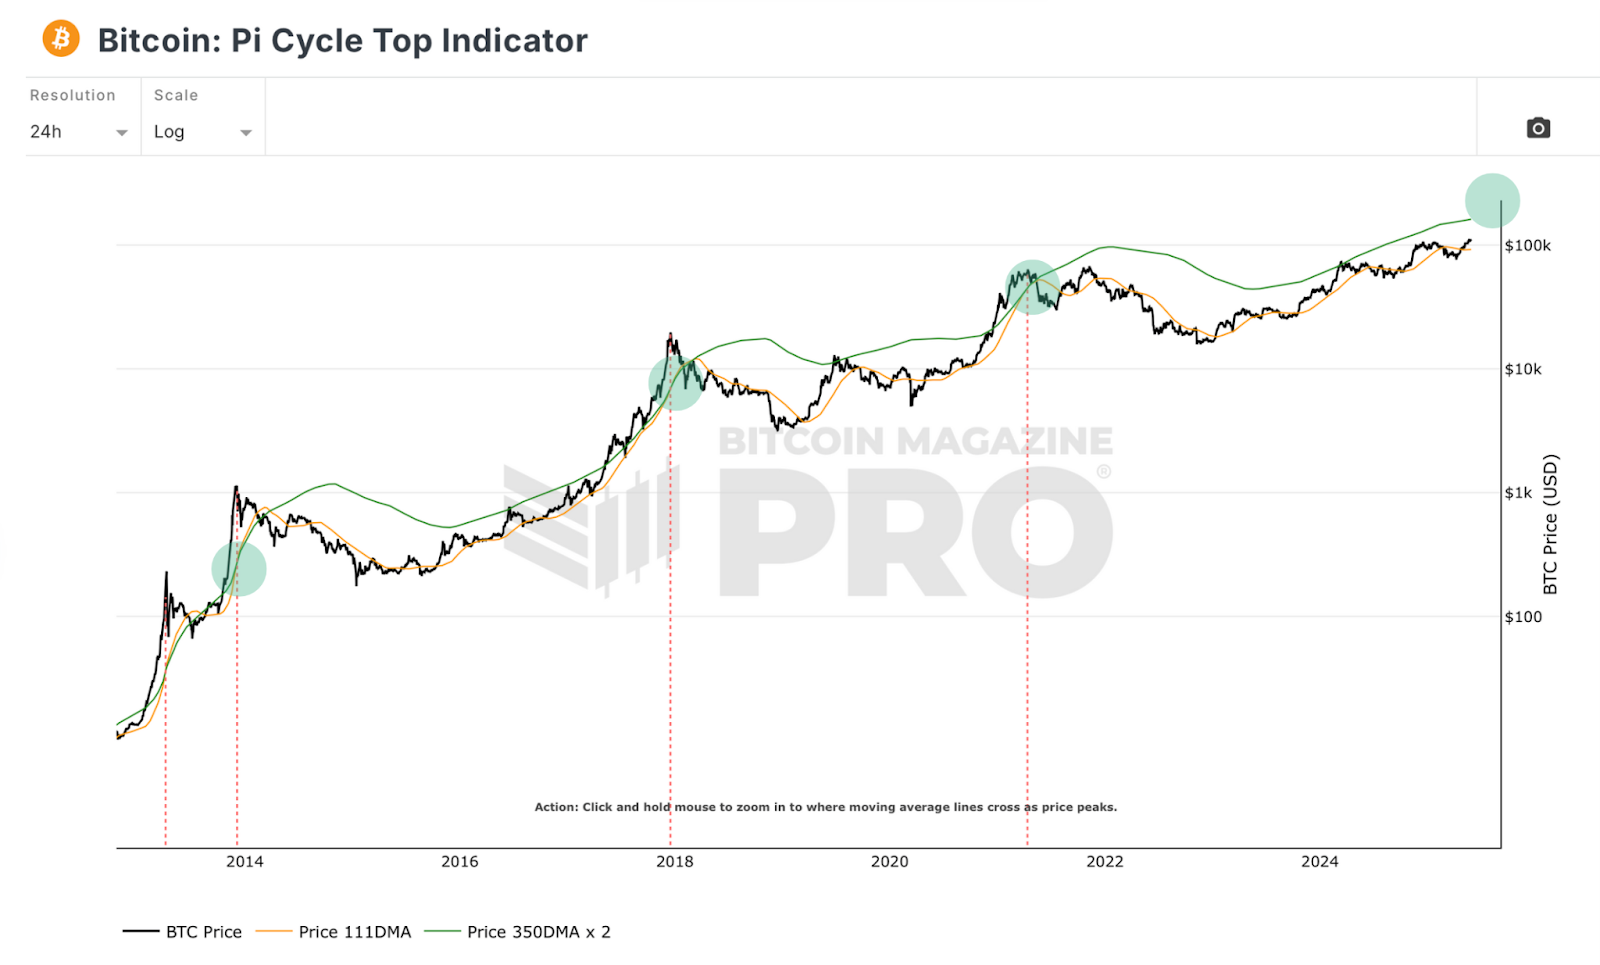
The Pi Cycle Top Indicator is designed to identify Bitcoin’s market cycle peaks by signaling when price may be approaching an all-time high ahead of a downturn.
The Pi Cycle Top Indicator has, in past BTC cycles, been a reasonably consistent tool for forecasting the peaks of Bitcoin’s cycle high and low, aiming to predict when the cryptocurrency’s price is likely to reach an all-time high before undergoing a downturn.
PI Cycle Top Indicator | Source: Bitcoin Magazine Pro
The Pi Cycle Top Indicator relies on the relationship between two specific moving averages:
SMA average: 111-day simple moving average (SMA)
EMA average: 2x the 350-day exponential moving average (EMA)
Historically, when the 111-day SMA crosses above the 2×350-day EMA, it has aligned closely with Bitcoin’s major market cycle tops, often within a few days.
This crossover reflects price acceleration and when the shorter-term average sharply rises and overtakes the long-term average, this in the past, suggested the market is overheating and a top may be near. As of May 30, 2025, the Pi Cycle Top oscillator reads 0.24, historically, values near 1 have aligned with market cycle tops..
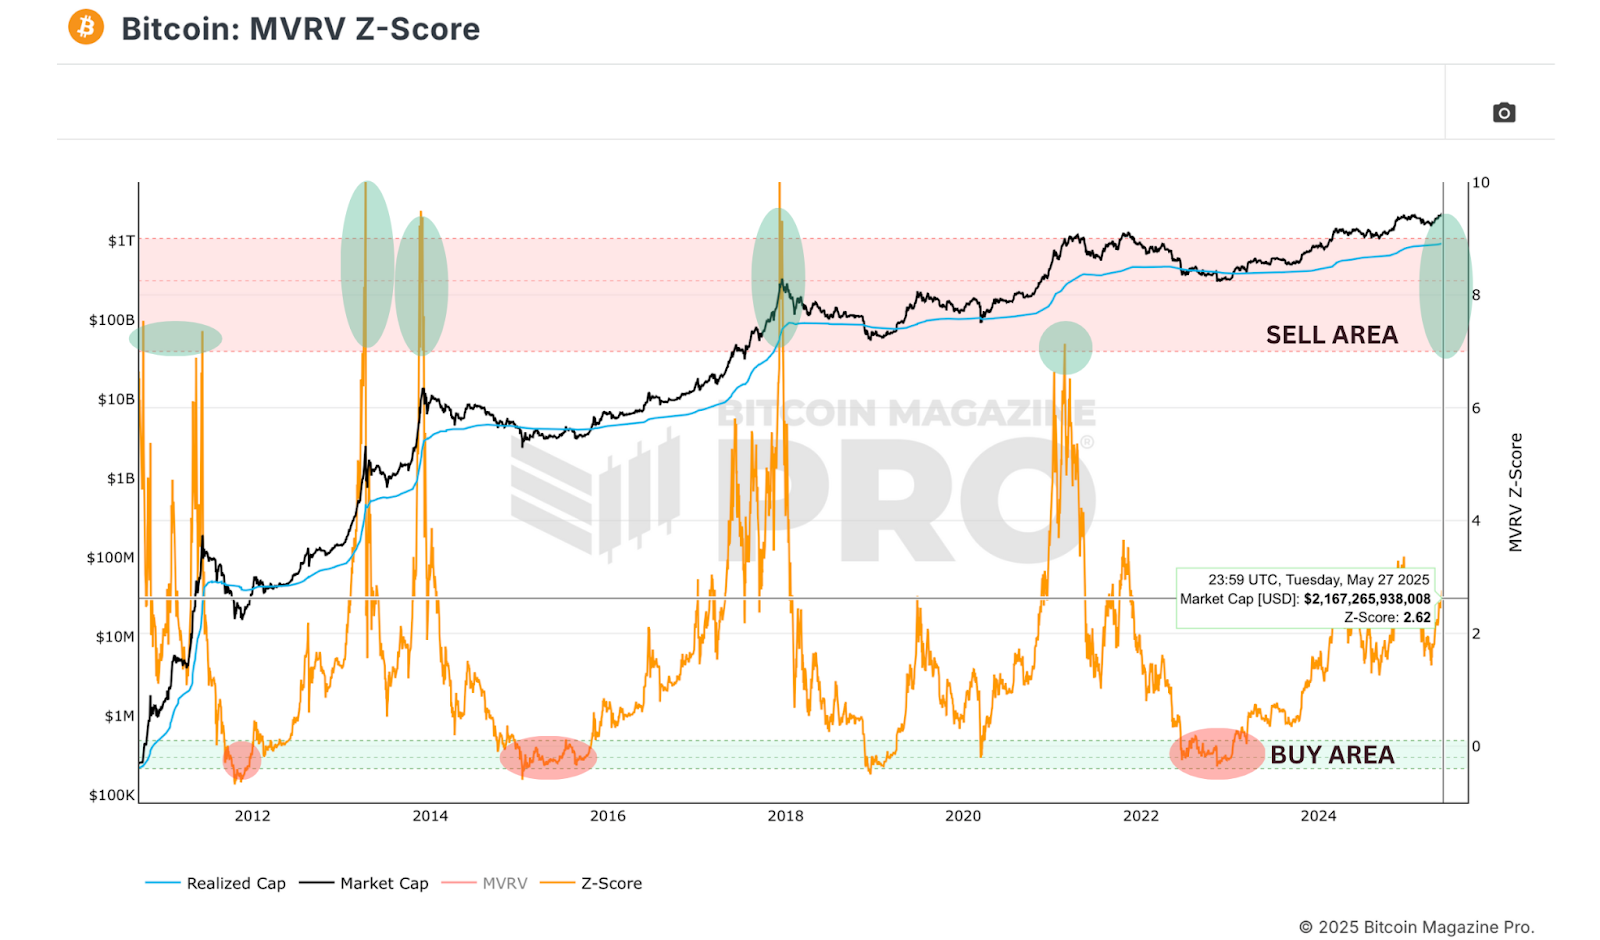
Bitcoin MVRV-Z Score
The MVRV Z-score is one of the most important key on-chain metrics that helps identify periods when Bitcoin is overvalued or undervalued relative to its historical cost basis. It compares Bitcoin’s market value, current price times circulating supply, to its realized value, the average price at which all coins were last moved, then applies a standard deviation (Z-score) to normalize extremes.
Bitcoin MVRV-Z Score | Source: Bitcoin Magazine Pro
When the z-score registers a level between 7 to 9, it signals the peak of market cycles. Conversely, when the z-score registers a point at -0.10 or less, it indicates that the market value is considerably lower than the realized value, which historically leads to substantial returns for those who bought Bitcoin during such periods.
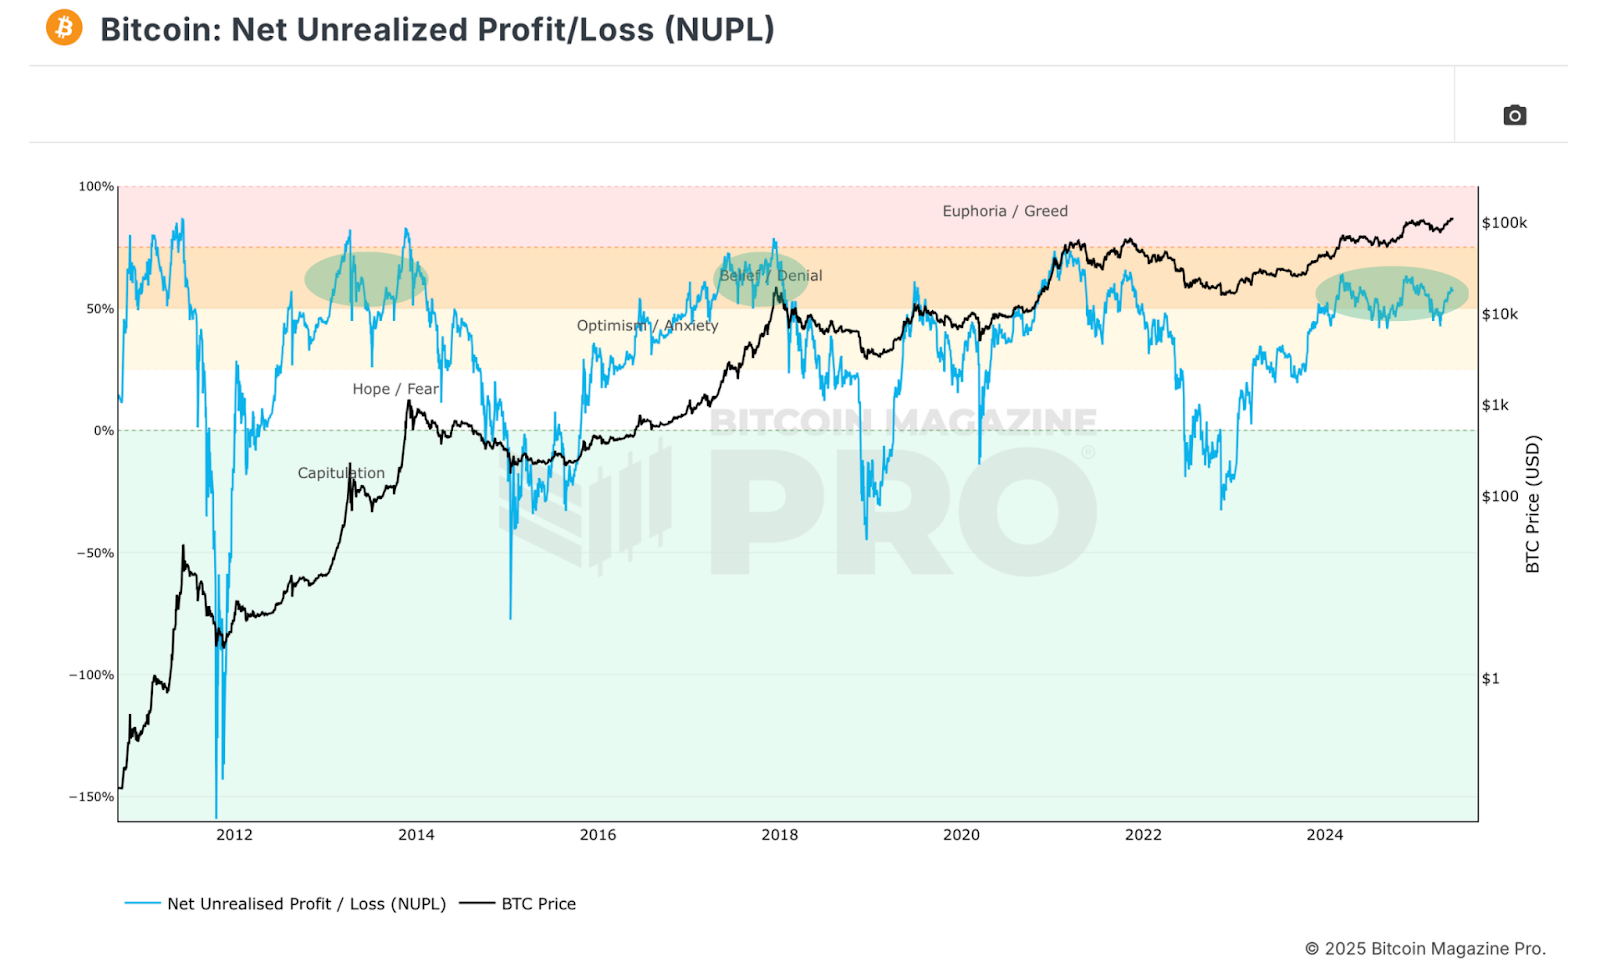
Net Unrealized Profit/Loss (NUPL)
The Net Unrealized Profit/Loss (NUPL) is an on-chain indicator that captures the collective sentiment of the crypto market by comparing the unrealized profits and losses held by investors at a given time. When the majority of coins are held in profit, sentiment shifts toward Greed and Euphoria. When most are held at a loss, the market tends to reflect Fear or Capitulation.
Net Unrealized Profit/Loss (NUPL) | Source: Bitcoin Magazine Pro
The above NUPL metric chart provides valuable insights for forecasting Bitcoin’s future price movements, identifying the level of sentiment at any given time. Historically, the most lucrative times to sell are when the chart enters the Euphoria / Greed mark.
This metric is particularly useful for investors and traders aiming to time exits and entries based on collective market psychology, allowing them to separate personal emotions from broader sentiment trends. Historically, NUPL reaching the Euphoria/Greed zone has often preceded market tops, indicating that prices are near a local or cycle peak.
Not Just Pi Cycle and NUPL: Advanced Indicators That Decode Crypto Sentiment
While the Pi Cycle Top, MVRV-Z Score, and NUPL are among the most widely followed sentiment-driven metrics, several complementary tools offer further nuance when assessing cycle tops, bottoms, and crowd psychology:
Puell Multiple: Compares daily coin issuance in USD (miner revenue) to its historical average. Elevated readings suggest miners are selling into strength, often near market peaks, while low values typically align with cycle bottoms.
RHODL Ratio: Measures the ratio of the 1-week to 1–2-year realized HODL bands, adjusted by market cap. High RHODL values usually mean newer coins dominate, suggesting speculative behavior.
HODL Waves: Tracks the age distribution of held coins. A steep rise in recently moved coins reflects increased market activity and speculative behavior, while long-dormant coins suggest conviction among long-term holders.
Assessing Bitcoin’s Security Through On-Chain Metrics
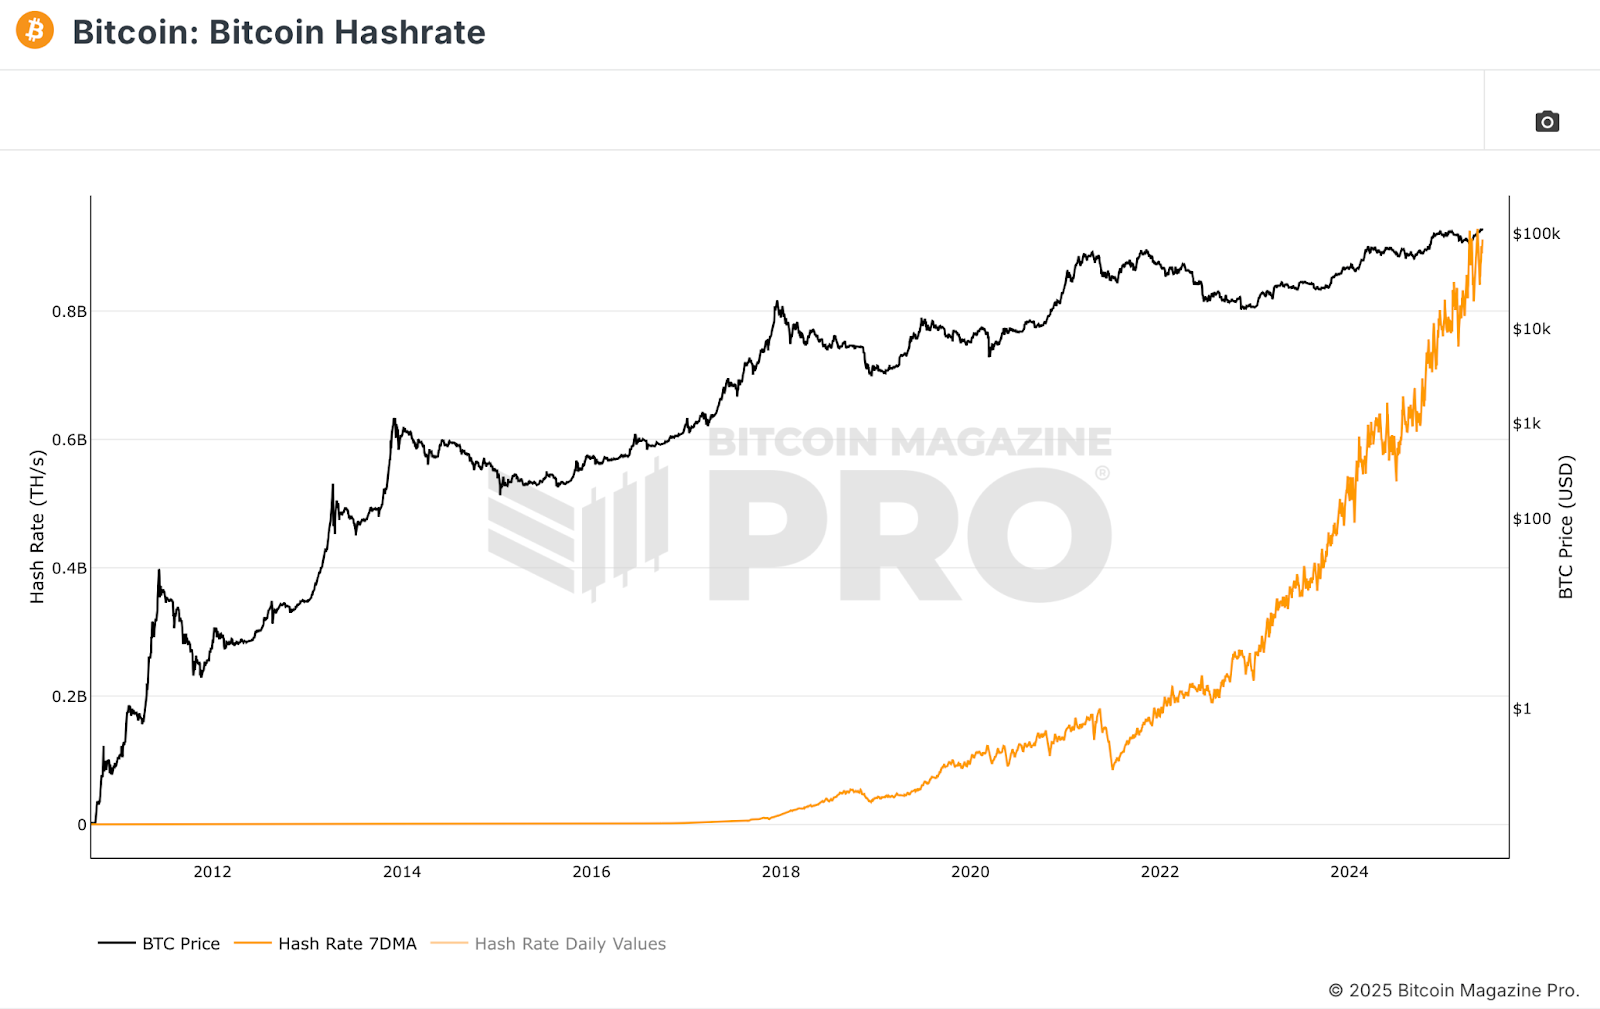
For investors still questioning Bitcoin’s legitimacy or staying power, one of the clearest validations lies not in price charts but in network security and computational power. Bitcoin’s hashrate, the total computational power dedicated to mining and securing the network, has been growing exponentially for years, as indicated in the chart below.
Bitcoin Hashrate | Source: Bitcoin Magazine Pro
This relentless increase in hashrate reflects a competitive arms race among miners. More capital, infrastructure, and energy are being deployed to secure the network. This suggests a straightforward truth, if more resources are being committed to protect Bitcoin, then the network must hold real value.
Hashrate isn’t just a one-off metric, hashrate is a direct signal of Bitcoin’s resilience. A rising hashrate makes the network more resistant to attacks, increases decentralization, and confirms that long-term stakeholders believe in Bitcoin’s continued viability.
On-Chain Metrics That Reflect Bitcoin’s Network Security
When evaluating Bitcoin’s resilience and long-term viability, it helps to look beyond price and consider how secure the network really is. Fortunately, the blockchain itself offers quantifiable, on-chain indicators that track the health and integrity of Bitcoin’s security architecture.
Below are three key metrics, apart from hashrate, that offer insight into the strength of the network over time:
Mining difficulty: Reflects how hard it is to mine a new block. A higher difficulty means more computational power is required to secure the network, making attacks more expensive and less likely.
Difficulty adjustment percent change: Tracks how much the mining difficulty changes every 2,016 blocks. Large upward shifts suggest more miners are joining the network, reinforcing long-term security.
Miner reserves: Tracks the total BTC held in miner wallets, rising reserves suggest holding, while declining reserves may signal upcoming sell pressure.
On-Chain Analysis Strategies: How To Turn Blockchain Signals Into Smart Trades
Here are some strategies to consider when using on-chain analysis to develop trading or investing strategies:
Long-term holding vs. active trading: By analyzing wallet balances and transaction patterns, one can decide whether to use a HODL strategy for the long term or actively trade based on short-term trends.
Timing the market: Studying transaction volume and Pi Cycle ratios can help identify potential market tops and bottoms, aiding in strategic buying and selling.
Tracking institutional activity: On-chain analysis can reveal when big players, like institutions or whales, are moving large sums of Bitcoin. This information can guide decisions by keeping track of the largest wallets using the blockchain explorer.
Why On-Chain Analysis Benefits Traders and Investors
On-chain data helps traders and investors make better-informed decisions by offering direct insights into blockchain activity. Here are the key benefits:
Trading signals: Metrics like transaction volume, wallet balances, and network activity highlight potential buy or sell setups based on historical behavior.
Market timing: Tools such as the MVRV-Z Score and Pi Cycle Top Indicator can identify overbought or oversold conditions, improving entry and exit strategies.
Risk management: Large wallet movements and exchange flows help track market sentiment and volatility, supporting more effective risk controls.
Long-term investment insights: Metrics like active addresses and network growth reflect project adoption, helping long-term investors spot sustainable opportunities.
Spotting accumulation vs. distribution: Identifying these phases supports smarter decisions on whether the market is positioning for growth or decline.
Fundamental confirmation: On-chain data can expose discrepancies between a project’s claims and actual network usage.
Technical analysis validation: On-chain metrics complement chart-based analysis, adding a layer of behavioral confirmation to technical patterns.
Trend confirmation: When price trends align with on-chain indicators, confidence in the prevailing direction increases.
On-Chain Analysis Limitations
On-chain analysis is a valuable tool for gaining insights into a specific blockchain, but it has its limitations. Here are some of the key limitations when using on-chain analysis data:
Incomplete information: On-chain analysis relies solely on the data available on the blockchain. It doesn’t take into account external factors that can influence the market, such as news events, regulatory changes, or macroeconomic trends.
Whale manipulation: Whales can use their influence to create false signals via the data.
Market depth: On-chain analysis typically focuses on historical data, which may not provide insights into future price behavior. Some on-chain analysis might no longer be as accurate as it used to be in the past.
Network upgrades and forks: Onchain analysis may not account for network upgrades or forks that can fundamentally change the blockchain’s behavior.
Small sample sizes: Some on-chain metrics, especially those related to rare events or specific patterns, may have small sample sizes, making it difficult to draw statistically significant conclusions.
Data manipulation: In some cases, bad actors may attempt to manipulate on-chain data by creating fake transactions or artificially inflating metrics. This can distort the analysis and lead to incorrect conclusions.
Conclusion
On-chain analysis is a helpful tool to gain insights into blockchain-based assets, like Bitcoin and Ethereum, by examining various forms of data. It offers advantages such as identifying trading signals and improving timing.
However, it has limitations, including a lack of consideration for external factors and potential data manipulation. To use it effectively, it should complement other analyses and be applied with a holistic market understanding.
A Bitcoin halving is a scheduled event that reduces the mining reward by 50% every 210,000 blocks, or roughly every four years. It slows down Bitcoin’s supply issuance, making the asset more scarce over time and often influencing long-term price trends due to the changing supply-demand dynamics.
Can Ethereum overtake Bitcoin in market cap?
Ethereum could surpass Bitcoin in market cap (a “flippening”) if its network usage, smart contract dominance, and investor demand continue to grow faster. However, Bitcoin still leads as a store of value and reserve asset, so it depends on which use case the market prioritizes.
How long does a Bitcoin transaction take to confirm?
Bitcoin transactions typically take between 10 and 60 minutes to confirm, depending on network congestion and the transaction fee paid. Higher fees generally result in faster confirmations, as miners prioritize transactions that offer better rewards.
What happens if you lose access to your crypto wallet?
If you lose your private keys or seed phrase and don’t have a secure backup, your crypto is effectively lost forever. Unlike banks, there’s no recovery mechanism, highlighting the importance of storing backups offline and in multiple safe locations.
Andrew Kamsky is a chart analyst and writer with a background in economics and ACCA certification. He has held roles at a Big Four firm, a fintech bank, and a listed bank specializing in currency hedging. His work explores Bitcoin, macro trends, and market structure. Outside finance, he's passionate about music, travel, and neon design.


 Easy
Easy