The Optimism Layer-2 scaling solution and its OP token went on an upturn in late 2023. Optimism had seen some good price action before Ethereum (ETH) launched its Dencun upgrade.
This followed a rise in the network’s users after it started hosting the hotly anticipated Worldcoin (WLD) privacy token.
Indeed, Worldcoin helped Optimism gather more traffic, with its daily transactions topping one of its biggest rivals, Arbitrum (ARB), in late July.
Meanwhile, on Oct. 23, Optimism announced it was bringing fault proofs to the Base platform.
However, OP’s price has more than halved since last year, when it was traded at $3.18.
On Jan. 29, 2025, OP was worth about $1.45.
Let’s examine our own Optimism price predictions. We will also examine some of Optimism’s price history and explain what it is and what it does.
Let’s look at the OP price predictions made by CCN on Jan. 29, 2025. We will use the wave count to make our predictions, adding and removing 20% to create the minimum and maximum targets.
Minimum OP Price Prediction
Average OP Price Prediction
Maximum OP Price Prediction
2025
$0.16
$0.20
$0.24
2026
$1.10
$1.35
$1.60
2030
$0.99
$1.22
$1.45
The most likelywave count shows that OP has completed a five-wave increase since its launch. The movement was a leading diagonal because of its overlap and the shape of an expanding wedge. If the count is accurate, OP has started a new A-B-C correction (black) that will take it to new lows.
In this possibility, OP is completing wave B, which can end near the 0.618 Fibonacci retracement resistance level at $3.41. Afterward, the OP price could complete wave C, plunging to new lows.
While the exact bottom for wave C depends on the wave B high, a new all-time low near $0.20 is likely. If the correction has the same length as the upward movement, the OP price will fall to this low in November 2025.
We will use this as the price prediction for the end of 2025.
Then, we will use the rate of decrease since launch to create the OP price predictions for 2026 and 2030.
OP has fallen 10% in the 973 days since its launch. Projecting this decline until the end of 2026 and 2030 leads to OP price predictions of $1.35 and $1.22 for the end of 2026 and 2030, respectively.
Optimism Price Prediction for 2025
The wave count method gives an Optimism price prediction range between $0.16 and $0.24 for the end of 2025.
Optimism Price Prediction for 2026
The combination of the wave count and the daily rate of decrease gives an Optimism price prediction of $1.10 to $1.60 for the end of 2026.
Optimism Price Prediction for 2030
The combination of the wave count and the daily rate of decrease gives an Optimism price prediction of $0.99 to $1.45 for the end of 2030.
Optimism Price Analysis
Optimism has increased alongside an ascending support trend line since its launch in June 2022. The trend line has caused numerous bounces (white icons) this week, the most recent one.
However, the bounces were short-lived and failed to initiate any sustained rally. In fact, the end-of-2024 rally failed to reach the $2.95 horizontal resistance area and stopped at the 0.382 Fibonacci retracement resistance level.
The ensuing decline took the OP price back to theascending support trend line, which has existed for 959 days. A breakdown below it could trigger another 65% decline, taking the price to the all-time low support region of $0.60.
Technical indicators are bearish, supporting the breakdown of new lows. The Relative Strength Index (RSI) just decreased below 50 while the Moving Average Convergence/Divergence (MACD) fell into negative territory and made a bearish cross.
So, the weekly time frame suggests a breakdown, which is the most likely future outlook.
Short-Term OP Price Prediction
The OP price prediction for the next 24 hours is bullish. The price will likely begin a relief rally before eventually falling to new lows.
Optimism Average True Range (ATR): OP Volatility
The Average True Range (ATR) measures market volatility by averaging the largest of three values: the current high minus the current low, the absolute value of the current high minus the previous close, and the absolute value of the current low minus the previous close over a period, typically 14 days.
Since ATR values can be higher for higher-priced assets, normalize ATR by dividing it by the asset price to compare volatility across different price levels. On Jan. 29, 2025, Optimism’s ATR was 0.15, suggesting relatively high volatility.
Optimism Relative Strength Index (RSI): Is OP Overbought or Oversold?
The Relative Strength Index (RSI) is a momentum indicator traders use to determine whether an asset is overbought or oversold.
Movements above 70 and below 30 show over and undervaluation, respectively. Movements above and below the 50 line also indicate if the trend is bullish or bearish.
On Jan. 25, 2025, the Optimism RSI was at 35, indicating bearish conditions.
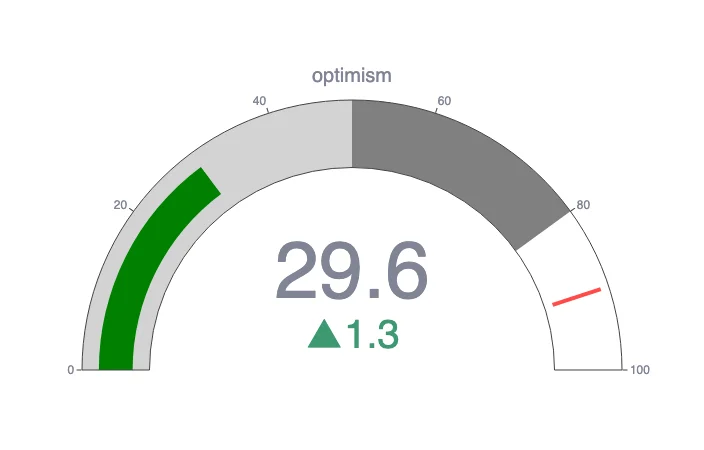
CCN Strength Index
The CCN Strength Index combines an array of advanced market signals to measure the strength of individual cryptocurrencies over the last 30 days.
Every day, it assigns a strength score, ranging from 0 to 100, to the top 500 assets by market capitalization on CoinMarketCap, focusing on both trend direction and the intensity of price movements.
0 to 24: Assets exhibit significant weakness, showing signs of sustained downtrend behavior.
25 to 35: The price tends to move within stable bounds with minimal volatility.
36 to 49: Assets begin a stable uptrend but without strong surges.
50 to 59: Consistent growth with moderate price advances, building momentum.
60+: Sharp price movements and high demand indicate stronger volatility and trend shifts.
The index dynamically adapts to rapid changes. For example, an asset experiencing a 100% increase within a short timeframe would see a sharp jump in its score to reflect the intensity of the rise.
However, should that asset stabilize at this new price level, the score will gradually taper down and align with the dampened momentum as the movement normalizes. The same principle applies to rapid declines: a sudden drop will spike the score downward, but the score will slowly adjust back up as volatility decreases.
On Jan. 29, 2025, Optimism scored 29.6 on the CCN Index, suggesting weak momentum.
OP CCN Index | Credit: CCN
Best Days and Months to Buy Optimism
We looked at the Optimism price history and found the best times to buy OP.
CCN’s Senior Research Analyst, Toghrul Aliyev, took a good look at Optimism. Here are some of the advantages and disadvantages he found out.
Advantages of Optimism
Low Transaction Fees: Optimism offers significantly lower transaction fees than the Ethereum mainnet, with most transactions costing below $0.01.
Credit: L2Fees.info
Adoption of OP Stack: The OP Stack is utilized by various high-profile projects, enhancing its credibility and utility. Examples include Base (Coinbase’s Layer 2 solution), Worldcoin by Sam Altman, and opBNB within the BNB ecosystem.
Respected Investor Backing: Optimism has backing from Andreessen Horowitz and Paradigm, two of the most highly respected venture capital firms in crypto. These firms are known for investing in projects with significant potential.
Credit: CryptoRank
Developer-Friendly Environment: Optimism is highly appealing to developers due to its EVM compatibility and minimal changes required for existing Ethereum dApps. This makes it easy for developers to deploy their applications on Optimism without extensive rework.
Security: Optimism inherits the strong security guarantees of the Ethereum Mainnet. All transactions processed on Optimism are eventually posted to Ethereum, ensuring robust security through Ethereum’s proof-of-stake consensus mechanism.
High Total Value Locked (TVL): Optimism ranks among the top three Layer 2 platforms in Total Value Locked (TVL). Users commit significant value to the platform which, therefore, shows strong confidence in its reliability.
Disadvantages of Optimism
High Competition: Optimism operates in a highly competitive market. Over 40 Layer 2 projects have over $10 million in total value locked (TVL).
Long Withdrawal Times: Withdrawing funds to Ethereum takes longer on Optimism due to its use of optimistic rollups.
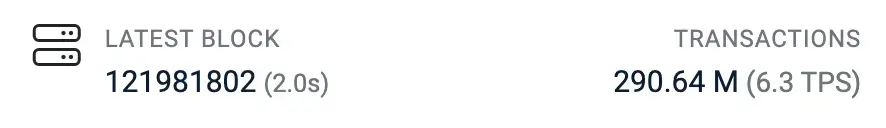
Lower Transaction Throughput: Optimism’s theoretical throughput is 2000 transactions per second (TPS). However, its actual performance has been much lower. Historically, its TPS averages around 6.3, which is not the fastest in the industry.
Credit: etherscan.io
Low User Adoption Rates: Optimism has lower adoption than other Layer 2 platforms. It has around 110,000 daily active users, significantly lower than Ethereum and its competitors like Arbitrum, zkSync Era, and Linea.
Credit: Toghrul Aliyev/Artemis.xyz
Single-Check Fraud Proof: Optimism employs a single-check fraud-proof mechanism, which means transactions are only verified once a dispute arises. This, therefore, relies on the assumption most transactions are valid. If a fraudulent transaction is not challenged in time, it could be finalized, compromising security.
High Inflation Rate: Optimism states an annual inflation rate of 2%. However, using data from CoinMarketCap and looking back with the Wayback Machine, the actual inflation rate was 74.04% over one year.
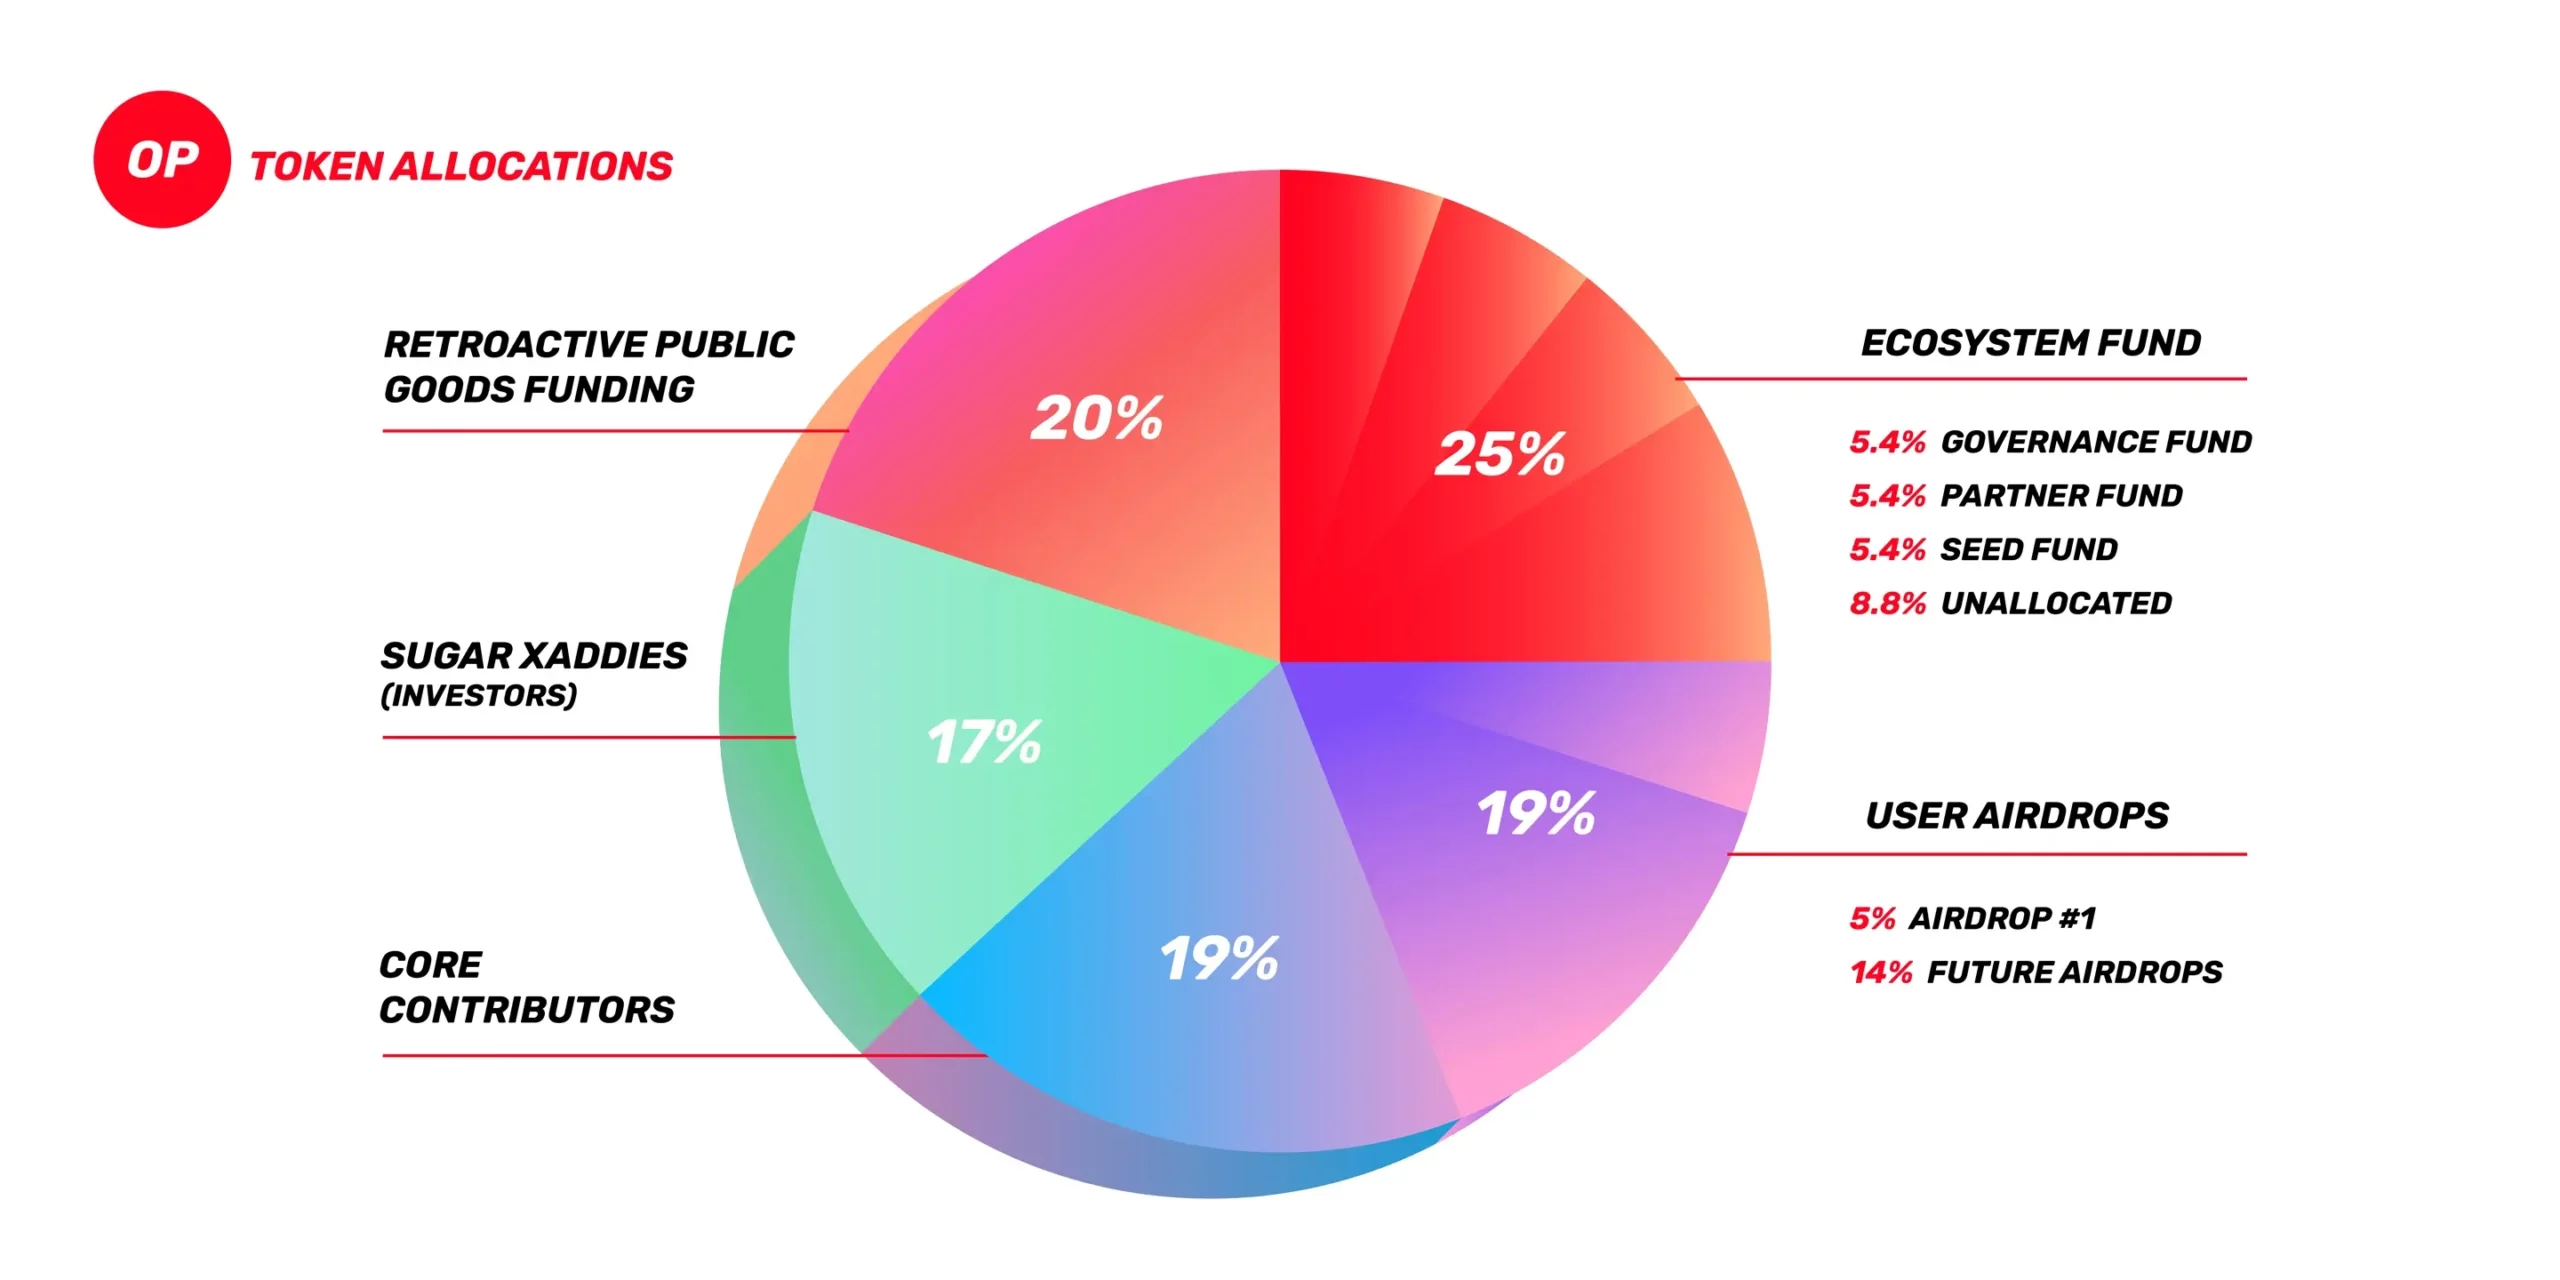
Low Circulating Supply: As of June 2024, only 26.12% of the total OP token supply is circulating. This is problematic because when the remaining tokens are released, even if done gradually, it will likely cause a significant price drop in the token’s price. Token distribution does not favor holders, with large allocations reserved for various purposes: 25% for the Ecosystem Fund, 20% for Retroactive Public Goods Funding, 19% for airdrops, 19% for core contributors, and 17% for investors.
Credit: optimism.io
Dependency on Ethereum: Optimism’s success is heavily tied to Ethereum. It would likely be adversely affected if Ethereum faced significant issues or a decline in popularity.
Optimism Price History
Let’s examine some key dates in the Optimism price history. While past performance should never be taken as an indicator of future results, knowing what the coin has done can give us some very useful context when making or interpreting an Optimism price prediction.
Optimism price history for the last 12 months | Credit: CoinMarketCap
Time period
Optimism price
Last week (Jan. 22 2025)
$1.76
Last month (Dec. 29, 2024)
$1.89
Three months ago (Oct. 29, 2024)
$1.72
One year ago (Jan. 29, 2024)
$3.18
Launch price (June 1, 2022)
$1.44
All-time high (March 6, 2024)
$4.85
All-time low (June 18, 2022)
$0.4005
Optimism Market Cap
The Optimism market capitalization, or market cap, is the sum of the total number of OP in circulation multiplied by its price.
Optimism market cap for the last 12 months | Credit: CoinMarketCap
On Jan. 29, 2025, Optimism’s market cap was $1.97 billion, making it the 53rd-largest crypto by that metric.
Who Owns the Most Optimism (OP) Tokens?
On Jan. 29, 2025, one wallet held more than 30% of OP’s supply.
0x2a82ae142b2e62cb7d10b55e323acb1cab663a26. This wallet held 1,294,044,371 OP, or 30.13% of the supply.
0x2501c477d0a35545a387aa4a3eee4292a9a8b3f0. This wallet, listed as Optimism: Foundation, held 788,734,944 OP, or 18.36% of the supply.
0x790b4086d106eafd913e71843aed987efe291c92. This wallet held 213,320,032 OP, or 4.97% of the supply.
0x6ba2c3b591ac4be15cda66b305db4f03e7ff7c9f. This wallet held 174,161,584 OP, or 4.05% of the supply.
0xacf32f4e1260636cf1e3066c060c74ad52fe4e9e. This wallet held 102,797,156 OP, or 2.39% of the supply.
Optimism Supply and Distribution
Supply and distribution
Figures
Maximum Supply
4,294,967,296
Circulating supply (as of Jan. 29, 2025)
1,351,719,035 (31.47% of maximum supply)
Holder distribution
Top 10 holders owned 66.58% of supply as of Jan. 29, 2025
From the Optimism Whitepaper
In its technical documentation or whitepaper, Optimism describes it as an optimistic roll-up.
It says: “Optimism is an “Optimistic Rollup,” which is basically just a fancy way of describing a blockchain that piggy-backs off of the security of another “parent” blockchain. Specifically, Optimistic Rollups take advantage of the consensus mechanism (like Proof-of-Work or Proof-of-Stake) of their parent chain instead of providing their own. In OP Mainnet’s case this parent blockchain is Ethereum.”
What Is Optimism?
Although the Ethereum blockchain is the second largest crypto platform, behind only Bitcoin (BTC), it has not been without its problems. In the past, Ethereum was notorious for slowing down when the network was busy. This costs people time and, perhaps more importantly, money.
To solve this problem, a range of Layer-2 scaling solutions, programs that take a transaction off the main blockchain, carry it out elsewhere, and put it back on the system, were founded.
The OP token, which came onto the open market in 2022, supports the platform.
How Optimism Works
Optimism uses optimistic roll-ups to verify transactions. This means that transactions are treated as valid, and all verifications take place on the blockchain.
The OP token is used to pay for transactions on the platform. Holders can also vote on changes to the Optimism protocol. People can also buy, sell, and trade it on crypto exchanges.
Since Optimism is based on Ethereum, it is a token, not a coin. You might see references to such things as an Optimism coin price prediction, but these are wrong.
Is Optimism a Good Investment?
It is hard to say. On the one hand, OP had a strong late 2023. The news that the platform has, at various points over the last year, enjoyed more daily transactions and cheaper fees than Arbitrum will also encourage investors.
On the other hand, we don’t know whether Optimism will be able to build on recent growth. There is also the elephant in the room. Ethereum has run on a Proof-of-Stake (PoS) consensus mechanism since September 2022, so we have to wonder whether the era of Layer-2 scaling solutions is ending.
As always with crypto, you should do your own research before deciding whether or not to invest in OP.
Will Optimism go up or down?
No one can really tell right now. While the Optimism crypto price predictions are largely positive, price predictions have a well-earned reputation for being wrong. Keep in mind that prices can and do go down and up.
Should I invest in Optimism?
Before you decide whether or not to invest in Optimism, you will have to do your own research, not only on OP but on other related coins and tokens such as Arbitrum or Mantle (MNT). Either way, you must also ensure you never invest more money than you can afford to lose.
Technical analysis by Valdrin Tahiri.
FAQs
How many Optimism are there?
On Jan. 29, 2025, there were 1.35 billion Optimism in circulation out of a maximum supply of 4.29 billion.
Will Optimism reach $10?
Technical analysis by our experts suggests that OP will not break $10 until at least the 2030s, if ever.
Keep in mind that Optimism has never traded at $10 before, with its highest price of $4.85 coming in March 2024.
What is Optimism used for?
OP token holders can vote on changes to the Optimism crypto platform. People can also buy, sell and trade OP on exchanges.
Disclaimer:
The information provided in this article is for informational purposes only. It is not intended to be, nor should it be construed as, financial advice. We do not make any warranties regarding the completeness, reliability, or accuracy of this information. All investments involve risk, and past performance does not guarantee future results. We recommend consulting a financial advisor before making any investment decisions.
Peter Henn has been a journalist since 2005. In that time, he has written for a variety of publishers including the Mail on Sunday and the Daily Express. He has previously covered the world of cryptocurrency for Currency.com and Capital.com, and has also written for ECigIntelligence.com and CBD-Intel.com. A graduate of the University of Liverpool, he is based in the United Kingdom. His hobbies include music, horse racing and performance art.