Ethereum (ETH) is the second-biggest cryptocurrency in the world.
Ethereum fell below $3,000 today and is 40% below its all-time high.
Will Ethereum continue to trend downward the rest of 2026?
Ethereum launched the Pectra upgrade on May 7, its most significant upgrade since Dencun. This upgrade had the unintended consequence of making the ETH supply inflationary.
Pectra remedied this by doubling the number of Blobs, which has already had a deflationary effect on the ETH supply.
Ethereum’s price began an upward movement afterward and hit a new all-time high in August.
However, it has fallen significantly since, briefly crashing below $2,700.
Let’s examine our price predictions for ETH, made on Dec.16, 2025. We will also investigate the history of ETH prices and explain what ETH is and what it does.
Ethereum Price Prediction
Here are the Ethereum price predictions from CCN on Dec.16, 2025. The projections are made using the wave count method, while the minimum and maximum targets depend on the price movement during each specific year.
Minimum Ethereum Price Prediction
Average Ethereum Price Prediction
Maximum Ethereum Price Prediction
2026
$800
$1,200
$2,500
2027
$1,000
$2,000
$3,000
2030
$5,000
$12,000
$15,000
The most likely wave count suggests that Ethereum has completed a five-wave upward movement since 2016 and corrected inside an A-B-C structure (red) since its all-time high in 2021.
If the count is accurate, Ethereum has completed wave B and is now in a corrective wave C, which will likely take it to new lows.
Get These Top Crypto Casino Offers Now!
Sponsored
Disclosure
We sometimes use affiliate links in our content, when clicking on those we might receive a commission at no extra cost to you. By using this website you agree to our terms and conditions and privacy policy.
After creating a long upper wick, it appears that Ethereum’s price will likely continue to decline this week.
The closest support area is at $2,500, nearly 20% below the current Ethereum price.
Short-Term ETH Price Prediction
The Ethereum price prediction for the next 24 hours is bearish. ETH is likely to continue falling to new lows.
Ethereum Average True Range (ATR): ETH Volatility
The Average True Range (ATR) measures market volatility by averaging the largest of three values: the current high minus the current low, the absolute value of the current high minus the previous close, and the absolute value of the current low minus the previous close, over a period of typically 14 days.
A rising ATR indicates increasing volatility, while a falling ATR indicates decreasing volatility.
ETH ATR Weekly Chart | Credit: Valdrin Tahiri/TradingView
On December 16, 2025, ETH’s ATR was 531, indicating average volatility.
ETH Relative Strength Index (RSI): Is ETH Overbought or Oversold?
The Relative Strength Index (RSI) is a momentum indicator that traders use to determine whether an asset is overbought or oversold. Movements above 70 and below 30 show over- and undervaluation, respectively.
Movements above and below the 50 line indicate whether the trend is bullish or bearish.
On December 16, 2025, Ethereum’s RSI was 62, suggesting a neutral trend that was gradually turning bullish.
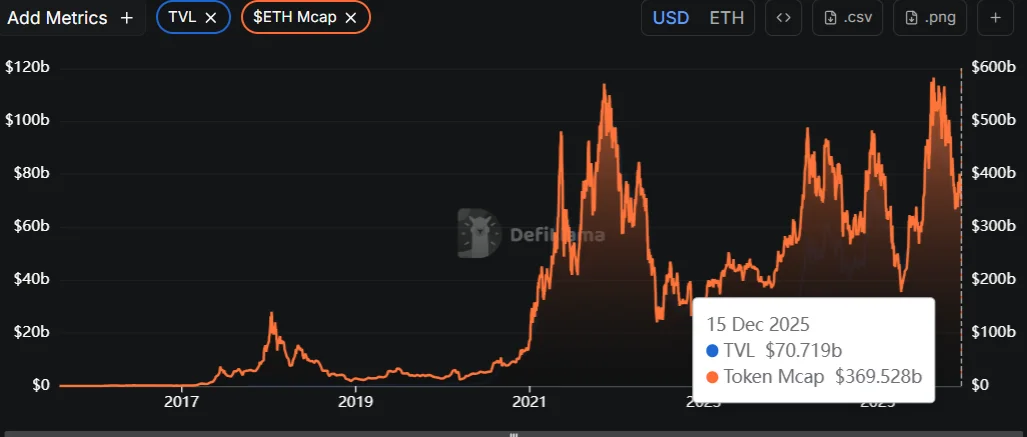
ETH Market Cap to TVL Ratio
The Market Cap to Total Value Locked (TVL) ratio measures the valuation of a decentralized finance project by comparing its market capitalization to the total value of assets locked in its smart contracts. This ratio indicates the project’s utilization and correlates the platform’s health with the locked asset value.
A ratio above 1.0 indicates overvaluation because the market cap exceeds the value of assets used in the platform. A ratio below 1.0 indicates undervaluation, as the market capitalization is lower than the value of locked assets.
On Dec.16, 2025, the Ethereum TVL ratio was 5.3, indicating a slight overvaluation.
Best Days and Months to Buy
We examined the ETH price history and identified periods when the price was at its lowest, spanning specific days, months, quarters, and even weeks of the year, indicating the optimal times to buy Ethereum.
Time to Buy ETH
Days, Weeks, Months, and Quarters
Best Day
Wednesday
Best Week
33
Best Month
January
Best Quarter
First
ETH Price Performance Comparison
Ethereum is a blockchain that facilitates smart contracts, so let’s compare its performance with that of similar projects.
CCN’s Senior Research Analyst, Toghrul Aliyev, thoroughly studied Ethereum and identified its advantages and disadvantages.
Advantages of Ethereum
Development
Ethereum ranks number one across multiple key development metrics: 112,535 repositories, 1,540 sub-ecosystems, 43,475 weekly commits, and 2,913 active developers. These numbers demonstrate Ethereum’s extensive range of applications and projects. Active development results in fewer bugs, faster issue resolution, and the ability to swiftly meet user demands and stay ahead of the competition.
Centralization and Decentralization
The 2016 DAO hack led to the theft of 3.6 million ETH. In response, Ethereum implemented a hard fork to restore the stolen funds. Critics argue this decision contradicts Ethereum’s decentralized ethos. However, the hard fork demonstrated true decentralization only after achieving majority consensus through extensive community discussions and voting. With 14% of the total supply at risk and the ecosystem’s future in jeopardy, the move was not a bailout.
In contrast, no hard fork was implemented when the Parity multi-signature wallet was exploited in 2017. Other critics compare The DAO hack to the Mt. Gox collapse, but this comparison misses key differences. When MtGox’s losses were revealed, the funds had already been widely dispersed, making a simple revert impossible. In the case of The DAO, the funds were locked for several weeks after the transfer, allowing for a different response.
Market Position
The approval of ETH ETFs makes Ethereum accessible to institutional investors like pension funds, mutual funds, and insurance companies. As a result, Ethereum is now part of traditional finance, which enhances its liquidity and price stability.
Ethereum ranks 1st in DEX trading volume, holding a 33.4% market share in the first quarter of 2024, with $144.2 billion in trades.
Ethereum leads in real-world asset tokenization. It has an almost 72% market share in tokenized US Treasuries. Ethereum also holds more than 98% of the commodities and more than 53% of the stablecoin supply on its network.
US Treasuries
Stablecoins
Commodities
Ethereum
$1384.49M
$88604.92M
$864.89M
Stellar
$433.27M
$226.43M
$9.83M
Solana
$47.96M
$3199.73M
–
Mantle
$39.72M
–
–
Polygon
$10.32M
$361.26M
–
Arbitrum
$5.22M
$1309.82M
–
Gnosis
$2.23M
–
–
TRON
–
$61680.08M
–
BNB Smart Chain
–
$4994.37M
–
Base
–
$2,972.77
–
Avalanche
–
$2185.47M
–
NEAR
–
$714.01M
–
Positive: Ethereum dominates the DeFi sector by total value locked, holding more than 56% of the market share.
Total Value Locked – All Chains. Source: DefiLlama
Supply and Scalability
Positive: Users can stake Ethereum to earn rewards by participating in the network’s validation process.
Positive: Ethereum’s burning mechanism, introduced through the EIP-1559 upgrade, reduces the total supply of ETH over time. Each transaction on the Ethereum network includes a base fee, which gets burned, permanently removing that ETH from circulation. If the rate of ETH being burned exceeds the rate at which new ETH is created, the total supply of ETH decreases, resulting in increased scarcity and potentially higher value per token.
Disadvantages of Ethereum
Development
When problems arise in the Ethereum network, solutions often involve outsourcing tasks to external organizations. This practice can compromise the protocol’s integrity because it relies on outside parties rather than the community or core developers. It creates a situation where external companies have significant influence over the network, leading to conflicts of interest and reducing the system’s trustworthiness.
Layer 2 solutions offer faster and cheaper transactions, causing users and developers to focus on them rather than the Ethereum network. As a result, developers prioritize creating and enhancing Layer 2 or Layer 3 solutions, shifting their innovation and development efforts away from Ethereum itself.
Ethereum developers focus on long-term solutions that take years to implement, mainly concentrating on Layer 2s and Layer 3s. Meanwhile, competitors are addressing Ethereum’s issues more quickly, thus attracting more users, developers, and investment. The dynamic leads to a loss of market share for Ethereum, as other platforms offer immediate improvements and capture a larger share of the market.
Centralization and Decentralization
Liquid staking enables users to stake Ether and receive tokens representing their staked assets, which can be traded or utilized in other DeFi applications. However, it poses a risk to the protocol’s health. If too much Ether concentrates in liquid staking services, a few entities could gain significant control over the network. This is already a reality because Lido and Coinbase control over 40% of the market share in Ethereum’s staking. For proof-of-stake platforms, control by more than 33% of the stake is problematic because it increases the risk of collusion and potential network compromise.
Credit: Dune Analytics/Hildobby
As the hardware requirements for running a node on the Ethereum network increase, only entities with large data centers can afford to keep up. Smaller, individual node operators may find it too expensive to continue participating. This trend leads to a more centralized network, where a few large players dominate, reducing the network’s resilience and decentralization. As of July 2024, five ISPs—Amazon, Hetzner Online, OVH SAS, Comcast Cable, and Spectrum—are responsible for 1/3 of the network’s nodes out of 893 providers. The situation has improved since August 2022, when three ISPs hosted 2/3 of the nodes. However, this improvement still does not fully resolve the centralization issue.
MEV refers to the profit miners can make by reordering, including or excluding transactions within the blocks they produce. Instead of finding ways to solve this problem, Ethereum has started accommodating it by supporting proprietary MEV builders. The focus on MEV builders gives them precedence over local, smaller block producers, which can lead to a more centralized and unfair system.
Staking requires a minimum of 32 ETH, equivalent to $112,000 at an Ethereum price of $3,500, making it inaccessible for the average retail investor. The barrier reduces the level of decentralization, as fewer individuals can participate in securing the network.
Ethereum’s decision-making relies heavily on a small group of developers, which centralizes control and slows the decision-making process. The absence of on-chain governance means fewer community voices influence major updates, leading to less flexible responses to challenges. A centralized structure hampers Ethereum’s ability to adapt quickly and increases the risk of users and developers moving to more responsive platforms.
Market Position
Negative: Year-to-date inflows and outflows of Ethereum have resulted in a net outflow of $0.85 billion. More money leaving the chain than coming in indicates that investors and users prefer other chains over Ethereum, which could lead to decreased network activity and hinder its growth and development.
Inflows and outflows: Credit: Artemis.xyz
Supply and Scalability
Ethereum’s low throughput of 13 Transactions Per Second (TPS) causes network congestion when transaction volume spikes. As a result, users face high fees, sometimes even exceeding $100 per transaction.
Ethereum relies on Layer 2 solutions, such as Arbitrum and Optimism, to handle a higher volume of transactions. These help reduce congestion and fees, but make Ethereum less viable as a standalone option. The significant market share of these Layer 2 platforms indicates a preference for alternatives. Although these solutions operate within the Ethereum ecosystem, relying on external chains instead of in-house solutions is not ideal.
Due to congestion and inefficiency, Ethereum’s inability to scale results in a poor user experience. Additionally, fragmentation across Layer-2 solutions complicates dApp interoperability. It also complicates the integration of new projects with existing ones, while reduced composability hampers innovation and growth within the ecosystem.
Ethereum’s focus on being a secure data availability layer for Layer 2 solutions highlights its scalability limitations. The mainnet remains less scalable, affecting the efficiency of the DA Layer. Meanwhile, scalable blockchains can process more transactions, capture higher revenue, and enhance security. This puts Ethereum at a competitive disadvantage as it struggles to match the performance and efficiency of more scalable blockchains.
Successful Layer 2 solutions may abandon Ethereum for more scalable Layer 1 blockchains. If Ethereum doesn’t provide sufficient revenue for these protocols to thrive, they will likely migrate to other platforms that offer better scalability and profitability, further weakening Ethereum’s ecosystem.
Due to scalability issues, congestion, and high fees, Ethereum’s DEX trading volume market share has been eroded by other chains, primarily its Layer 2 solution, Arbitrum, and its biggest competitor, Solana. In October 2023, Ethereum’s DEX trading volume market share was 56.49%, but by March 2024, it had dropped to 33.4%.
Recently, interest in Ethereum has declined, resulting in inflation exceeding the amount of ETH burned. Since April 2024, the net increase in ETH supply has been approximately 60,000 ETH per month. If this trend continues, by Dec. 2024, the total supply of ETH could return to the levels seen at the time of the Merger.
Ethereum Price History
Now, look at some key dates in the ETH price history. While past performance is not an indicator of future results, understanding the token’s past performance can help provide context when making or interpreting an Ethereum price prediction.
0x00000000219ab540356cbb839cbe05303d7705fa. This wallet held 62,054,109 ETH, or 51.40% of the supply.
0xc02aaa39b223fe8d0a0e5c4f27ead9083c756cc2. This wallet held 2,694,435 ETH, or 2.23% of the supply.
0xbe0eb53f46cd790cd13851d5eff43d12404d33e8. This wallet, listed as Binance, held 1,996,008 ETH, or 1.65% of the supply.
0x40b38765696e3d5d8d9d834d8aad4bb6e418e489. This wallet held 1,376,695 ETH, or 1.14% of the supply.
0x49048044d57e1c92a77f79988d21fa8faf74e97e. This wallet held 1,107,296 ETH, or 0.92% of the supply.
Ethereum Supply and Demand Fact Box
Supply and Distribution
Figures
Total Supply
120,702,572
Circulating Supply as of Dec.16, 2025
120,702,572 100% of total current supply)
Holder Distribution as of Dec.16, 2025
Top 10 holders owned 60.58% of the supply
From the Ethereum Whitepaper
In its technical documentation or whitepaper, Ethereum aims to utilize blockchain technology for more than just supporting cryptocurrency.
It explains: “Ethereum intends to provide a blockchain with a built-in, fully fledged Turing-complete programming language that can create ‘contracts.”
Ethereum was founded in 2013 by a team of developers led by Vitalik Buterin, a Russian-born and Canadian-based computer genius.
Ethereum (ETH) Explained
Before Ethereum, blockchains were primarily used to support cryptocurrencies, but the idea existed that they could also be utilized for purposes beyond financial transactions. In 2015, Ethereum allowed people to create decentralized applications (dApps).
Ethereum has undergone several hard forks. These are when a new form of the blockchain is created, making all valid transactions invalid and vice versa. However, it still has its native coin. This coin is technically called Ether, but most people refer to it as Ethereum.
Anyway, this crypto, known by its ticker handle ETH, pays for transactions on the blockchain.
How Ethereum Works
For a long time, the Ethereum blockchain employed a Proof-of-Work (PoW) consensus mechanism, which required individuals to solve increasingly complex equations to add blocks to the blockchain, earning rewards in return.
However, there were two significant problems with that. Firstly, it harmed the environment. According to data from the Ethereum Energy Consumption Index, the blockchain consumes upwards of 90 terawatt-hours (TWh) of energy per year. To put that into context, Ethereum used more energy than the entire nation of Kazakhstan.
Secondly, the Ethereum blockchain could become very slow and congested. This meant that transactions took longer, which cost people more money, and it also led to a surge in layer-2 scaling solutions.
These platforms linked to the Ethereum blockchain took transactions off the blockchain, carried them out, and then put them back on, theoretically saving time and money.
In 2020, Ethereum moved to a new consensus mechanism. A form of Proof-of-Stake (PoS), it now meant that people who held ETH could add blocks to the blockchain based on the amount of ETH they held.
The final move to PoS, dubbed The Merge, was completed on Sept. 15, 2022. This was expected to contribute to a bullish Ethereum price prediction, but the price has lagged behind Bitcoin since the Merge.
Is Ethereum a Good Investment?
It is hard to say. The news has recovered well from the news that the SEC is suing Binance and Coinbase. Not only that, but it is moving forward with new upgrades. However, while the Ethereum ETF launch went smoothly, ETH’s price did not necessarily reflect the interest in the new funds.
Not only that, but the Merge, which was to take Ethereum to a whole new level, was something of a damp squib, at least in terms of the ETH price.
On the other hand, the news that ETH staking has increased more than ever before suggests that, in technical terms, The Merge has been well-received. Meanwhile, it is doing better than it has in a long time.
Before making a decision, research Ethereum thoroughly, rather than focusing solely on price predictions.
Will Ethereum go up or down?
No one can say for sure. While many forecasts are upbeat, price predictions are often wrong. Remember, too, that prices can and do fluctuate.
Should I invest in Ethereum?
This is a question you will have to answer yourself. Before doing so, you must research ETH and other assets such as Bitcoin. It is also vital to never invest more money than you can afford to lose.
On Dec.16, 2025, a little more than 120 million ETH were in circulation, representing the total supply.
Will Ethereum reach $10,000?
Our price predictions suggest Ethereum might reach $10,000 in 2030.
What is Ethereum used for?
ETH supports the Ethereum blockchain. People can also buy, sell, and trade it on exchanges.
Disclaimer
Please note that the contents of this article are not financial or investing advice. The information provided in this article is the author’s opinion only and does not offer We do not make any warranties about this information’s completeness, reliability, or accuracy. The cryptocurrency market suffers from high volatility and occasional arbitrary movements. Any investor, trader, or regular crypto user should research multiple viewpoints and be familiar with all local regulations before committing to an investment.
Victor Olanrewaju is a crypto analyst and reporter at CCN with deep roots in on-chain research and technical analysis. His crypto journey began in 2017, but it was the 2020 Uniswap airdrop that sparked a full-time pivot into the space.
With a foundation in copywriting, Victor honed his craft creating high-converting content for leading crypto brokers — most notably an XRP price prediction that ranked #1 on Google during the 2021 bull run.
He later joined AMBCrypto in 2022, where he combined storytelling with technical and on-chain analysis to cover key market narratives.
In 2024, he expanded his expertise at BeInCrypto, collaborating with analysts and using tools like Glassnode, Santiment, and IntoTheBlock to break down Bitcoin and altcoin trends.
At CCN, Victor covers the top cryptocurrencies, memecoins, macro shifts, blending real-time insights with deep-dive metrics.
He holds a Bachelor’s degree in Physics from the University of Ibadan, equipping him to simplify complex data for a wide audience. Follow his work or connect on LinkedIn or X.
Valdrin Tahiri is a cryptocurrency analyst and reporter at CCN, specializing in technical analysis with a focus on Elliott Wave theory, on-chain metrics, and fundamental research. He brings over seven years of experience in the crypto space as both a trader and writer.
He discovered cryptocurrencies in 2017 while earning his MSc in Financial Markets at the Barcelona School of Economics, which sparked a deep interest in blockchain and market dynamics. Since then, he’s contributed to top crypto outlets like BeInCrypto and CoinGape.
Valdrin also served as Community Manager of BeInCrypto’s Telegram group for three years, helping grow it into one of the largest crypto communities worldwide. His expertise in market structure and price patterns allows him to break down complex trends into clear, actionable insights.
He’s published thousands of articles covering altcoins, Bitcoin cycles, and macro trends.