Arbitrum seems ready to recover in 2026 | Credit: Hameem Sarwar
Share
Key Takeaways
ARB remains down 27% this year, but technical indicators suggest a possible long-term recovery is starting.
Analysts see ARB trading between $0.10 and $0.80 in 2026, with bullish targets reaching $4 by 2030.
ARB has broken out of its downtrend and now needs to hold above $0.12 to maintain bullish momentum.
Arbitrum (ARB) has had a difficult 2026 by almost any measure. Down 27% year-to-date, sitting nearly 94% below its all-time high, and carrying the weight of a token that once launched with enormous fanfare but has yet to deliver on the price expectations.
But the chart is beginning to tell a different story — quietly, and in the kind of technical language that tends to precede moves the broader market only notices after they are already underway.
The question is no longer whether ARB has bottomed
In this analysis, CCN examines the price predictions for Arbitrum in 2026, 2027, and 2030.
Arbitrum Price Prediction
In this section, we present possible price predictions for ARB in 2026, 2027, and 2030. However, it is essential to note that these predictions are based on current market realities.
Some of these forecasts might change if broader market conditions shift and volatility rises.
Minimum ARB Price Prediction
Average ARB Price Prediction
Maximum ARB Price Prediction
2026
$0.10
$0.35
$0.80
2027
$0.30
$1
$2.40
2030
$0.80
$2.35
$4
Get These Top Crypto Casino Offers Now!
Sponsored
Disclosure
We sometimes use affiliate links in our content, when clicking on those we might receive a commission at no extra cost to you. By using this website you agree to our terms and conditions and privacy policy.
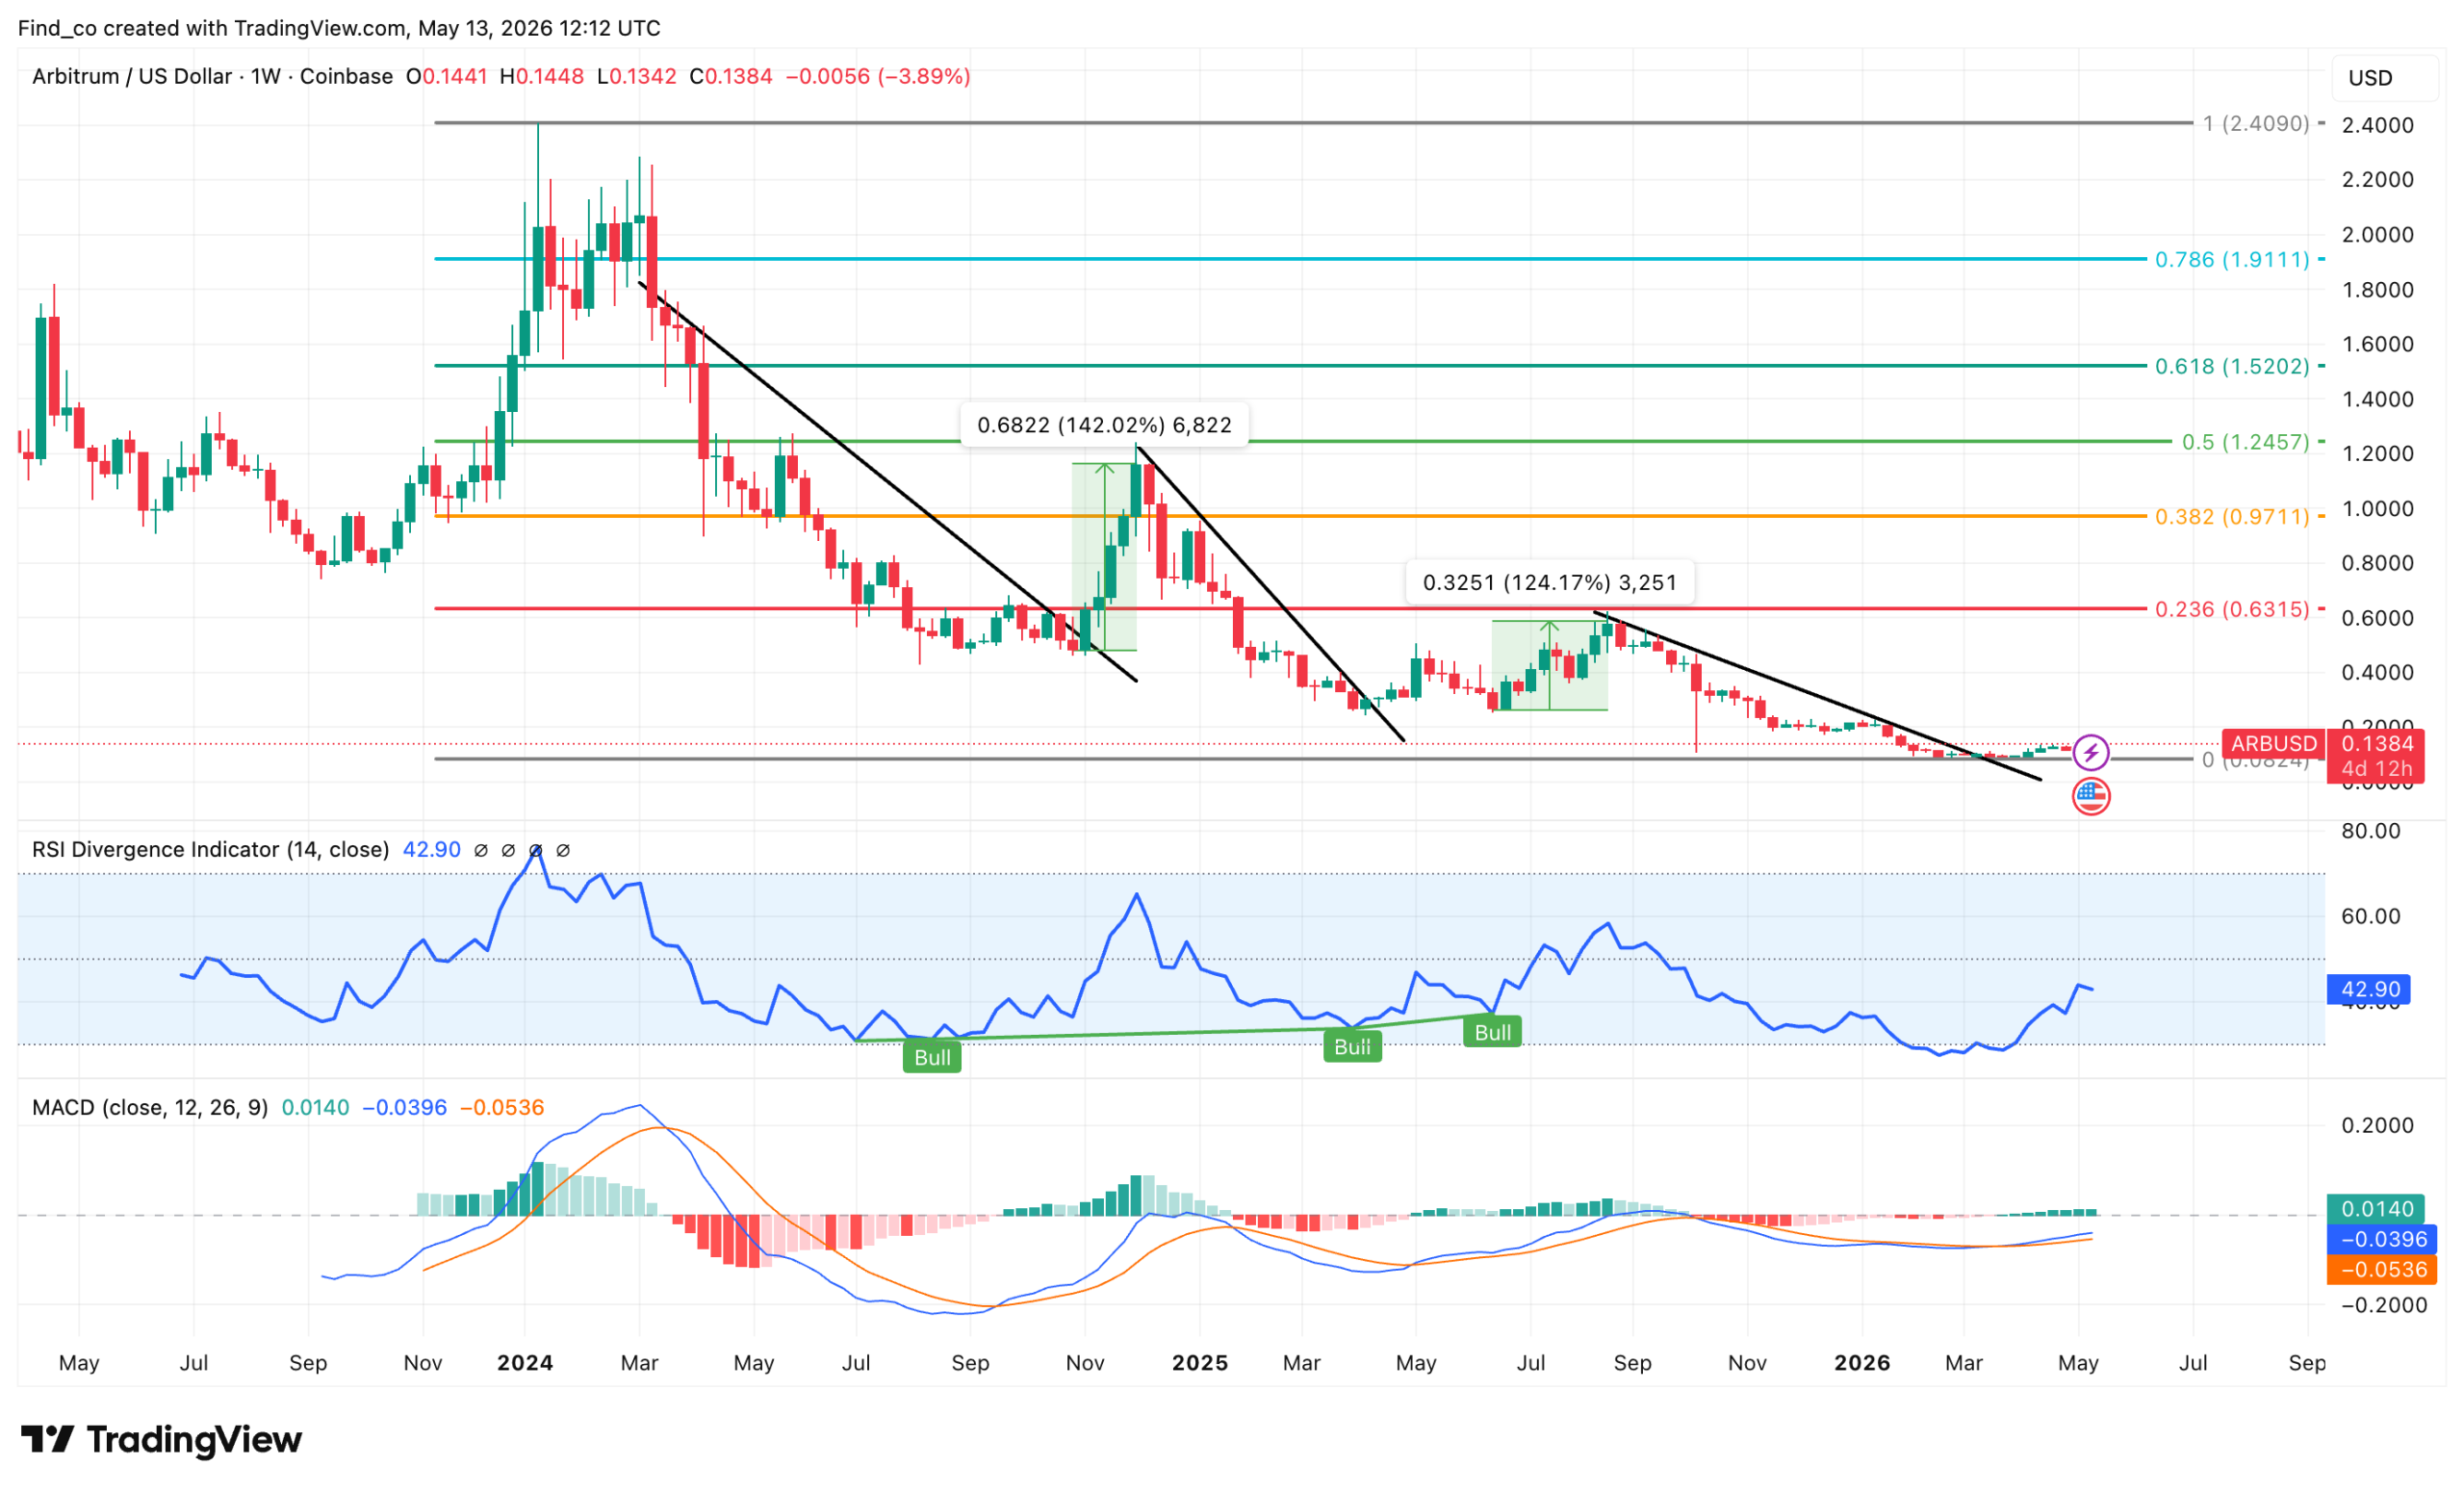
The weekly chart highlights multiple descending structures that previously led to sharp breakdowns, but the current setup is different: price is stabilizing near historical lows while momentum indicators are beginning to recover.
The RSI is printing a bullish divergence on the weekly timeframe, indicating weakening bearish momentum even as the price remains near the bottom of the range.
At the same time, the MACD histogram is turning positive again, suggesting momentum is slowly shifting back toward buyers.
Historically, similar structures on ARB led to strong relief rallies of over 120%, which is why the current breakout attempt above the long-term descending trendline is important.
Price is still trading below the major Fibonacci resistance levels, with the first major recovery target sitting around $0.214 and stronger resistance near $0.29.
However, holding above the $0.10 accumulation zone keeps the broader recovery structure intact.
If market conditions remain favorable and Ethereum L2 narratives strengthen again, ARB could continue transitioning from accumulation into a larger expansion phase.
Arbitrum Price Prediction 2026
For 2026, the Arbitrum price prediction could average around $0.25 to $0.35 if the current recovery structure continues.
A bearish scenario could revisit $0.10, while a strong altseason and renewed L2 demand may push the price toward $0.80
Arbitrum Price Prediction 2027
For 2027, ARB may benefit from wider Ethereum scaling adoption and stronger institutional participation in Layer 2 ecosystems.
Average estimates could range around $1, with downside near $0.30 and bullish targets potentially reaching $2.40 if ARB’s price regains major market momentum
Arbitrum Price Prediction 2030
By 2030, ARB’s valuation will likely depend on whether Arbitrum maintains dominance among Ethereum scaling solutions.
Conservative projections place the average price around $2.35, with bearish scenarios near $0.80, while a strong long-term crypto cycle could push ARB toward $4.
ARB Price Analysis
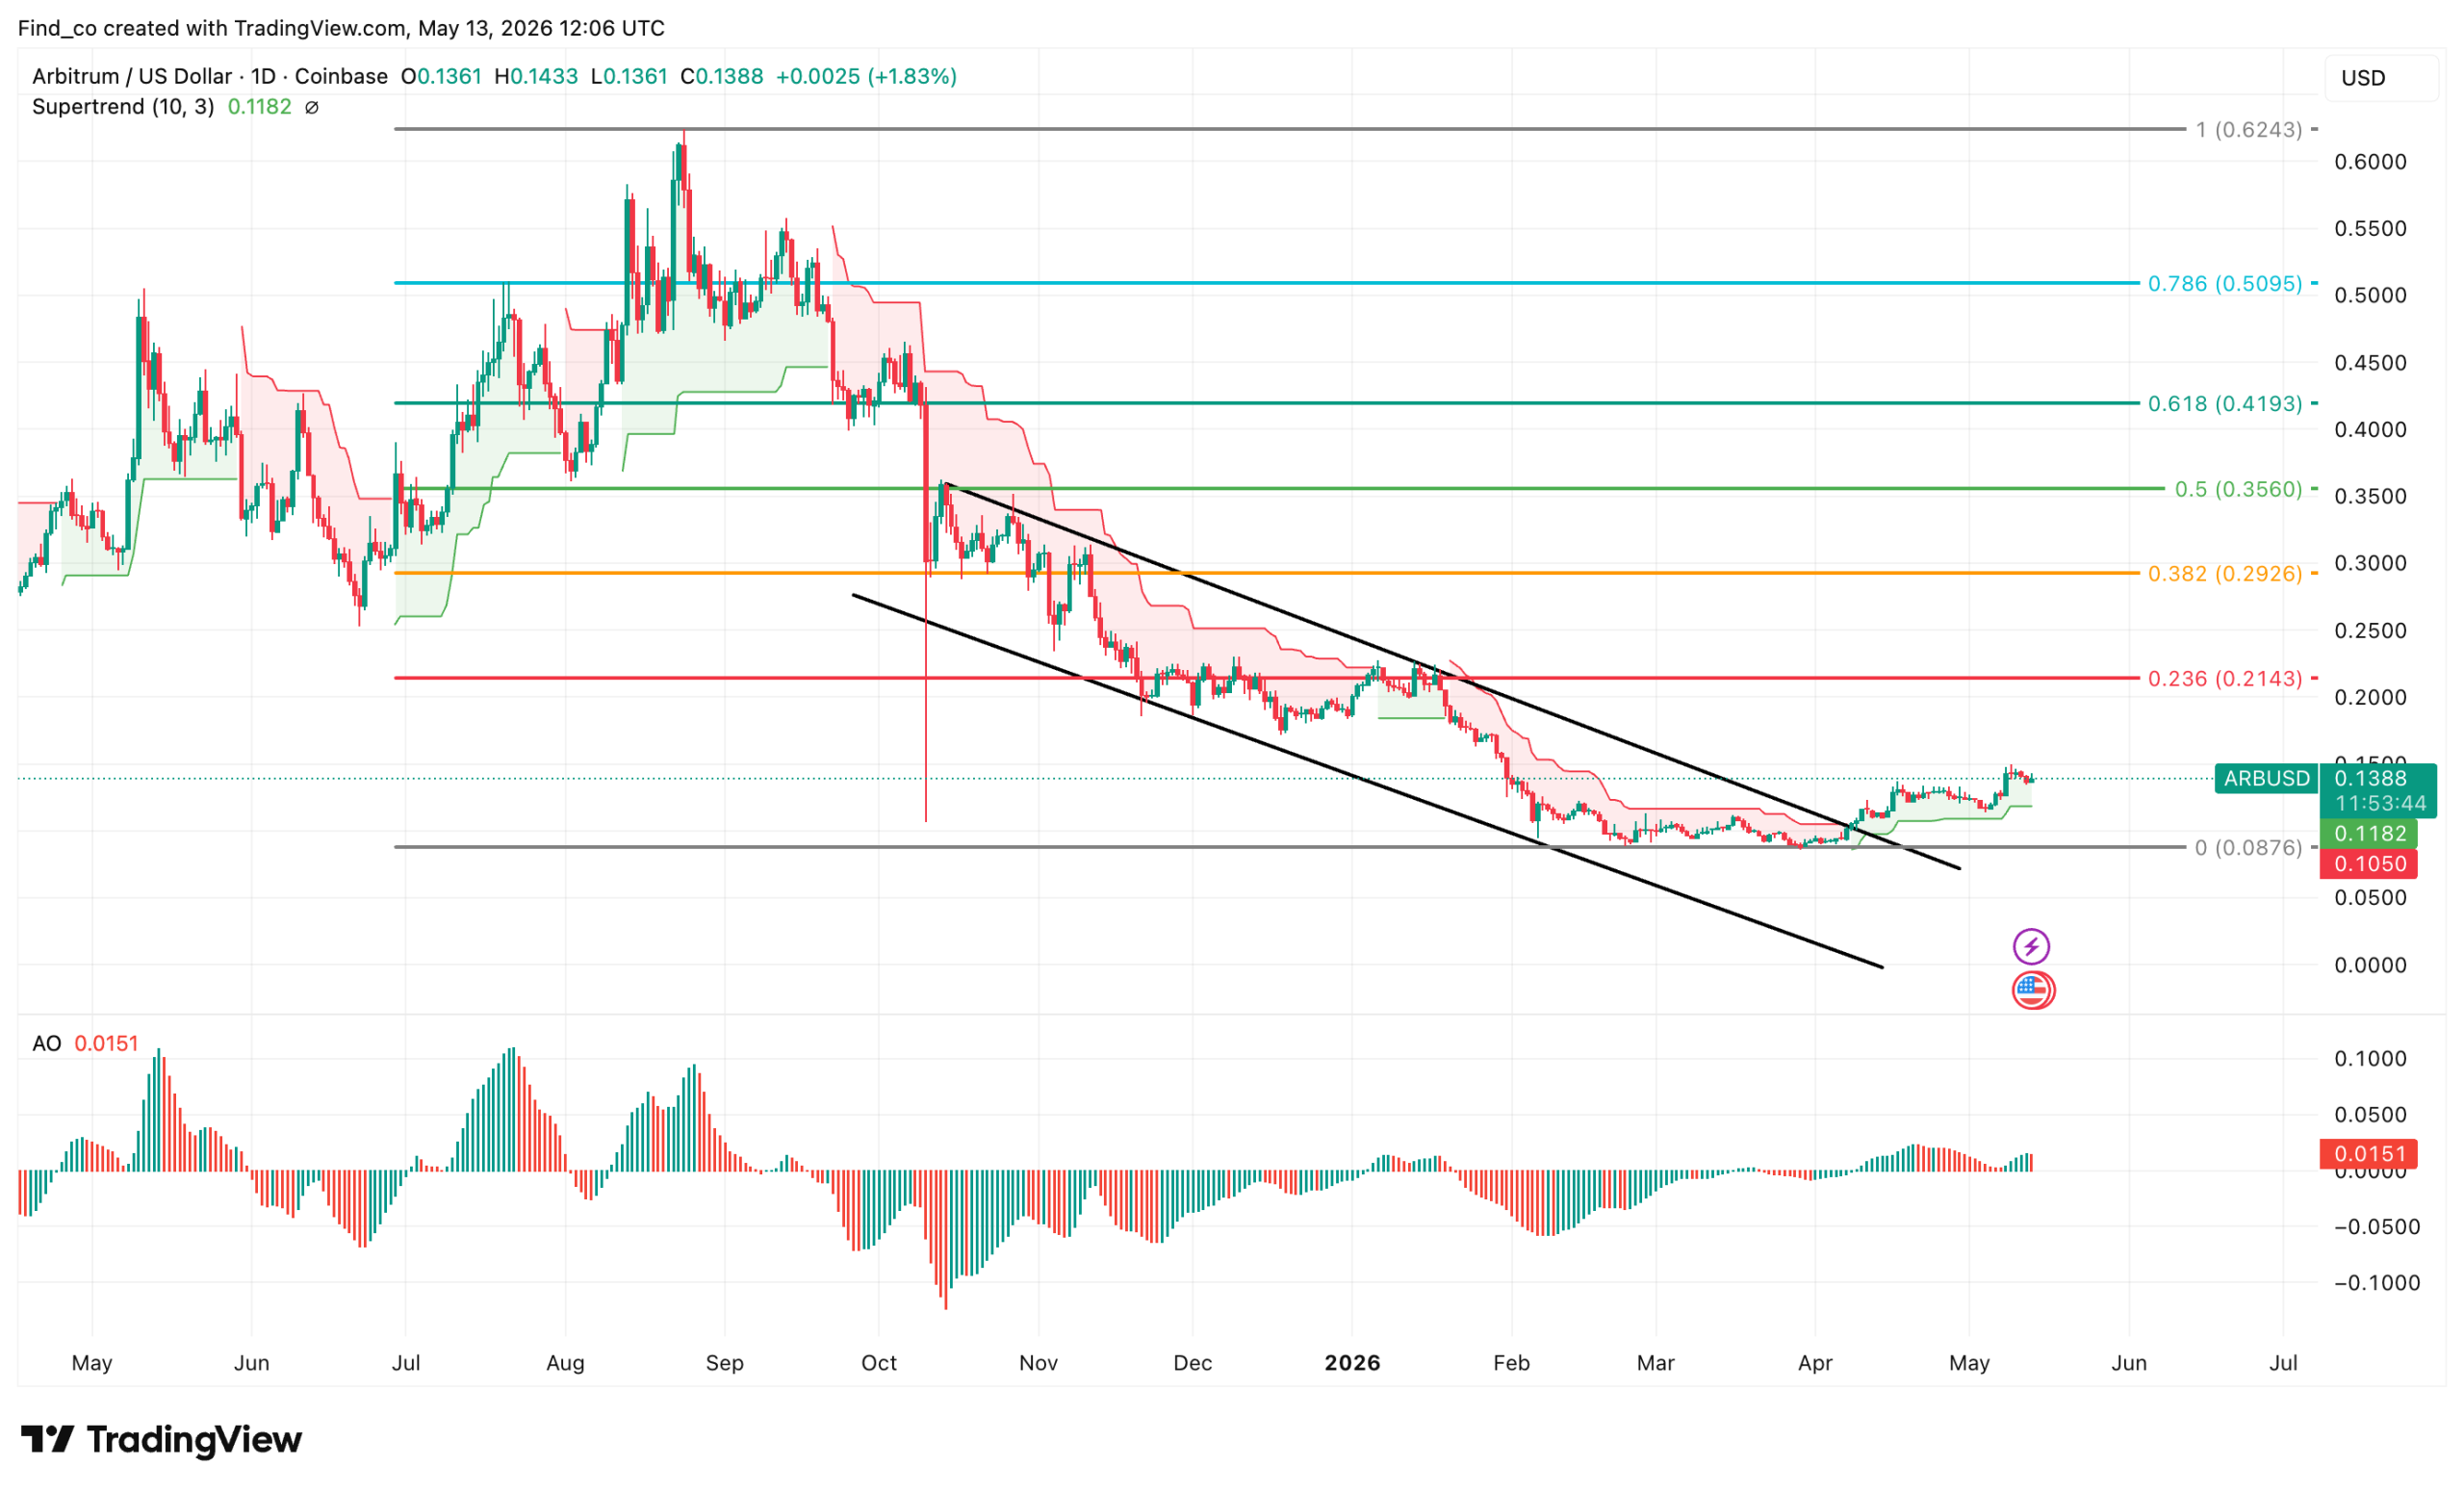
ARB appears to be transitioning from a long-term downtrend into an early recovery phase after successfully breaking out of the descending channel that controlled price action for months.
The breakout above the channel, combined with the Supertrend flip bullish around $0.118, suggests momentum is shifting in favor of buyers for the first time in a while.
Price is now consolidating above the breakout zone rather than falling back into the channel, which is an important sign of strength.
Furthermore, the AO histogram remains positive, indicating that bullish momentum is still building, even though the move has slowed slightly in the short term.
The key level now is the $0.12 region, which has become major support after the breakout.
As long as ARB’s price holds above that area and the Supertrend remains bullish, the structure favors a continuation higher toward the 0.236 Fib at $0.21.
In the short term, the market may continue consolidating after the recent rally. However, the broader setup looks bullish because ARB is finally forming higher lows and breaking its long-term bearish structure.
Short-Term ARB Price Prediction
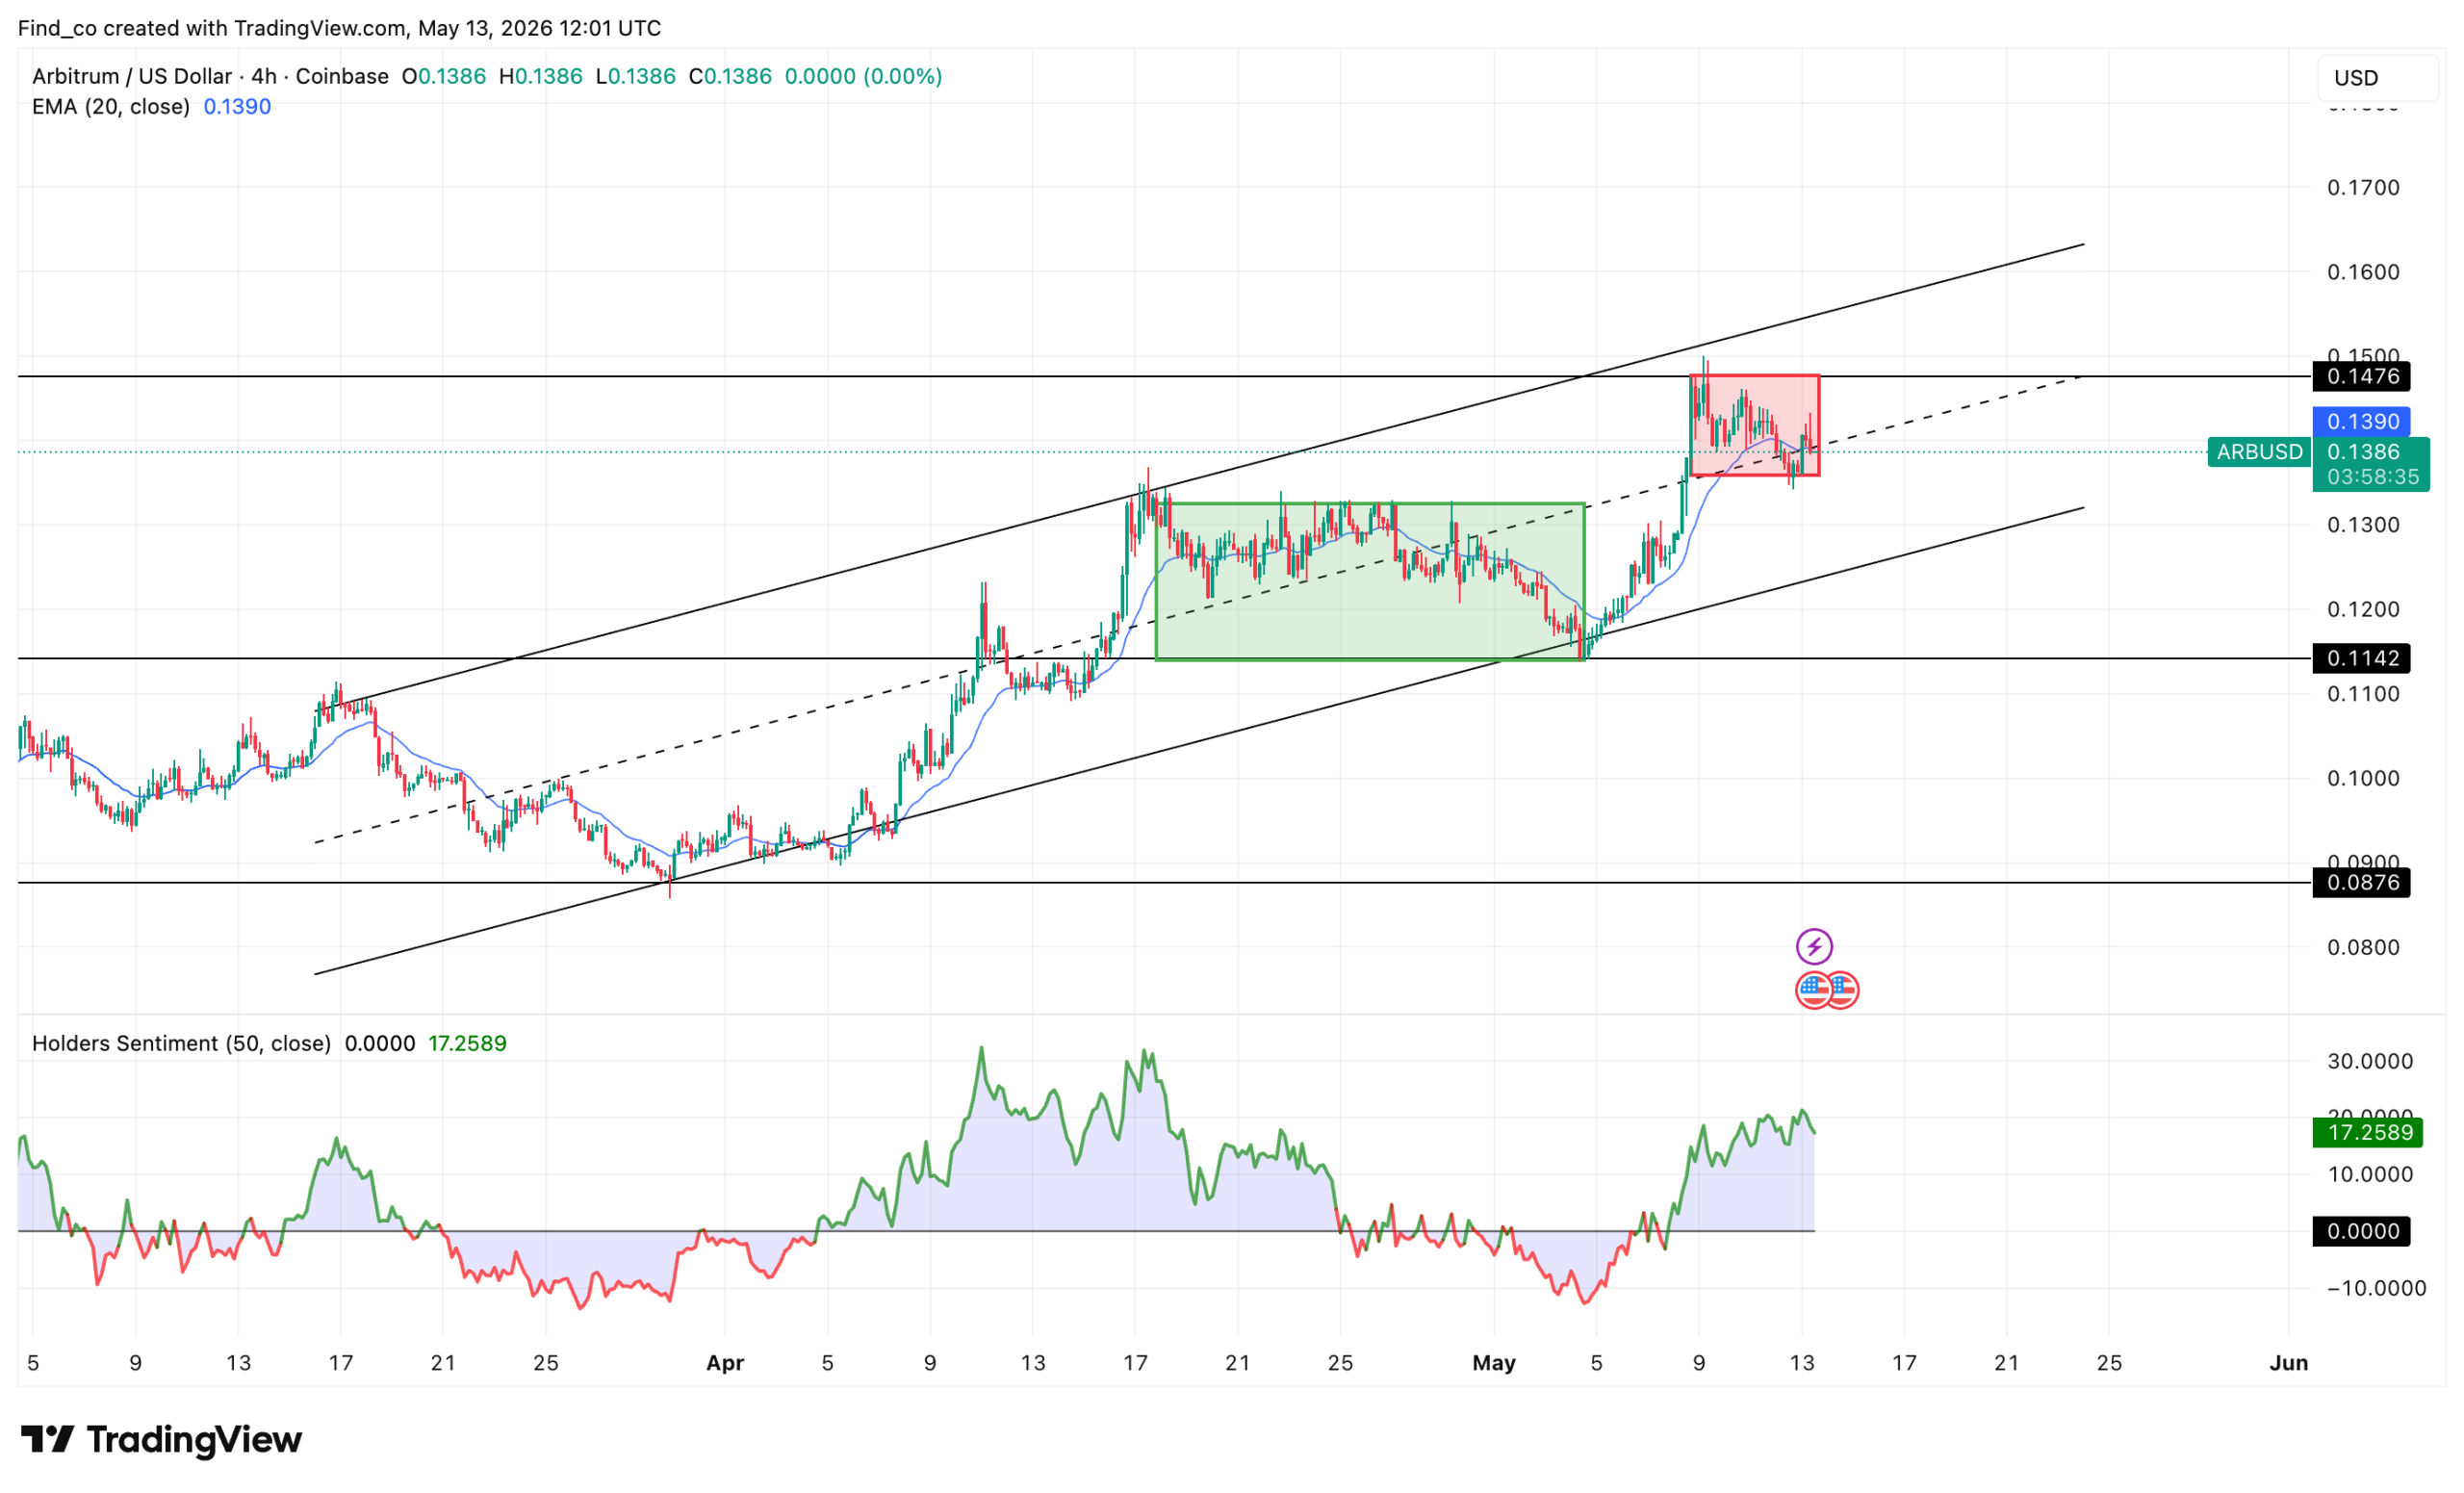
On the 4-hour chart, ARB shows a continued bullish structure after breaking out of the earlier consolidation range.
As of this writing, the price is now consolidating beneath the key $0.15 resistance zone, which is currently acting as the main breakout level bulls need to clear for continuation.
The sideways movement inside the red box resembles a bullish continuation consolidation rather than a bearish reversal.
Despite short-term volatility, ARB continues to hold above the 20-EMA and remains within the broader ascending channel, suggesting buyers are still defending higher lows.
The recent move above the $0.114 support zone also confirms that strong momentum has returned after the May retracement.
A positive sentiment reversal is another bullish signal, suggesting improved confidence and renewed accumulation.
So, if Arbitrum’s price breaks above $0.15, the setup favors continuation toward the upper channel resistance around $0.17.
However, if the current range fails to hold, the price could retrace toward the $0.13–0.125 region for support before attempting another breakout.
CCN Strength Index
The CCN Strength Index combines a range of advanced market signals to measure the strength of individual cryptocurrencies over the past 30 days.
Every day, it assigns a strength score, ranging from 0 to 100, to the top 500 assets by market capitalization on CoinMarketCap, focusing on both trend direction and the intensity of price movements.
0 to 24: Assets exhibit significant weakness, showing signs of sustained downtrend behavior.
25 to 35: The price tends to move within stable bounds with minimal volatility.
36 to 49: Assets begin a stable uptrend but without strong surges.
50 to 59: Consistent growth with moderate price advances, building momentum.
60+: Sharp price movements and high demand indicate more substantial volatility and trend shifts.
The index dynamically adapts to rapid changes. For example, an asset experiencing a 100% increase within a short timeframe would see a sharp jump in its score to reflect the intensity of the rise.
However, should that asset stabilize at this new price level, the score will gradually taper down and align with the dampened momentum as the movement normalizes. The same principle applies to rapid declines: a sudden drop will temporarily spike the score downward, but it will slowly adjust as volatility decreases.
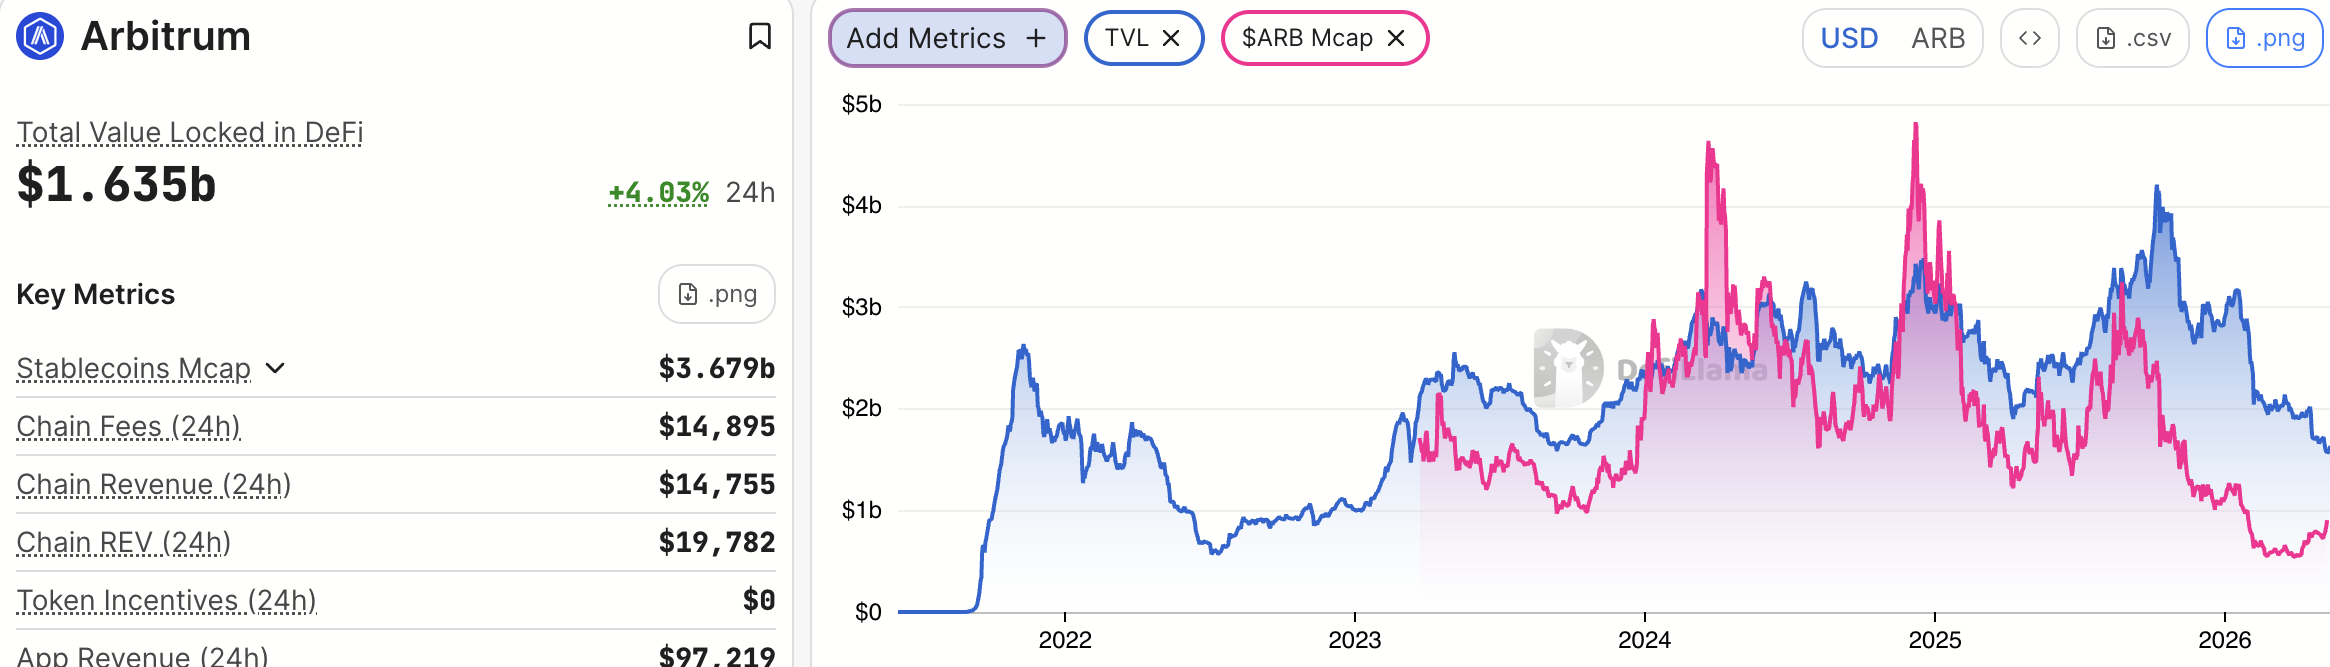
Using the Market Cap / TVL formula, ARB has an MC/TVL ratio of roughly 0.51, indicating the market values the token at only about 51% of the capital locked in the ecosystem.
Historically, strong Layer 1 and Layer 2 ecosystems often trade at MC/TVL ratios above 1 during healthier market conditions.
A ratio below 1 can indicate that the network is fundamentally undervalued, especially as the chain continues to attract liquidity, users, and DeFi activity.
The chart also shows a major divergence forming over time: TVL has remained relatively strong while ARB’s market cap has collapsed significantly since 2024.
That disconnect suggests the network itself is retaining value and usage even as the token price has lagged.
In simple terms, Arbitrum is currently securing nearly twice the value the market assigns to the token itself.
If sentiment improves and capital rotates back into Ethereum Layer 2s, ARB could eventually reprice upward to better reflect the strength of its ecosystem fundamentals.
Best Days and Months to Buy ARB
We examined the ARB price history and found the lowest prices on certain days, months, quarters, and weeks in the year, indicating the best times to buy ARB.
0x30795604b2727e272486b65e73b3f0b72c39b326. This wallet held 21,002,246 ARB, or 18.41% of the supply.
0xcd74df7b8f0e01aa57ff5ce2518c53439370a4df. This wallet held 17,244,762 ARB, or 15.42% of the supply.
0x95775aaf7cc9ab8fe2d13c5d0266ebfe6a9ed759. This wallet, listed as Bitget, held 4,966,396 ARB, or 4.35% of the supply.
0xd4bd3b92b42dca1ed0058cdb6ab9a40767e639f4. This wallet held 2,389,942 ARB, or 2.10% of the supply.
0xd4bd3b92b42dca1ed0058cdb6ab9a40767e639f4. This wallet held 2,234,658 ARB, or 1.96% of the supply.
Arbitrum Supply and Distribution
Supply and distribution
Figures
Total supply
10,000,000,000
Circulating supply as of May 13, 2026
6,150,718,438(61.50% of total supply)
Holder distribution
Top 10 holders owned nearly 40% of the ARB supply as of May 13, 2026
From the Arbitrum Whitepaper
In its technical documentation or whitepaper, Arbitrum states that it aims to improve Ethereum for developers.
It says: “Arbitrum is a protocol that makes Ethereum transactions faster and cheaper. Developers use Arbitrum to build user-friendly decentralized apps (dApps) to take advantage of the scalability benefits of the Arbitrum Rollup and AnyTrust protocols.”
Arbitrum (ARB) Explained
Although Ethereum is one of crypto’s biggest success stories, it has not been without problems. One significant issue is the system’s slowness.
The September 2022 transition to a Proof-of-Stake consensus mechanism was designed to address that. However, there are still concerns about the system’s slowness compared to other networks.
As a result, the market for Layer-2 scaling solutions, programs that take a transaction off a blockchain, carry it out, and put it back, has not gone away.
Arbitrum, launched last year, is just one of the many Layer-2 scaling solutions. Its native token, ARB, launched in March 2023.
Offchain Labs, a New York-based software development company, created Arbitrum. Offchain is the brainchild of computer experts Steven Goldfelder, Ed Felten, former President Barack Obama’s deputy CTO, and Harry Kalodner.
How Arbitrum Works
Arbitrum uses optimistic rollups to move work off Ethereum and run it on its own network. These programs work with smart contracts, computer programs that automatically execute when certain conditions are met, to help validate transactions.
The idea is that doing so helps the platform work more quickly, which, in turn, saves its users money. The platform assumes that every transaction is valid and only verifies it if a fraud-proof submission is submitted.
People who hold ARB can vote on proposals regarding the future of the Arbitrum network. Meanwhile, crypto can be bought, sold, and traded on exchanges.
Because ARB is based on Ethereum, it is a token rather than a coin. You might see references to things like an Arbitrum coin price prediction, but these are very often wrong.
Is Arbitrum a Good Investment?
It is perhaps a little too soon to tell. Arbitrum is still some way from its March 24 all-time high.
The news about integrating a famous NFT character into Square Enix’s video game may boost the coin.
As always with crypto, you must research before deciding whether or not to invest in ARB.
Will Arbitrum go up or down?
No one can tell right now. While the forecasts are, on the whole, positive, remember that crypto price predictions have a well-earned reputation for being wrong. You should also understand that prices can and do go down and up.
Should I Invest in Arbitrum?
Before you decide whether or not to invest in Arbitrum, you will have to research ARB and other similar tokens, such as Polygon (POL). Ultimately, though, this is a decision you will have to make for yourself. Just remember never to invest more money than you can afford to lose.
As of May 13, 2026, 6.15 billion ARB were in circulation out of a total supply of 10 billion.
Will Arbitrum reach $10?
Our price predictions suggest that ARB will not reach $5 this year, but it could surpass it by 2030.
What is Arbitrum used for?
ARB is the governance token for Arbitrum, the Ethereum Layer-2 scaling solution. This means that ARB holders can vote on changes to the network. People can also buy, sell, and trade on exchanges.
Is ARB a good coin to buy
Currently, we can’t tell if ARB is good cryptocurrency to hold considering the volatility around the crypto market.
Disclaimer
Please note that the contents of this article are not financial or investing advice. The information provided in this article is the author’s opinion only and should not be considered as offering trading or investing recommendations. We do not make any warranties about the completeness, reliability, or accuracy of this information. The cryptocurrency market suffers from high volatility and occasional arbitrary movements. Any investor, trader, or regular crypto user should research multiple viewpoints and be familiar with all local regulations before committing to an investment.
Victor Olanrewaju is a crypto analyst and reporter at CCN with deep roots in on-chain research and technical analysis. His crypto journey began in 2017, but it was the 2020 Uniswap airdrop that sparked a full-time pivot into the space.
With a foundation in copywriting, Victor honed his craft creating high-converting content for leading crypto brokers — most notably an XRP price prediction that ranked #1 on Google during the 2021 bull run.
He later joined AMBCrypto in 2022, where he combined storytelling with technical and on-chain analysis to cover key market narratives.
In 2024, he expanded his expertise at BeInCrypto, collaborating with analysts and using tools like Glassnode, Santiment, and IntoTheBlock to break down Bitcoin and altcoin trends.
At CCN, Victor covers the top cryptocurrencies, memecoins, macro shifts, blending real-time insights with deep-dive metrics.
He holds a Bachelor’s degree in Physics from the University of Ibadan, equipping him to simplify complex data for a wide audience. Follow his work or connect on LinkedIn or X.