This analysis breaks down what lies ahead for Bitcoin price | Credit: Hameem Sarwar
Share
Key Takeaways
BTC has dropped below its 50-day moving average and is testing the 200-day MA.
It continues to exhibit “fat-tail” risk, where extreme single-day moves occur far more frequently.
While 30-day rolling volatility has spiked, the long-term trend shows volatility is structurally declining.
Data confirms a strong Q4 “Crypto Season,” which is consistently Bitcoin’s highest-performing period.
This analysis presents five different scenarios, with BTC price either falling or consolidating.
Bitcoin (BTC) price action has never been boring.
Since early 2020, it has delivered historic bull runs, gut-wrenching crashes, and a jaw-dropping recovery to six-figure territory.
Now, in 2026, the flagship cryptocurrency sits at a critical juncture.
Notably, the Bitcoin price has corrected from a peak near $126,000. As a result, market participants are asking one urgent question: Is Bitcoin a buy at the current level?
The answer lies in the data. Five charts, covering price trends, moving averages, daily return distributions, rolling volatility, and monthly return seasonality, tell a compelling story.
Together, they reveal patterns that have repeated across multiple cycles. They also highlight where Bitcoin’s price stands today, and where it could go next.
The Big Picture: Bitcoin’s Price Trend from 2020 to 2026
It immediately shows a pattern that serious analysts have observed across multiple cycles: Bitcoin moves in distinct, powerful waves.
In early 2020, Bitcoin traded near $7,000 to $10,000. Then institutional money arrived. Retail investors piled in.
By April 2021, the price had reached approximately $63,000, a ninefold increase in just over a year.
While the rally was historic, it also proved unsustainable.
From mid-2021 onward, Bitcoin’s price reversed sharply. The Federal Reserve began signaling rate hikes. Crypto lenders collapsed.
By late 2022 and early 2023, BTC had fallen to roughly $16,000 — a painful 75% decline from its peak.
Many declared Bitcoin dead. They were wrong. However, others who decided to it was time to buy Bitcoin then got rewarded.
The recovery that followed was methodical. Bitcoin’s price climbed back through 2023, gaining momentum through 2024 as institutional adoption accelerated.
The April 2024 halving (which cut miner rewards in half) further tightened supply.
By late 2024 and into 2025, Bitcoin exploded to a new all-time high near $125,000. It was an extraordinary vindication for long-term holders.
Now comes the critical part. As of early 2026, Bitcoin has corrected sharply to the $65,000–$70,000 range. This represents a decline of roughly 45–50% from the peak.
Historically, such corrections within a bull cycle are not unusual. In 2021, Bitcoin fell 50% mid-cycle before resuming its climb.
History does not always repeat, but it often rhymes.
Moving Averages Flash a Warning Sign
Moving averages strip away the noise. They reveal the underlying direction of momentum.
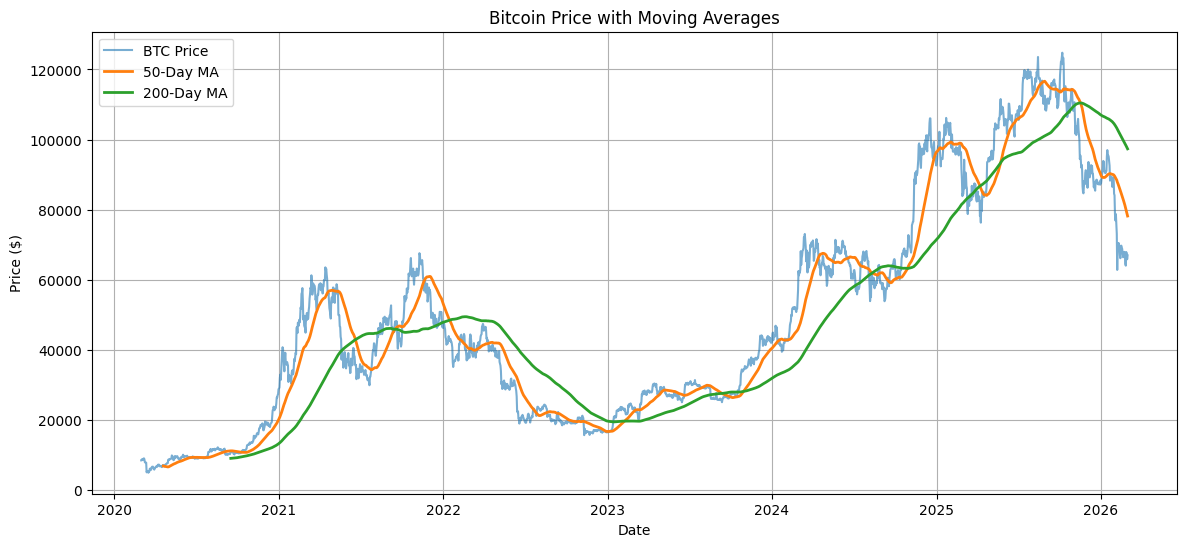
The second chart overlays two critical indicators on Bitcoin’s price: the 50-day moving average (50-MA) and the 200-day moving average (200-MA).
Traders treat the 200-MA as the ultimate dividing line between bull and bear markets.
When the price trades above it, bulls are in control. When the price falls below it, bears take charge.
The 50-MA, meanwhile, serves as a faster-reacting trend line. It signals shorter-term momentum shifts.
The chart shows something important. During Bitcoin’s entire 2024–2025 bull run, the price remained well above both moving averages. The 50-MA closely tracked the rally, acting as dynamic support.
The 200-MA rose steadily throughout 2024 and into 2025, reflecting the strength of the long-term uptrend.
However, the early 2026 correction has dramatically changed the picture. Bitcoin’s price has now dropped decisively below the 50-MA, which currently sits around $80,000–$85,000.
More critically, the price is approaching, and possibly breaching, the 200-MA, which sits near $98,000–$105,000.
BTC Price With Moving Averages | Credit: Python Programmed by Dr. Guneet Kaur
The 50-MA is also curling downward and converging toward the 200-MA from below. If the 50-MA crosses below the 200-MA, it creates what analysts call a “Death Cross” — a historically bearish signal.
The last notable Death Cross occurred in 2022 and was followed by further losses. Traders watch this indicator closely.
On the other hand, history also shows that Death Crosses during Bitcoin bull cycles can mark bear traps.
In some cases, they signal the final capitulation before a renewed move higher.
Bitcoin Returns: Fat Tails, Asymmetric Risk
Most assets follow a roughly normal distribution of daily returns. Bitcoin does not.
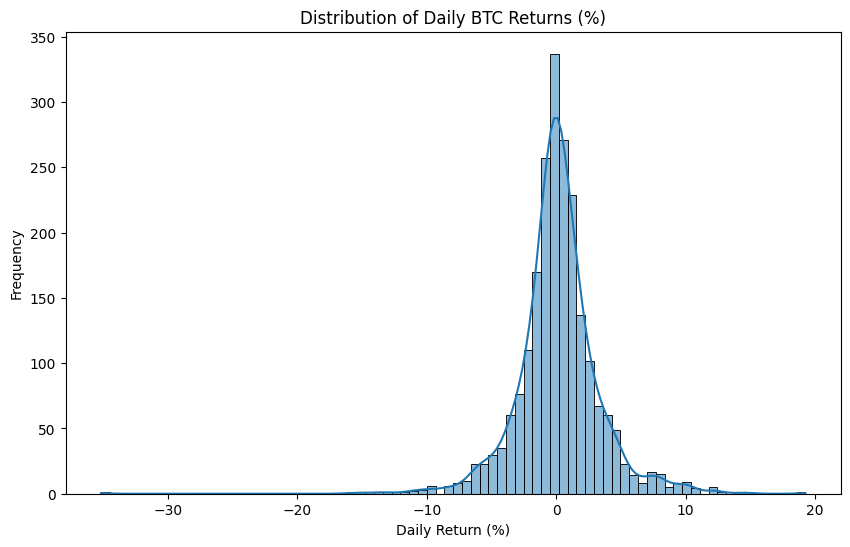
The third chart shows the actual distribution of Bitcoin’s daily percentage returns from 2020 to 2026. It reveals something every investor should understand before allocating capital.
The distribution has a very tall, thin peak near zero, and notably fat tails at both extremes. In plain terms, most Bitcoin days are quiet and uneventful.
However, extreme moves (both up and down) happen far more often than a normal distribution would predict.
The left tail of the distribution extends to approximately 35%. That is a single-day loss of more than one-third of Bitcoin’s value. These events are rare, but they happen.
The March 2020 COVID crash and the May 2021 sell-off both produced extreme left-tail events. So did the FTX collapse in November 2022.
Meanwhile, the right tail of the distribution reaches approximately +20%. This confirms that Bitcoin can also produce large positive single-day returns.
BTC Daily Returns | Credit: Python Programmed by Dr. Guneet Kaur
However, a subtle but important detail emerges: the left tail is longer and fatter than the right. This indicates negative skew — extreme losses are slightly more severe than extreme gains.
For risk managers, this distribution has direct implications. Stop-loss orders, position sizing, and portfolio diversification all need to account for the possibility of sudden, severe drawdowns.
Leverage, in particular, is extremely dangerous in this market condition. A single fat-tail event can wipe out a leveraged position in a matter of hours.
For long-term holders, the picture is more encouraging. The strong clustering of returns near zero, combined with Bitcoin’s long-term upward drift, means that patient investors who avoid leverage and panic selling are rewarded over time.
However, the path is never smooth.
Volatility Is Declining, but A New Spike Has Arrived
Volatility is the measure of how violently an asset’s price swings over time.
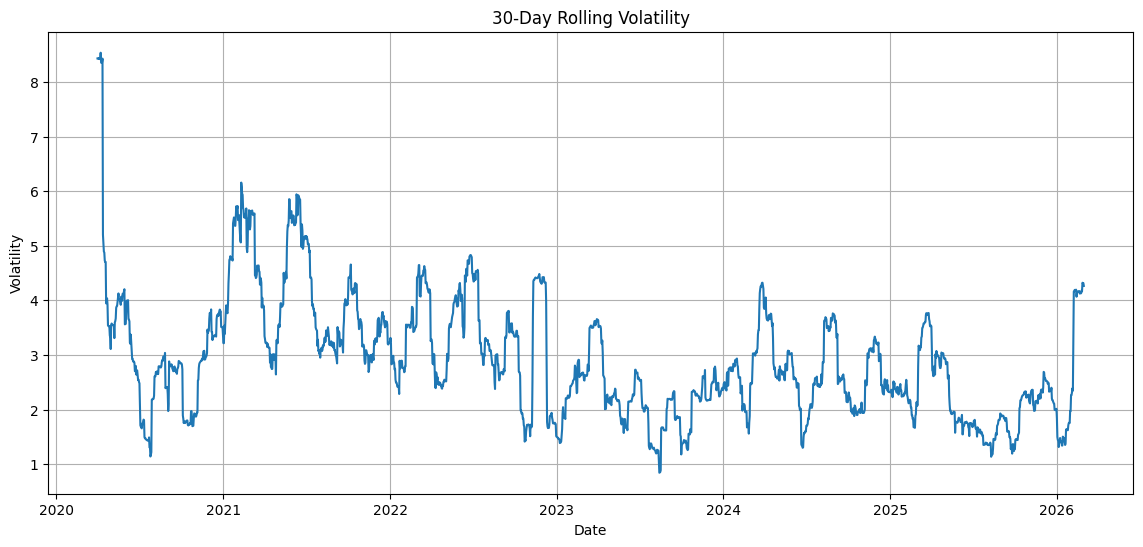
The fourth chart tracks Bitcoin’s 30-day rolling volatility from 2020 through early 2026. The trend it reveals is both reassuring and alarming, depending on where you look.
The most extreme reading in the chart occurred in early 2020. COVID-19 triggered a global market panic.
Bitcoin’s 30-day volatility spiked to approximately 8.5 — the highest level in the entire dataset.
Fear was absolute. Liquidity dried up. The price crashed by over 50% in a day.
After that spike, volatility declined significantly. Through 2021’s bull run, it hovered between 5 and 6 during the most intense periods of price action.
That is still high by any standard, but notably lower than the 2020 peak. As Bitcoin became more widely owned and more liquid, its volatility began to decline structurally.
BTC 30-Day Volatility | Credit: Python Programmed by Dr. Guneet Kaur
Through 2022, 2023, 2024, and most of 2025, this trend continued. Volatility generally ranged between 1 and 4, remarkably contained for an asset with Bitcoin’s reputation.
This reflects deeper market infrastructure. Spot ETFs attracted institutional money. Derivatives markets matured. Larger order books absorbed shocks more effectively.
However, the early 2026 correction has pushed volatility back toward 4-4.5.
This is not yet alarming by historical standards. It does, however, confirm that the current price decline is not a gentle, orderly pullback. It is a volatile, forceful correction that demands attention.
Interestingly, declining volatility over Bitcoin’s history is itself a bullish structural signal.
As an asset matures, lower volatility typically reflects deeper liquidity, greater institutional participation, and reduced speculative excess.
Seasonal Patterns — When Does Bitcoin Perform Best?
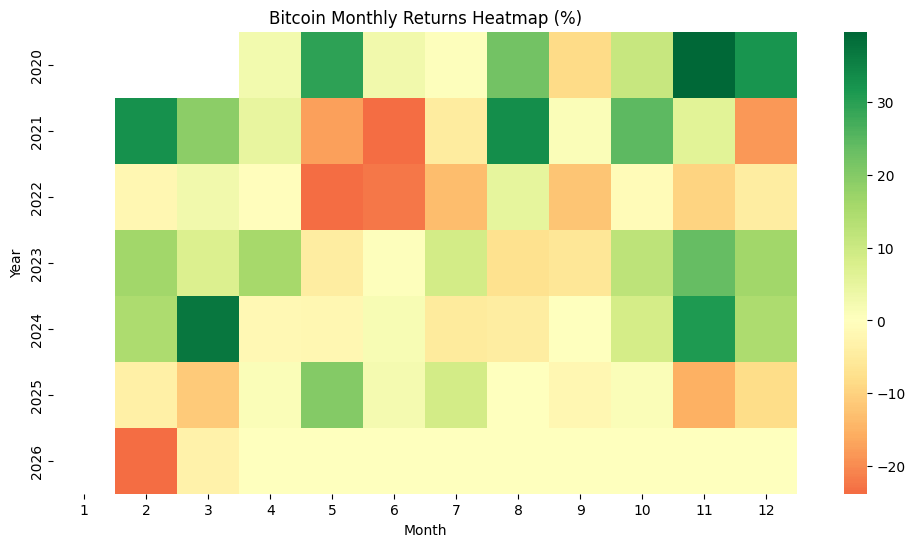
Seasonality matters more than most investors realize. The fifth chart presents a monthly returns heatmap for Bitcoin from 2020 through early 2026.
Red signals losses. Darker shades mean larger moves.
Several patterns emerge clearly. October, November, and December have historically been Bitcoin’s strongest months. In 2020, this trio produced a powerful year-end rally that set the stage for the 2021 bull run.
BTC Monthly Returns Heatmap | Credit: Python Programmed by Dr. Guneet Kaur
In 2024, the fourth quarter also delivered outsized gains. The phrase “Q4 is crypto season” has strong empirical backing in this data.
February also stands out as historically strong. In 2021 and 2024, February produced some of the deepest green readings in the entire heatmap. This aligns with the pattern of post-halving momentum building in the months following the event.
On the other hand, certain months are consistently weak. January 2026 shows a deep red reading — a sharp, early-year sell-off consistent with post-peak profit-taking. May and June have also shown weakness in multiple years.
The crypto community has long referenced “sell in May and go away” as an observed, if imperfect, seasonal tendency.
The 2022 row is almost entirely red or pale, reflecting the catastrophic year Bitcoin endured as interest rates surged and crypto lending markets collapsed.
This reminds us that macro forces can overwhelm seasonal tendencies. No seasonal pattern is guaranteed.
For forward-looking holders, the heatmap offers a useful lens. If Bitcoin stabilizes and finds support in the coming months, the historically stronger Q4 period could provide a meaningful catalyst for recovery.
However, that depends on macro conditions, regulatory clarity, and whether institutional demand returns at scale.
What It All Means for BTC Price Going Forward: A Critical Analysis
Five data sets. One clear picture. Bitcoin is in a significant correction after an extraordinary bull run to $125,000.
The price trend confirms this is consistent with prior mid-cycle or post-cycle pullbacks. The moving averages signal that critical technical support levels are under serious test.
The return distribution reminds investors that extreme moves are always possible.
Volatility is elevated but not historically extreme. And seasonal patterns suggest the worst months for performance may be behind us, at least historically.
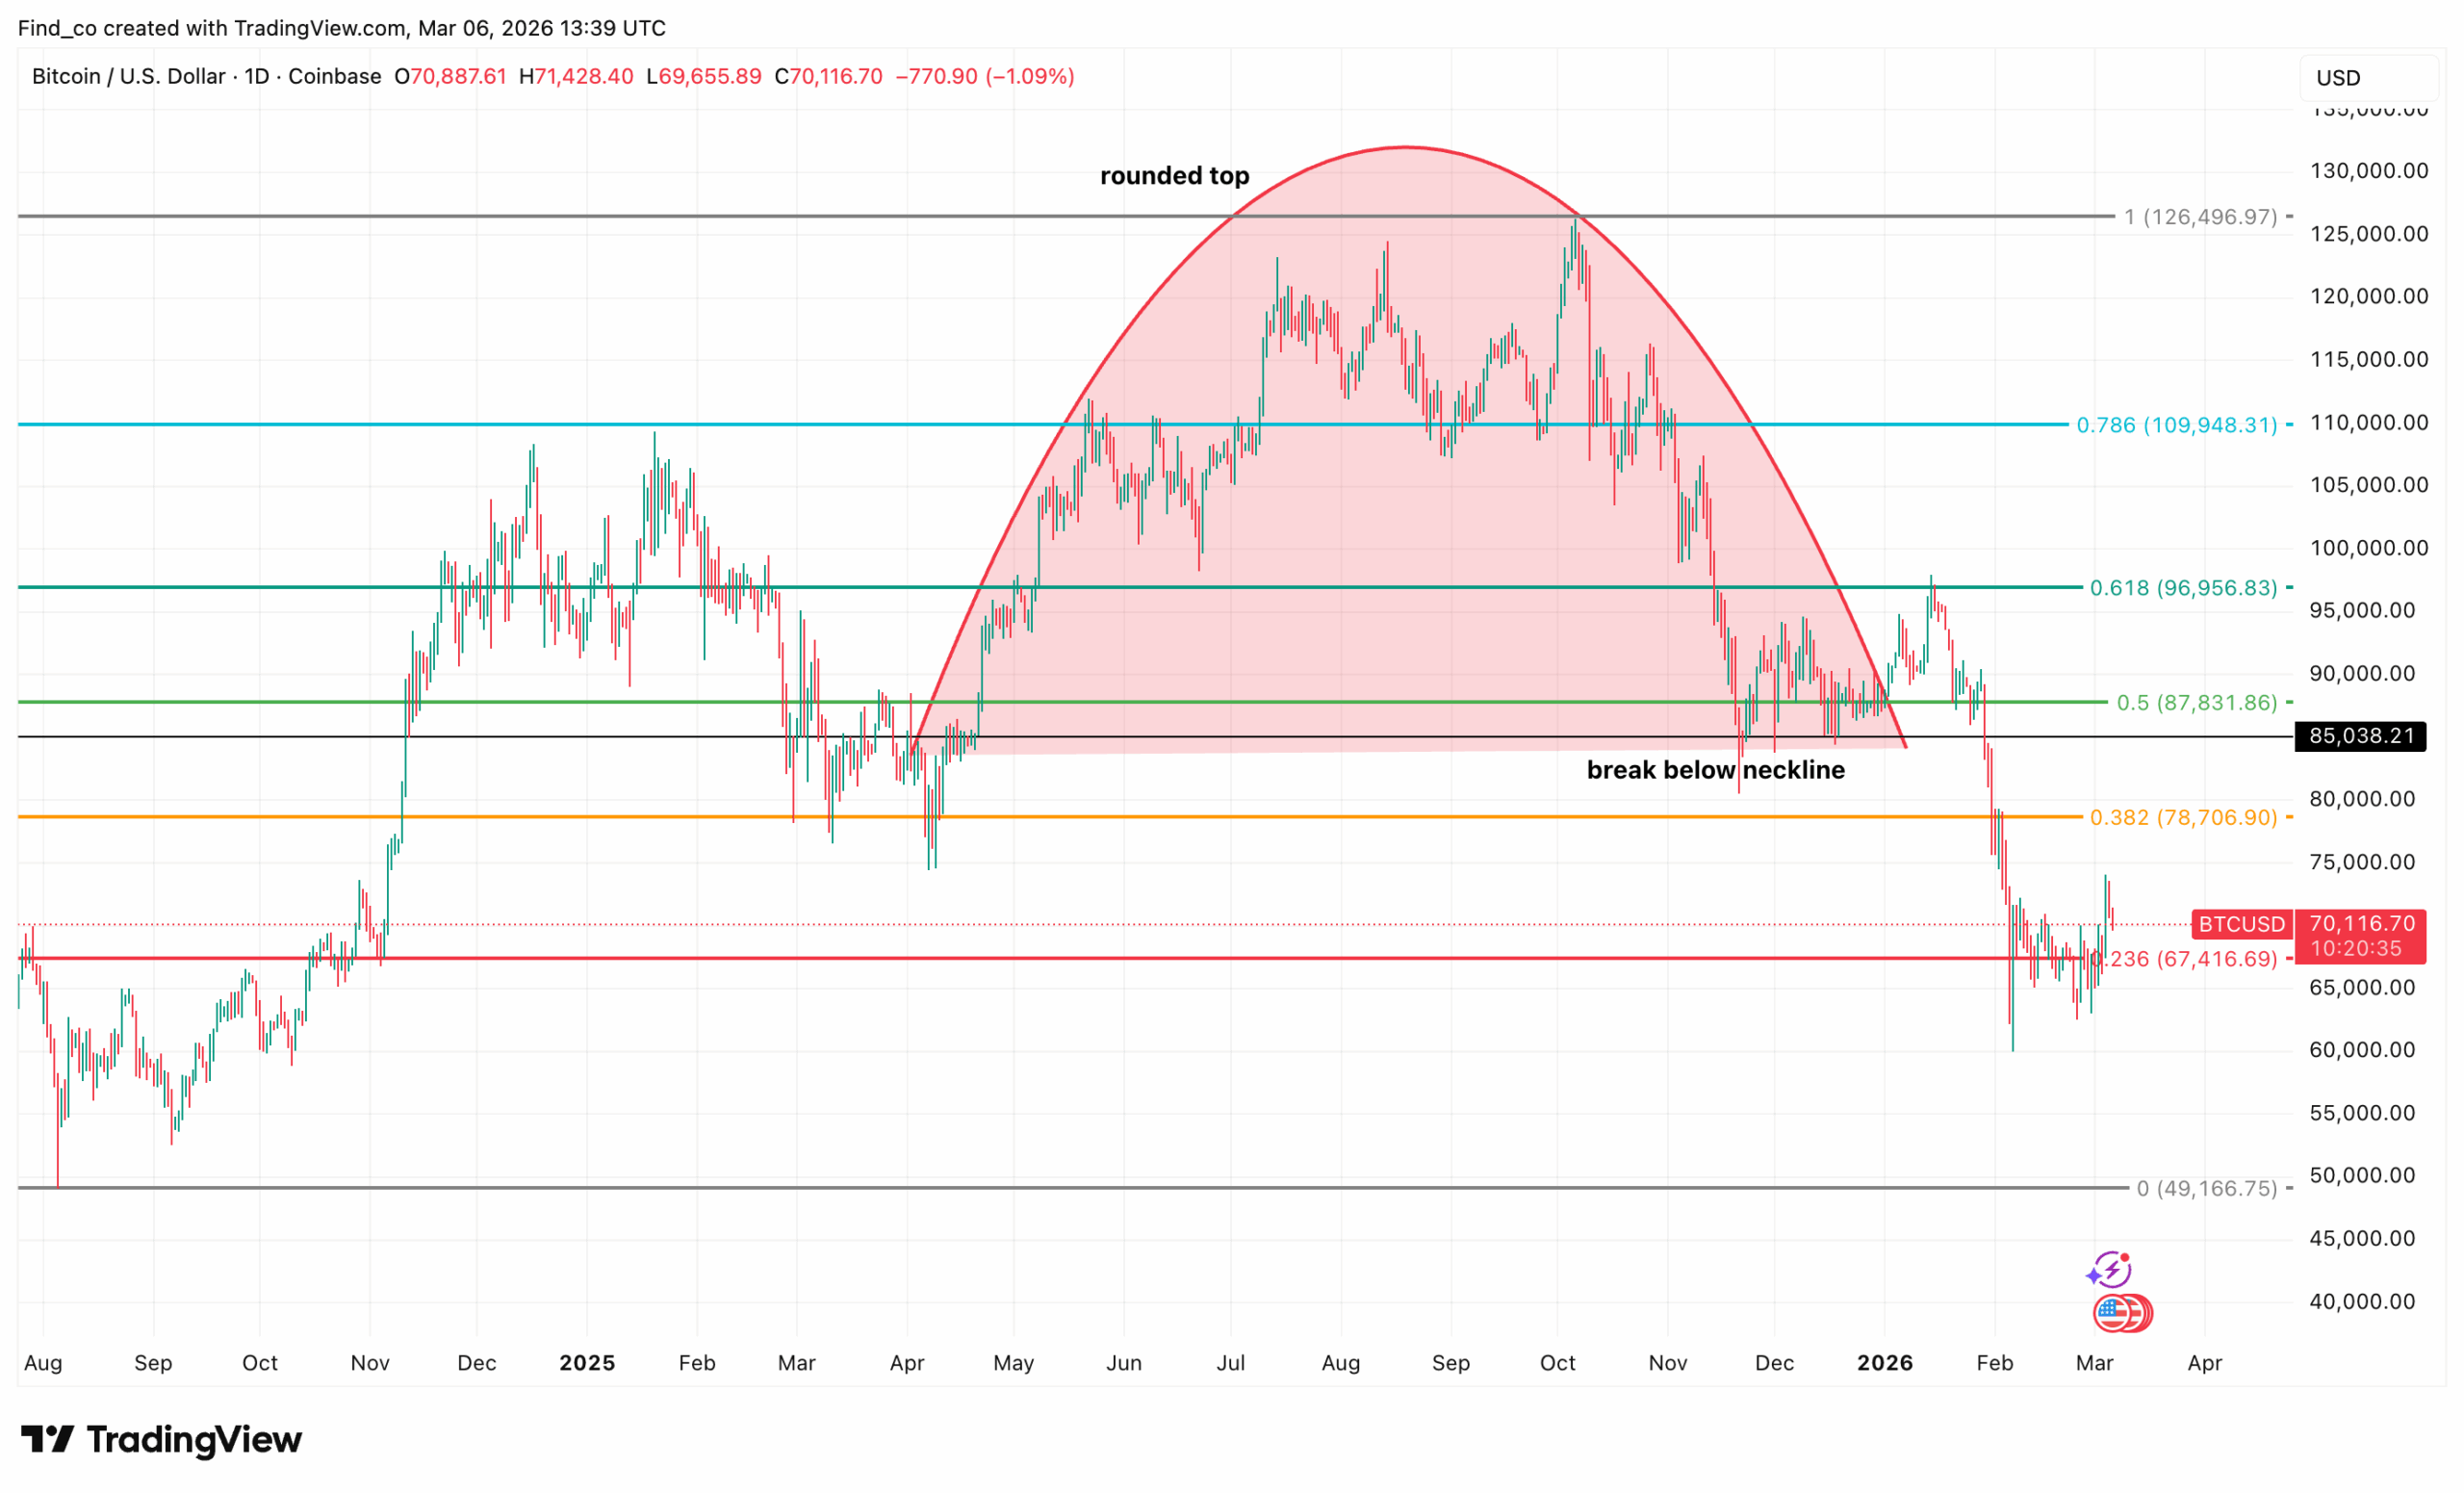
As shown below, Bitcoin’s price has formed a rounded top. Amid that, it has also broken below the key support neckline.
Three scenarios now emerge for Bitcoin in 2026 and beyond.
In the first scenario, Bitcoin could find support around the $60,000–$65,000 range, which aligns with the 2021 bull-market peak and represents a historically significant level. However, moving averages have to stabilize while volatility drops. Seasonal tailwinds in Q4 help propel a recovery back toward $100,000 and potentially beyond by late 2026 or 2027.
In the second scenario, Bitcoin’s price will likely trade between $50,000 and $85,000 over the next 12 to 18 months as the market digests prior gains. This mirrors the 2021 to 2022 period of sideways churn before the final capitulation. It would frustrate both bulls and bears equally.
In the third scenario, we could experience a deeper bear market. If this were to be the case, institutional selling might accelerate. As a result, Bitcoin’s price could break below the 200-MA and revisit the $40,000–$45,000 range. This would represent a full cycle correction of over 65% from the peak.
The data does not guarantee any single outcome. However, it does offer something valuable: context.
Bitcoin’s price has survived similar drawdowns before. Every time, the long-term trajectory eventually resumed its upward path.
That does not make future losses painless. But it does reinforce the case for informed, disciplined participation rather than panic.
Disclaimer:
The information provided in this article is for informational purposes only. It is not intended to be, nor should it be construed as, financial advice. We do not make any warranties regarding the completeness, reliability, or accuracy of this information. All investments involve risk, and past performance does not guarantee future results. We recommend consulting a financial advisor before making any investment decisions.
Victor Olanrewaju is a crypto analyst and reporter at CCN with deep roots in on-chain research and technical analysis. His crypto journey began in 2017, but it was the 2020 Uniswap airdrop that sparked a full-time pivot into the space.
With a foundation in copywriting, Victor honed his craft creating high-converting content for leading crypto brokers — most notably an XRP price prediction that ranked #1 on Google during the 2021 bull run.
He later joined AMBCrypto in 2022, where he combined storytelling with technical and on-chain analysis to cover key market narratives.
In 2024, he expanded his expertise at BeInCrypto, collaborating with analysts and using tools like Glassnode, Santiment, and IntoTheBlock to break down Bitcoin and altcoin trends.
At CCN, Victor covers the top cryptocurrencies, memecoins, macro shifts, blending real-time insights with deep-dive metrics.
He holds a Bachelor’s degree in Physics from the University of Ibadan, equipping him to simplify complex data for a wide audience. Follow his work or connect on LinkedIn or X.