BTC consolidates in a bearish pennant | Credit: Hameem Sarwar
Share
Key Takeaways
Bitcoin failed to hold above $70,000 despite softer CPI, reinforcing ongoing consolidation.
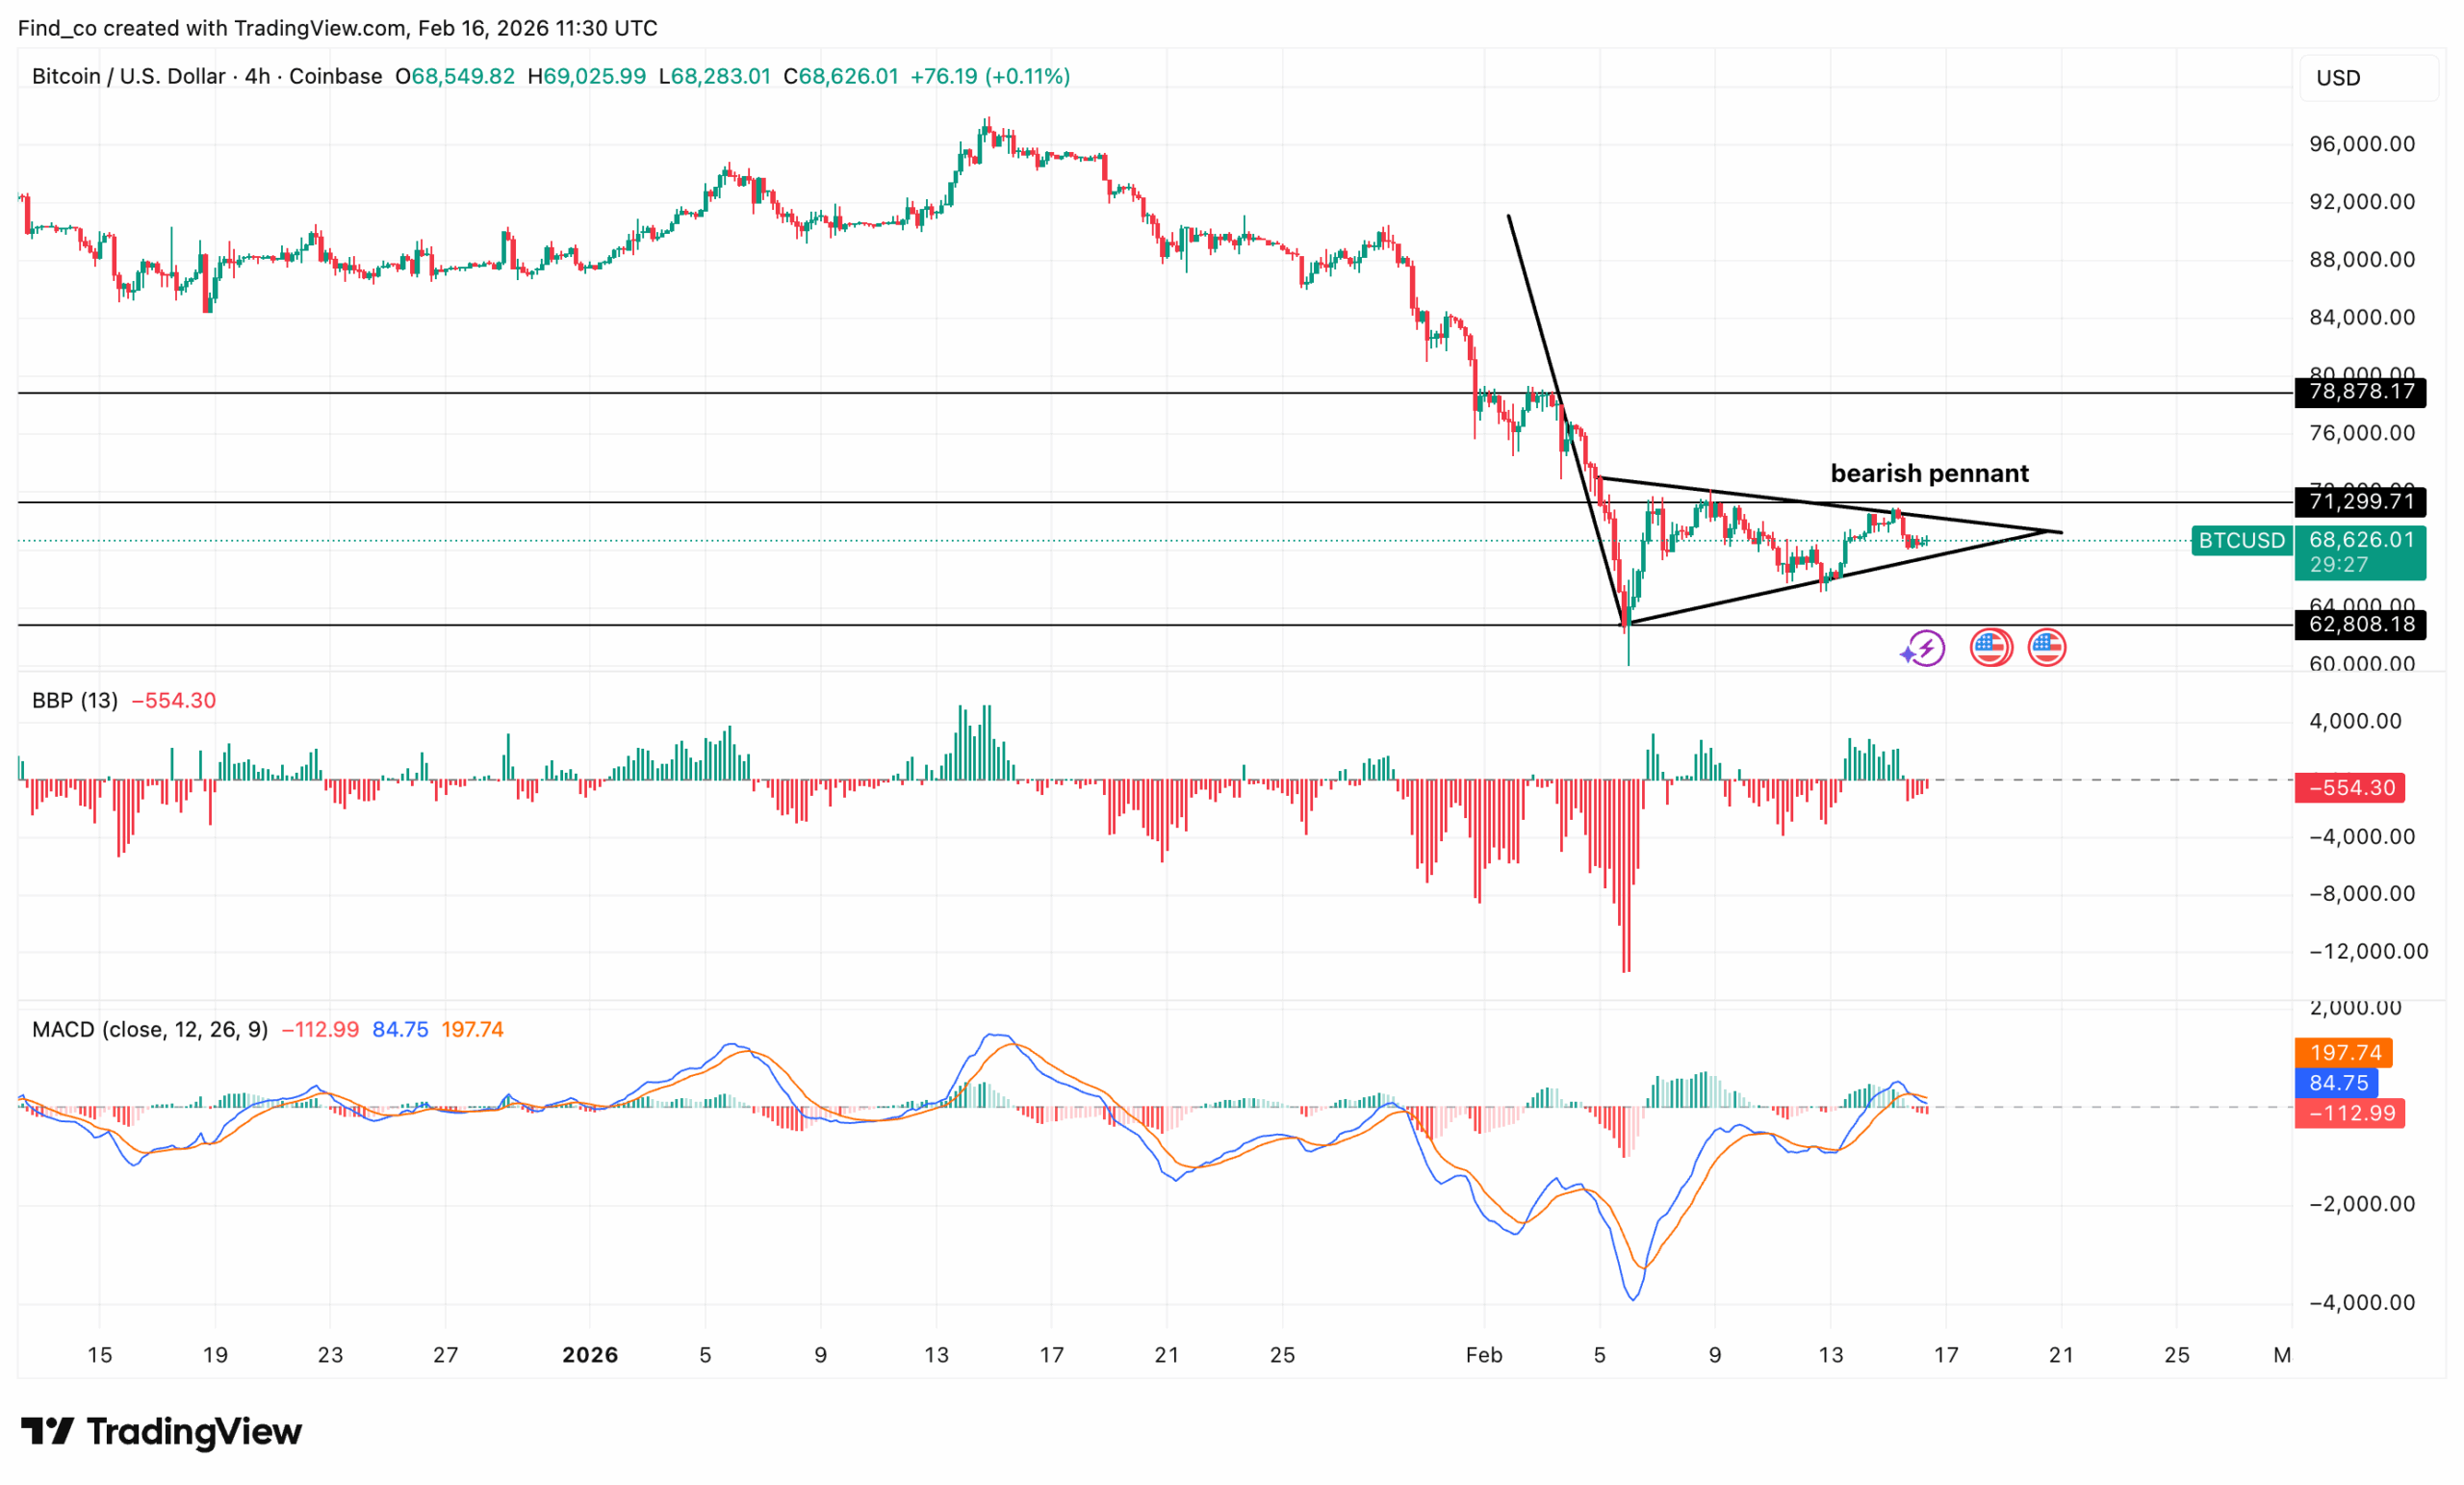
A bearish pennant on the 4-hour chart signals potential downtrend if $62,800 breaks.
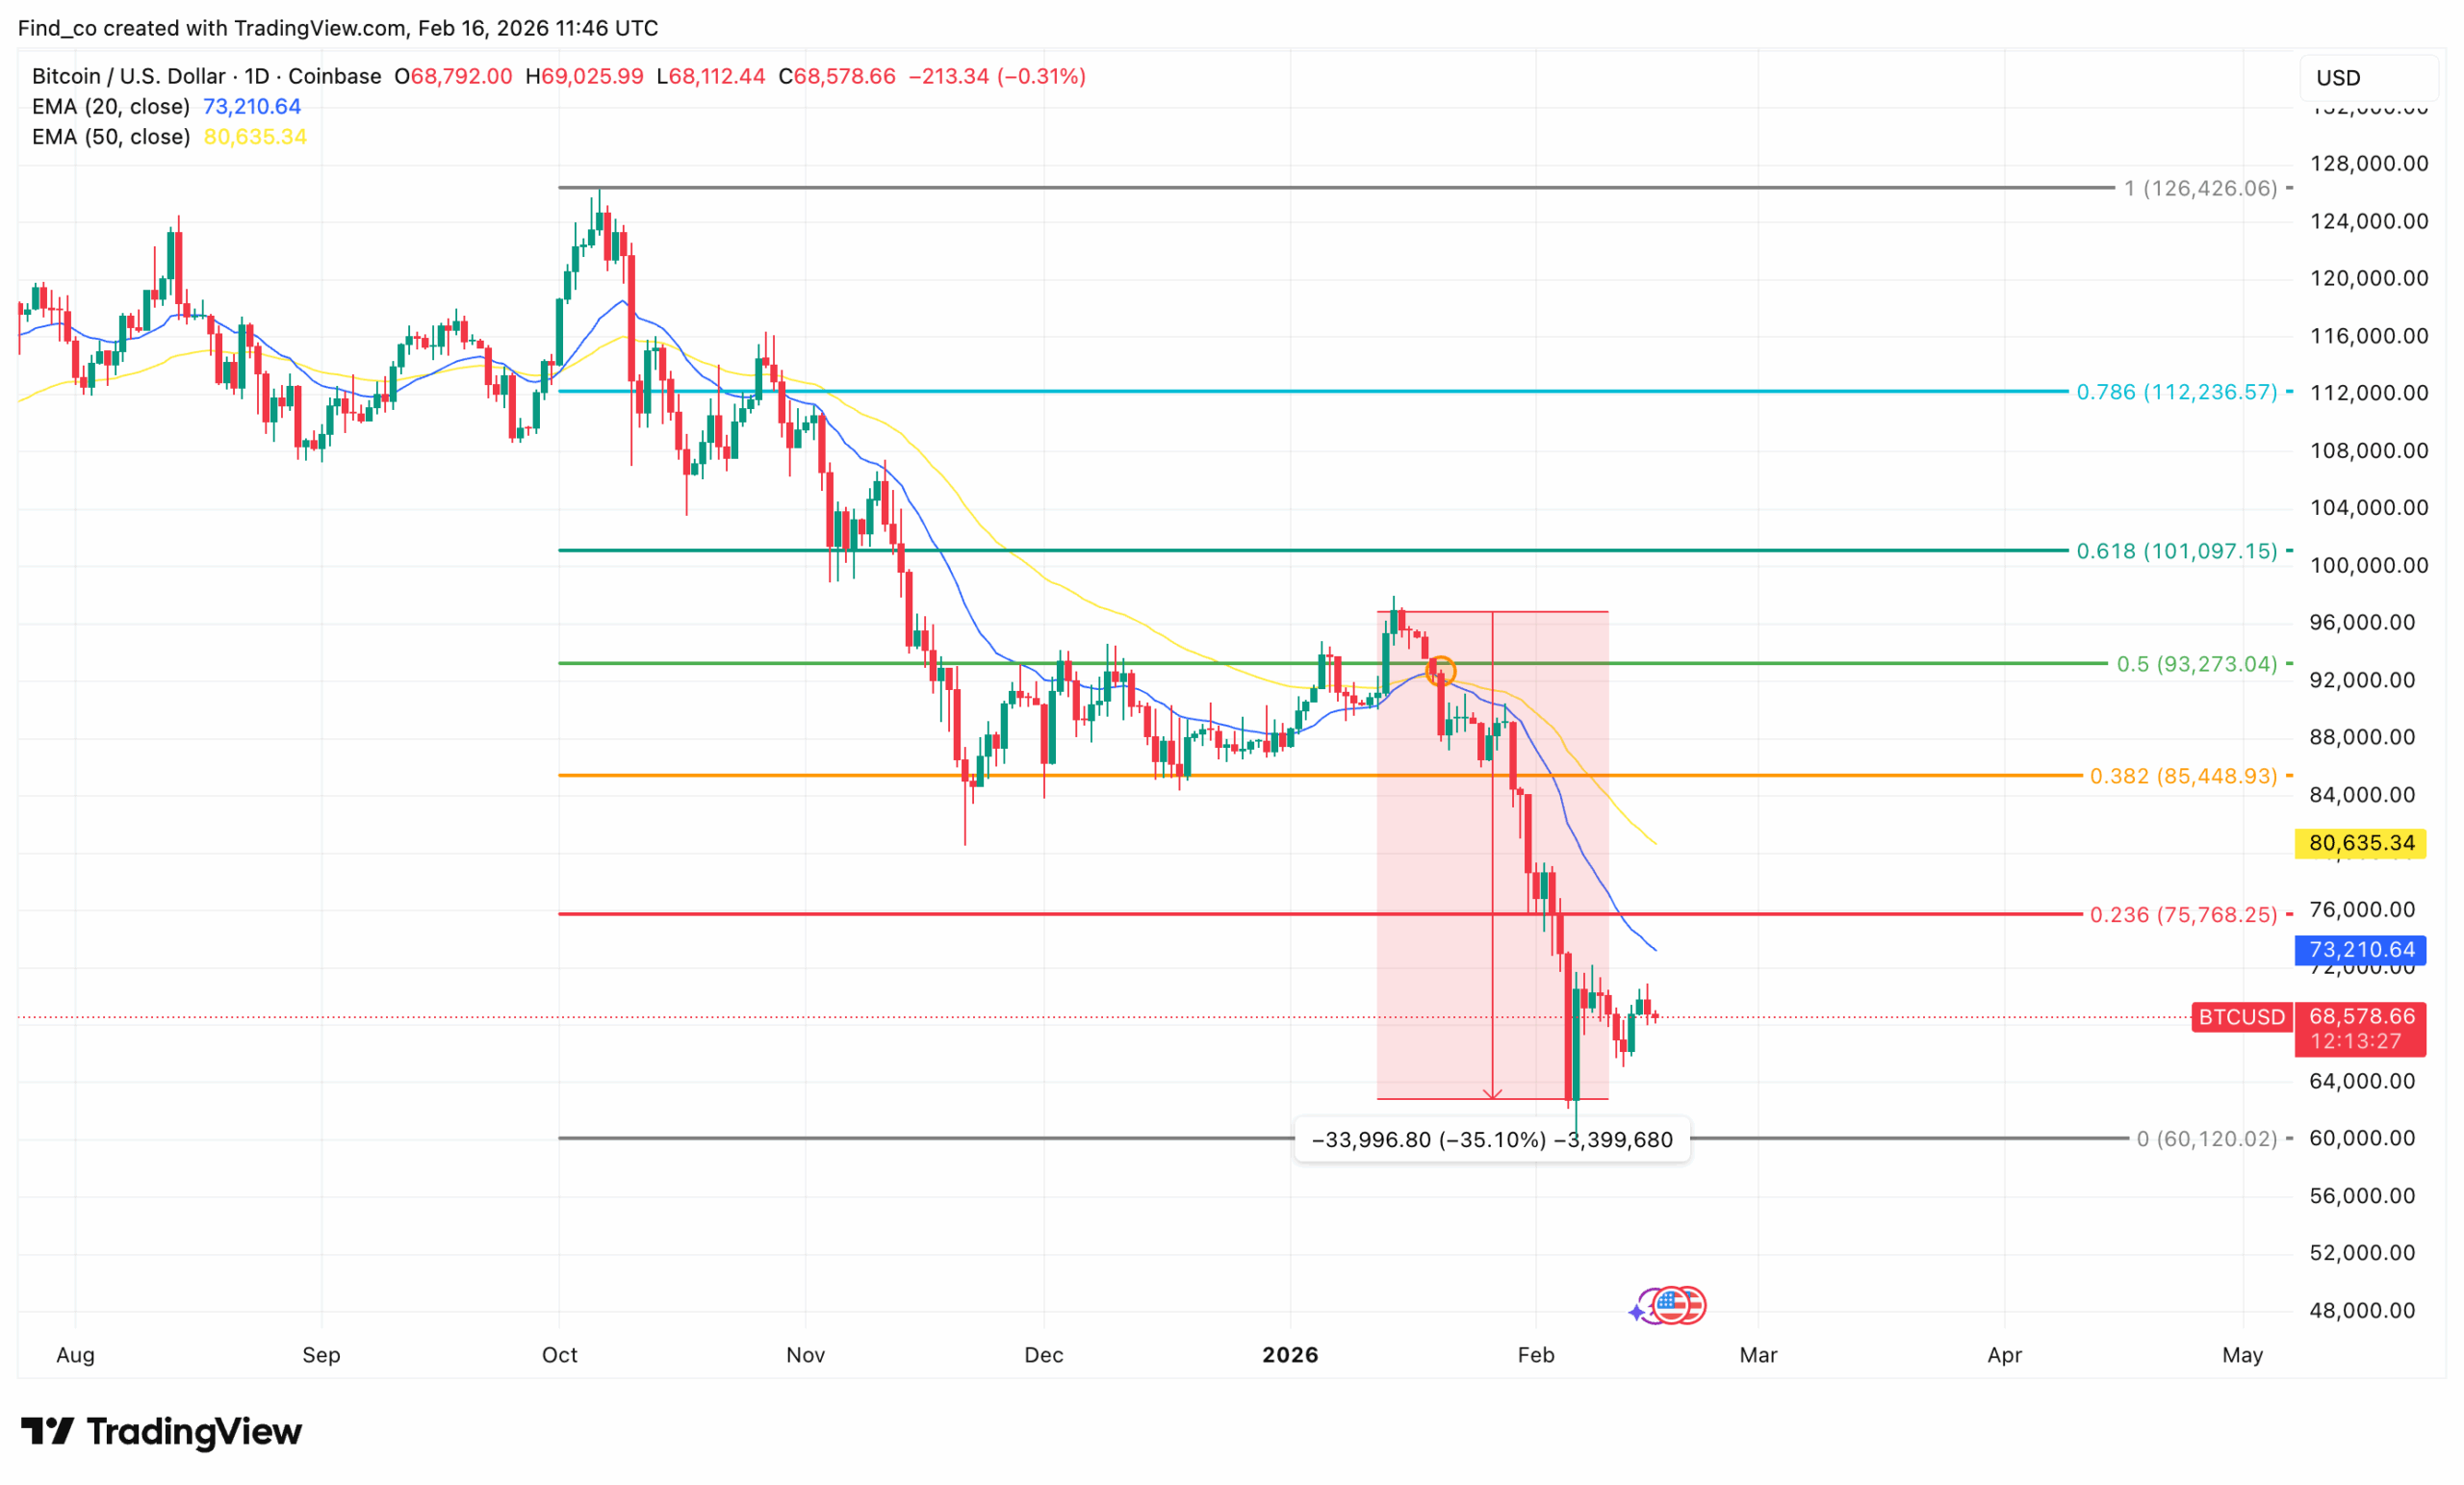
Daily structure remains bearish below the 20- and 50-day EMAs, which are sloping downward.
Bitcoin (BTC) is struggling to hold momentum after its brief weekend breakout above $70,000.
A softer-than-expected CPI print (2.4% vs. 2.5% forecast) initially sparked optimism, pushing BTC past the psychological threshold.
However, the move was quickly rejected. By the early hours of today, Bitcoin’s price had slipped back toward $68,400.
The failed hold above $70,000 reinforces the view that Bitcoin remains trapped in a consolidation rather than a confirmed new bull phase.
That said, here are the key levels that matter for the coin going forward.
Bitcoin Reverse Weekend Surge
On the 4-hour timeframe, Bitcoin’s price is consolidating after a sell-off inside what appears to be a bearish pennant formation.
The leg down from the $88,800 area into roughly $62,800 created the flagpole, and price has since been hovering between converging trendlines, forming lower highs and slightly higher lows.
This structure typically represents continuation pressure, especially when it forms after a strong downward move.
Furthermore, the horizontal levels are clearly defined. Resistance sits near $71,300, which aligns with the upper boundary of the pennant and a prior breakdown area.
Above that, the $78,800 region marks the next major supply zone from the earlier distribution range.
On the downside, $62,800 is the key support and the base of the recent flush. A breakdown below this level would confirm the pennant continuation and open the door for an extension lower.
At the time of writing, momentum indicators are not showing strong bullish signs. As shown below, the Moving Average Convergence Divergence (MACD) has rebounded from deeply negative territory.
However, the histogram is flattening, and momentum is dropping as the BTC price declines.
Furthermore, the Bull Bear Power (BBP) also remains mostly negative, suggesting bears still have underlying control despite the bounce.
However, if bulls manage to invalidate the pennant with a strong breakout above $71,300 and hold that level, the pattern would fail, and short covering could push the price toward 78,800.
Falling Inflow, More Problems
Macro and institutional flows remain mixed. In the meantime, MicroStrategy added another 1,100 BTC despite reporting a $12.4 billion Q4 loss, signaling continued long-term conviction.
Meanwhile, the nomination of hawkish Fed Chair Kevin Warsh keeps the dollar firm, pressuring risk assets.
Although the softer CPI print slightly improved April rate-cut odds to 23%, it hasn’t yet shifted institutional positioning. U.S. spot ETFs recorded $410 million in outflows last Thursday, confirming that institutional capital has yet to return.
BTC Price Outlook: Coin to Consolidate
On the daily timeframe, Bitcoin’s price has confirmed a clear rejection from the 0.5 Fibonacci level around $93,273.
It has since broken down aggressively through the 0.382 at $85,448 and the $0.236 at 75,768.
That rejection marked the transition from a corrective bounce to a continuation lower, and the move that followed wiped out roughly 35% of the local high, bringing it into the $60,100 region.
At the time of writing, BTC is trading well below both the 20-day EMA near $73,200 and the 50-day EMA near $80,600.
The EMAs are sloping downward and widening, which reflects strong downside momentum and sustained selling pressure.
Until Bitcoin’s price can reclaim at least the 20-day EMA and hold above it, rallies are likely to be fakeouts.
In addition, the $60,120 zone remains the key support, as it marks the swing low and the zero Fibonacci anchor from the broader move.
Victor Olanrewaju is a crypto analyst and reporter at CCN with deep roots in on-chain research and technical analysis. His crypto journey began in 2017, but it was the 2020 Uniswap airdrop that sparked a full-time pivot into the space.
With a foundation in copywriting, Victor honed his craft creating high-converting content for leading crypto brokers — most notably an XRP price prediction that ranked #1 on Google during the 2021 bull run.
He later joined AMBCrypto in 2022, where he combined storytelling with technical and on-chain analysis to cover key market narratives.
In 2024, he expanded his expertise at BeInCrypto, collaborating with analysts and using tools like Glassnode, Santiment, and IntoTheBlock to break down Bitcoin and altcoin trends.
At CCN, Victor covers the top cryptocurrencies, memecoins, macro shifts, blending real-time insights with deep-dive metrics.
He holds a Bachelor’s degree in Physics from the University of Ibadan, equipping him to simplify complex data for a wide audience. Follow his work or connect on LinkedIn or X.