The next $2,000 move is critical for Bitcoin | Credit: TradingView
Share
Key Takeaways
BTC is positioned at a point where more than $1.22 billion in long positions are at risk of liquidation.
A dense cluster of high-leverage long positions is concentrated between $63,000 and $66,000.
Critical support is identified at $66,296, as losing this level would likely shift control back to the bears.
Bitcoin’s (BTC) price has dropped below$68,00, and the derivatives market is flashing a serious warning.
Liquidation heatmap data shows that more than $1.22 billion in leveraged long positions are clustered between the current price and the psychologically critical $60,000 level.
If Bitcoin’s price reaches that threshold, the resulting cascade of forced closures could accelerate the move lower.
The question every trader is asking right now is simple: Will Bitcoin price get there?
Bitcoin Flashes Warning for Longs
At the time of writing, the liquidation map reveals a heavily loaded battlefield, and Bitcoin’s price sits right in the middle of it.
BTC trades at $67,819. In recent days, the value of liquidations for longs or shorts has declined.
However, if the crypto’s market value drops to $60,179, $1.22 billion in cumulative long positions will be liquidated.
As seen below, a dense cluster of long liquidations stacks up between $63,000 and $66,000, with 50x and 100x leveraged longs concentrated there.
Further, a move down through that zone would trigger cascading forced liquidations, accelerating any selloff.
To the upside, the picture flips. Short liquidations build steadily from $68,500 onward, with the cumulative liquidation curve (green) rising from $70,000 to $74,000.
As it stands, a push through $68,500 would begin forcing short sellers to cover, creating buy pressure that could fuel a squeeze toward $70,000 and beyond.
But given the current Bitcoin price action, a short-term breakout to the upside might not occur.
What Else to Watch
Meanwhile, the liquidation heatmap from Feb. 25 to 27 tells a story of a market that lunged higher, only to be pulled back.
From the image below, a massive wall of red and orange horizontal lines (open long positions) stretches from $63,000 up to the current BTC price.
This represents hundreds of millions in leveraged longs that were opened as the price climbed toward $70,000 on Feb. 26. For context, those positions are now underwater and vulnerable.
Just above the current Bitcoin price, a dense band of cyan and teal stacks up from $68,000 to $70,000.
These are open short positions. But if price pushes back above $68,500, forced short covering begins and the squeeze fires.
The green lines extending to $71,000 represent larger short positions opened at higher levels.
For context, these are the deeper pockets. Liquidating them would require a sustained move through $70,000.
Below the market, the red-to-purple gradient thickens dramatically below $65,000.
Looking closely, the large purple circles signaling open interest at extreme leverage sit near $63,000.
Therefore, a breakdown of $65,000 triggers a cascade that accelerates fast.
In conclusion, the next $2,000 move in either direction will determine which side gets liquidated first.
BTC Price Forecast: Drop Below $60K?
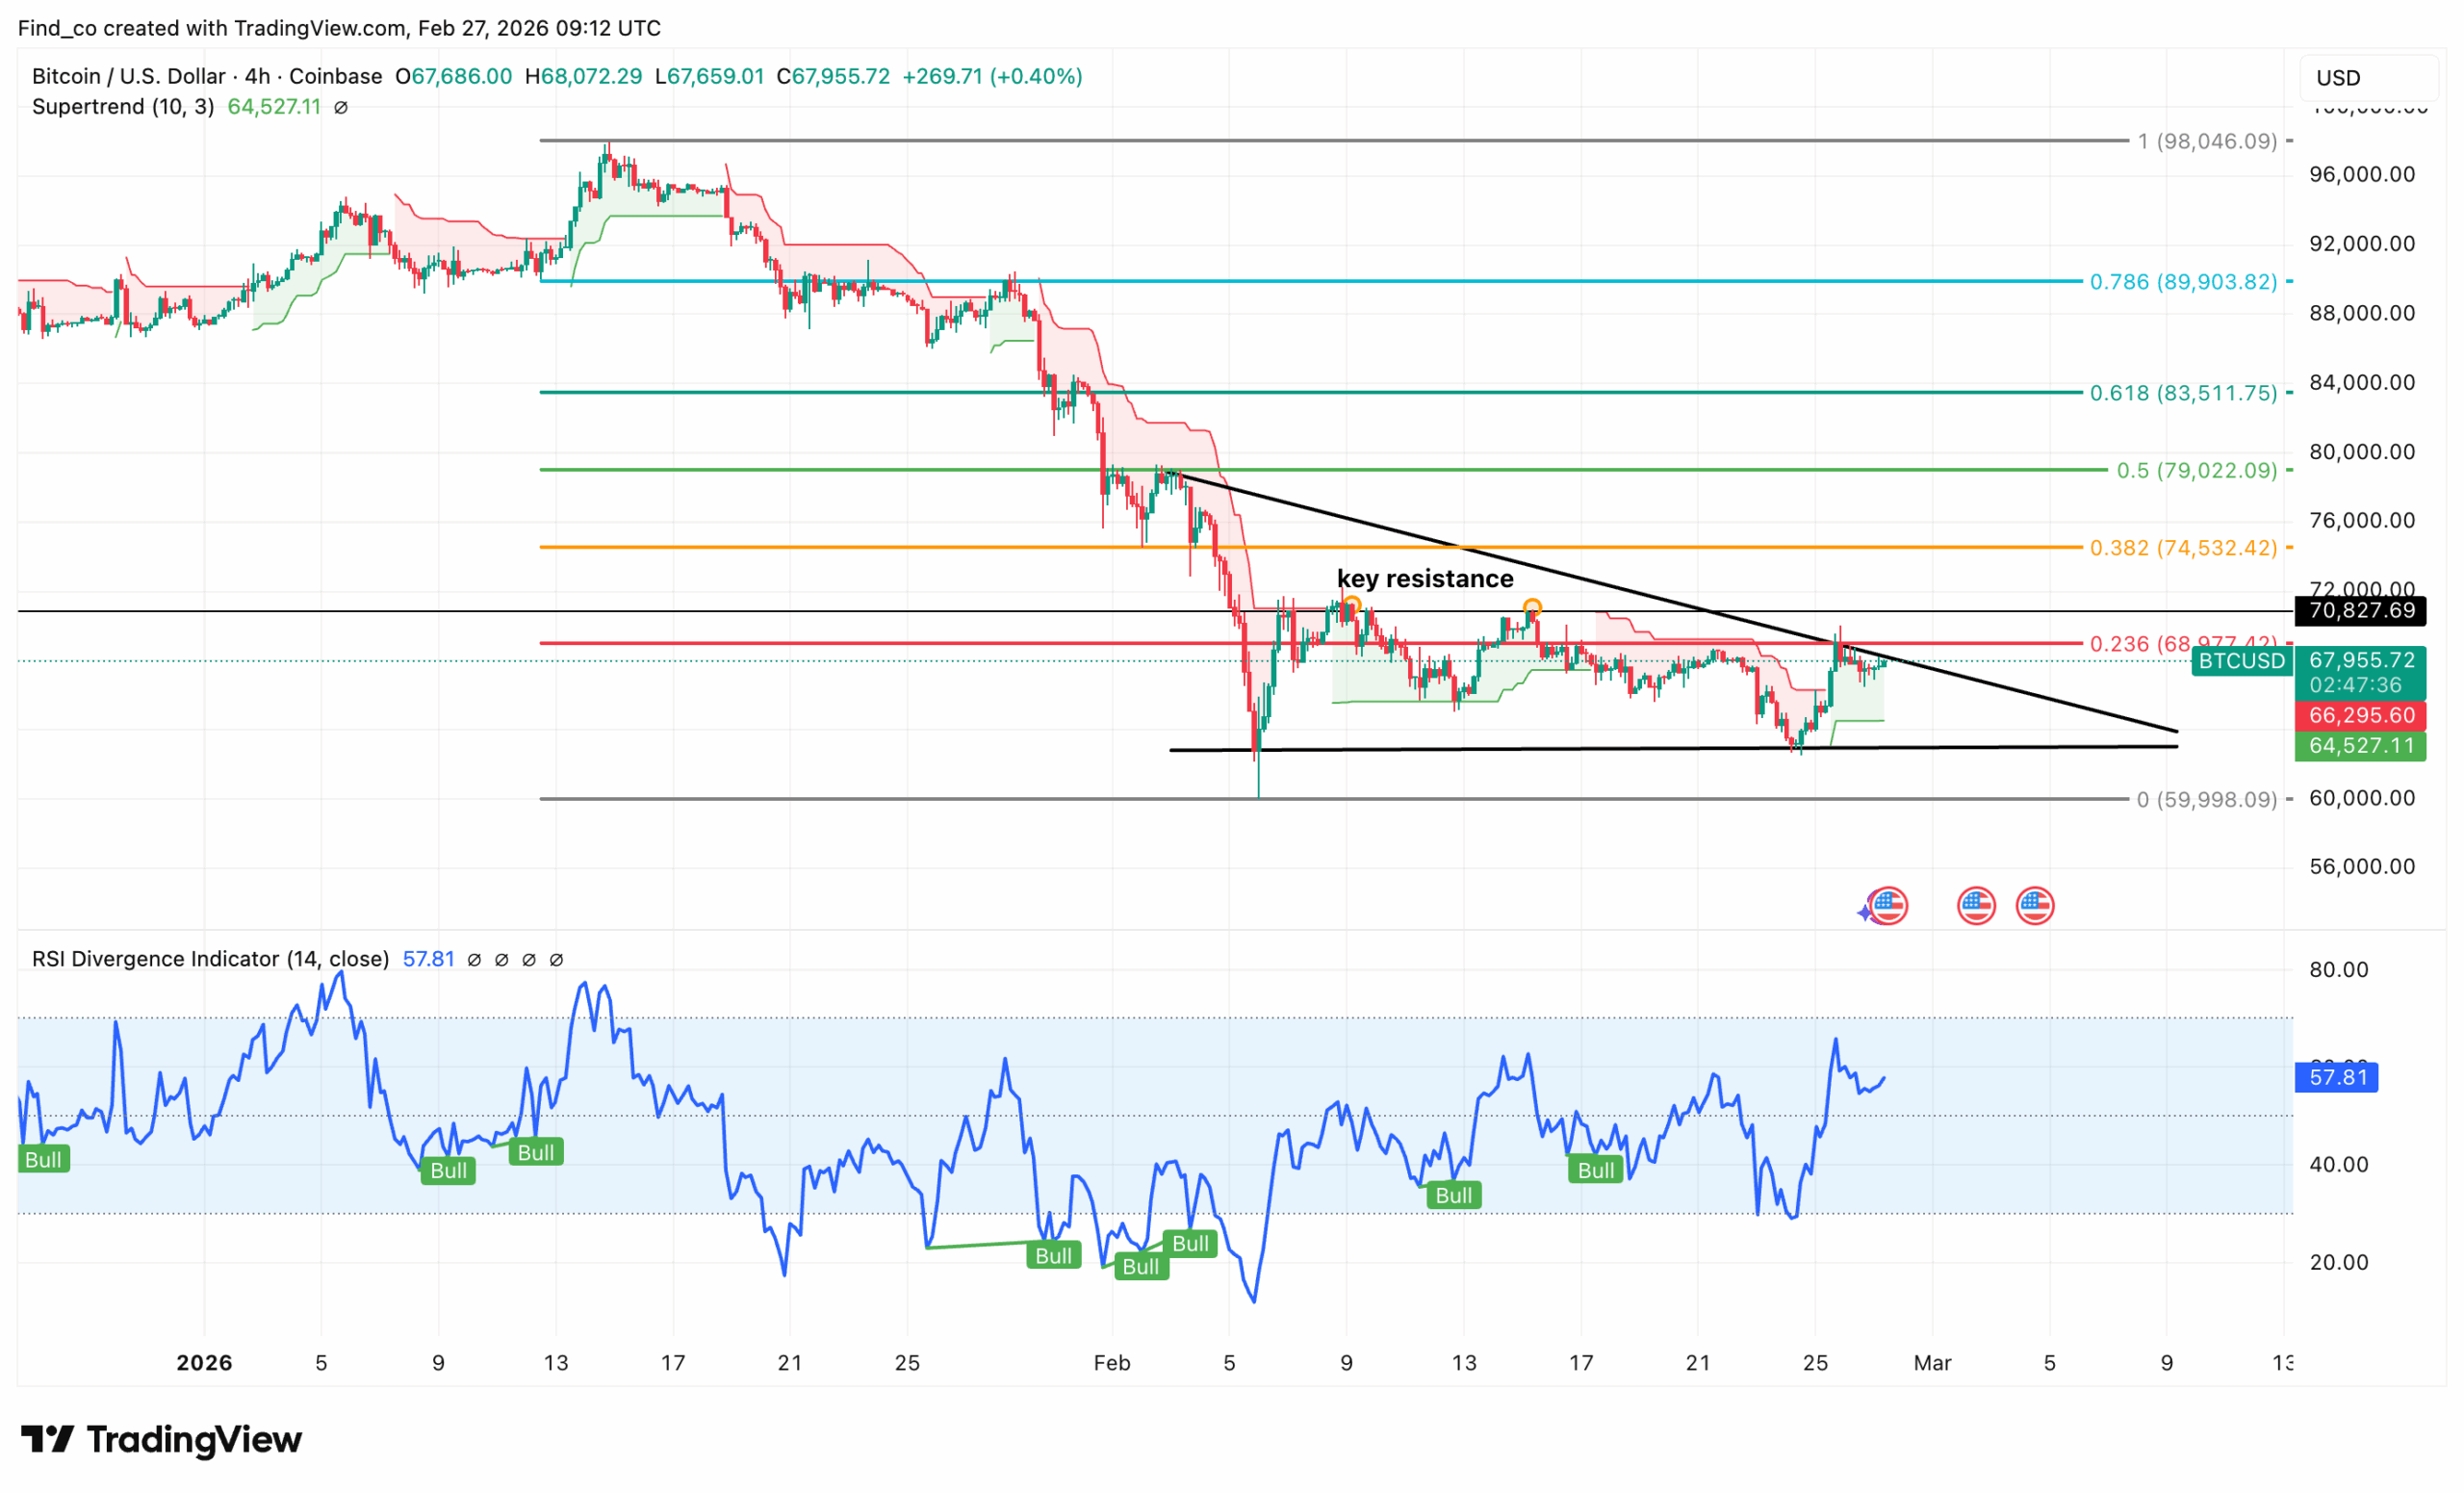
From a technical standpoint, Bitcoin’s price is coiling at a critical juncture.
The structure is clear. After the January high near $98,000, BTC carved out a descending channel, with each rally attempt capped by the falling trendline.
That trendline now converges with the 0.236 Fibonacci level at $68,027. Furthermore, the annotated key resistance sits at $70,828, where two prior rally attempts failed in February.
Besides that, the RSI Divergence indicator is the most bullish element here. It has fired seven consecutive bull divergence signals since late January.
Every time Bitcoin’s price made a lower low, RSI held higher. That sustained divergence pattern has historically preceded the strongest recoveries on this chart.
RSI currently reads 57.79, above the midpoint and rising. It has recovered from the low-20s seen in early February without entering overbought territory.
The Supertrend (10, 3) sits at $64,527, well below the current price and beginning to flatten.
However, the descending channel breakout is the trigger to watch.
Disclaimer:
The information provided in this article is for informational purposes only. It is not intended to be, nor should it be construed as, financial advice. We do not make any warranties regarding the completeness, reliability, or accuracy of this information. All investments involve risk, and past performance does not guarantee future results. We recommend consulting a financial advisor before making any investment decisions.
Victor Olanrewaju is a crypto analyst and reporter at CCN with deep roots in on-chain research and technical analysis. His crypto journey began in 2017, but it was the 2020 Uniswap airdrop that sparked a full-time pivot into the space.
With a foundation in copywriting, Victor honed his craft creating high-converting content for leading crypto brokers — most notably an XRP price prediction that ranked #1 on Google during the 2021 bull run.
He later joined AMBCrypto in 2022, where he combined storytelling with technical and on-chain analysis to cover key market narratives.
In 2024, he expanded his expertise at BeInCrypto, collaborating with analysts and using tools like Glassnode, Santiment, and IntoTheBlock to break down Bitcoin and altcoin trends.
At CCN, Victor covers the top cryptocurrencies, memecoins, macro shifts, blending real-time insights with deep-dive metrics.
He holds a Bachelor’s degree in Physics from the University of Ibadan, equipping him to simplify complex data for a wide audience. Follow his work or connect on LinkedIn or X.