Bitcoin doesn’t trade on 20M coins, but just on 3M available on exchanges. Here’s how marginal supply and spot demand really drive BTC price. | Credit: CCN.com
Share
Key Takeaways
Bitcoin fell below $65,000 earlier today, driven by fresh nervousness over US tariffs.
Negative sentiment spiked, while the BTC OI dropped nearly half of its 2026 peak.
Short-term holders continue to see losses, but Bitcoin’s price shows signs of a rebound.
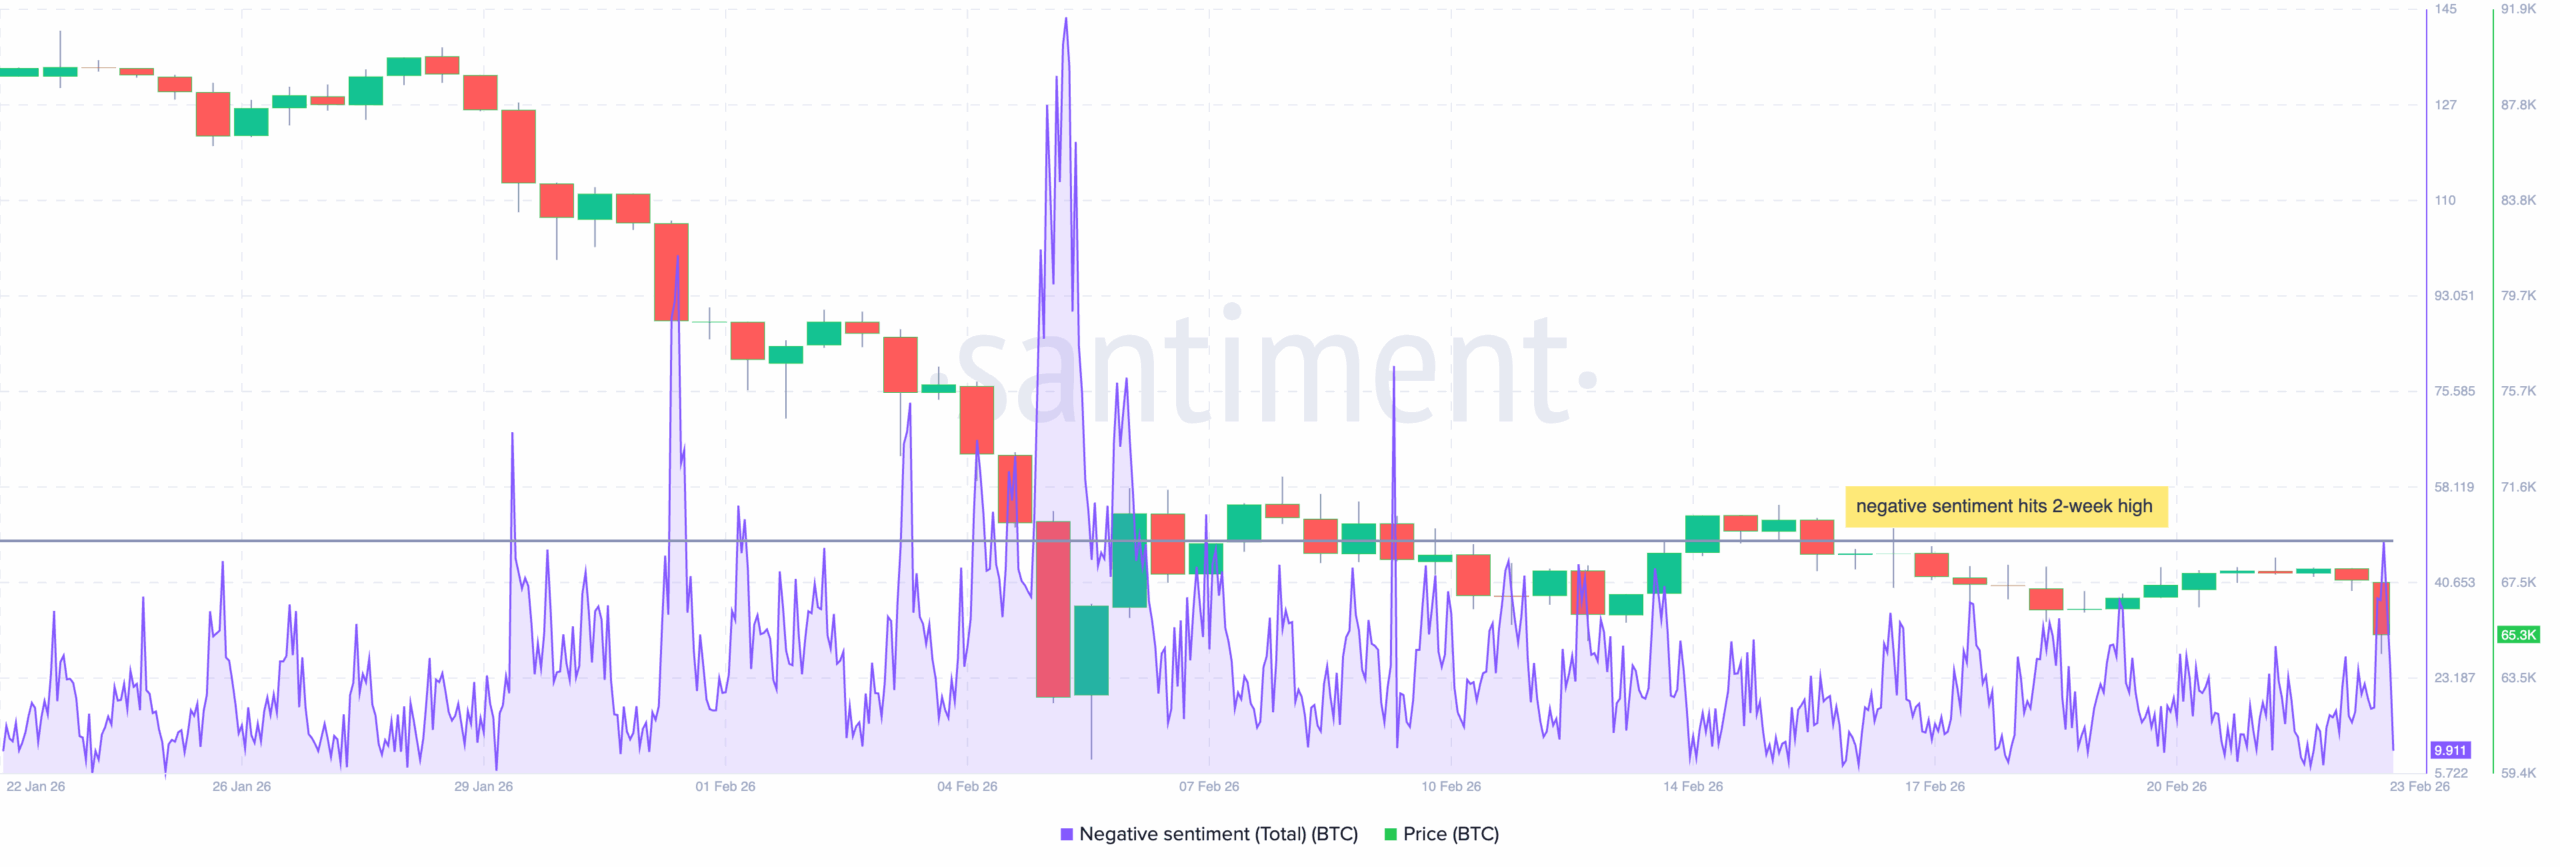
Bitcoin (BTC) sentiment just hit its worst level in two weeks. This happened after BTC lost 4.5% of its value within two hours, and briefly dropped below $65,000 in early Asian trading on Monday.
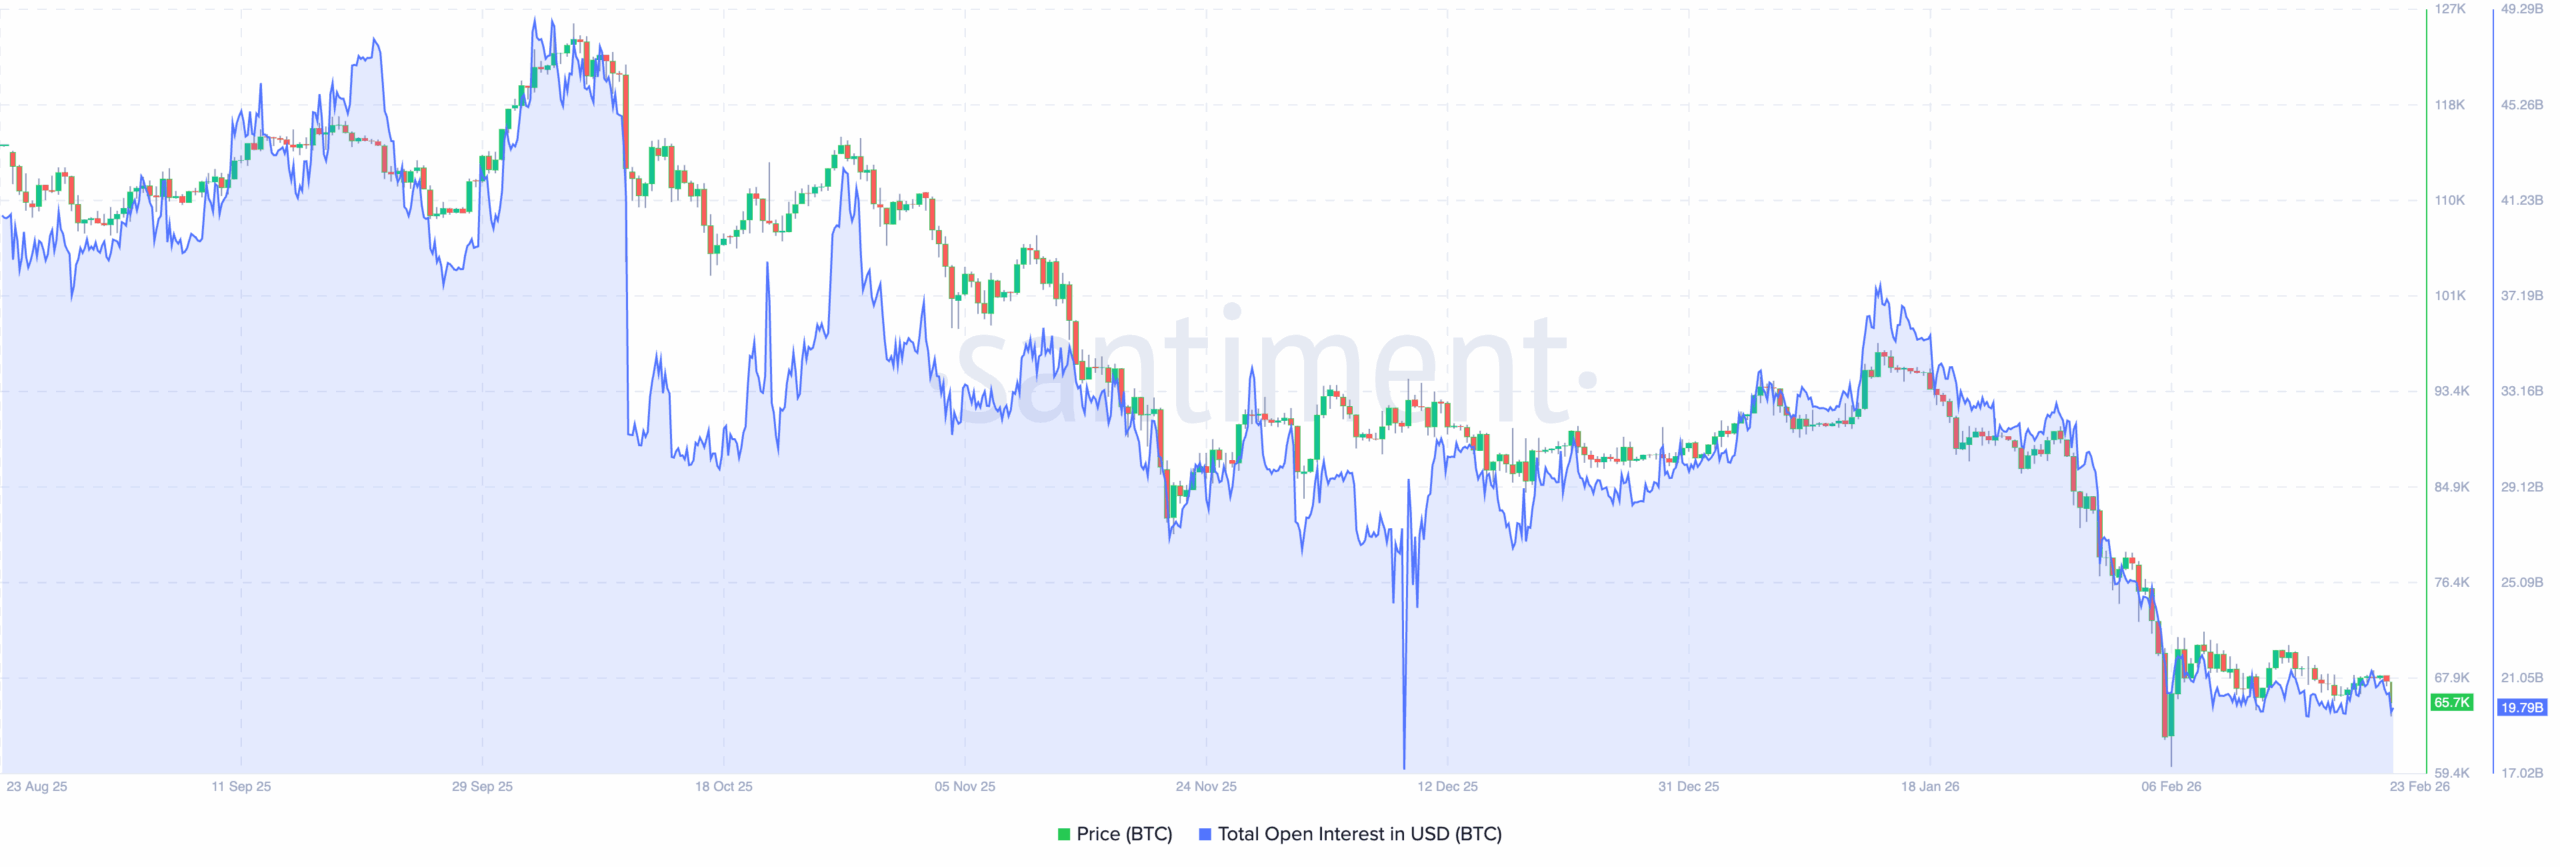
At the same time, futures Open Interest (OI) collapsed to $19.54 billion, down 45% from its peak above $90 billion in early October 2025.
This combination of fear and deleveraging tells a critical story about where Bitcoin’s price might be headed next.
Contrary to the panic, it might actually signal that the BTC could experience a notable rebound in the coming days.
Bitcoin Sentiment Deteriorates After $65K Break
Bitcoin briefly slid below $65,000 on Monday morning, driven by renewed uncertainty over U.S. tariff policy and broader risk-off sentiment across global markets.
It also appears that instability in Mexico, where the U.S. seemed to have a hand in taking down cartel leader El Mencho, affected the market.
The drop instantly reignited fear among traders, pushing the negative sentiment to the highest level in nearly 15 days.
This shift reflects renewed anxiety that Bitcoin’s recovery from the February 6 crash may be failing.
Open Interest Collapses 50% From Peak
While sentiment deteriorated, the OI continued its dramatic decline. Open interest, which measures the total value of active futures positions, fell from roughly $38 billion a month ago to about $19.67 billion as of today, marking a 50% decline.
This symmetry with Bitcoin’s own price decline is crucial. BTC has also fallen by a similar magnitude over the same period, suggesting that leverage has been reduced alongside price rather than driving a disorderly unwind.
This is actually good news. When open interest crashes alongside price, it signals that overleveraged positions have already been flushed out.
There are fewer forced sellers left in the market. Despite that, data from Coinglass still shows that liquidations were high.
Over the last 24 hours, more than $217 million in BTC liquidations have occurred, with most involving longs.
However, this does not imply that Bitcoin’s price will undergo another double-digit correction.
What History Says
Bitcoin’s current setup mirrors previous market bottoms in important ways.
Past extreme highs in negative sentiment led to gradual uptrends that eventually culminated in rebounds.
Meanwhile, the collapse in open interest suggests meaningful deleveraging without full capitulation.
VanEck noted in early February that while leverage has been reduced significantly, the BTC price action has remained orderly rather than disorderly.
“Bitcoin is at an unprecedented distance from its long-term trend, reinforcing the view that price has become statistically disconnected from underlying trend dynamics,” Matthew Sigel, Head of Digital Assets Research at the firm, noted.
However, risks remain. Bitcoin’s price is now trading below its 365-day moving average for the first time since March 2022 and has declined 23% in the 83 days since the breakdown, worse than the early 2022 bear phase.
Institutional demand has also reversed materially, with U.S. exchange-traded funds that purchased 46,000 BTC this time last year now net sellers in 2026.
More Losses, No Bottom
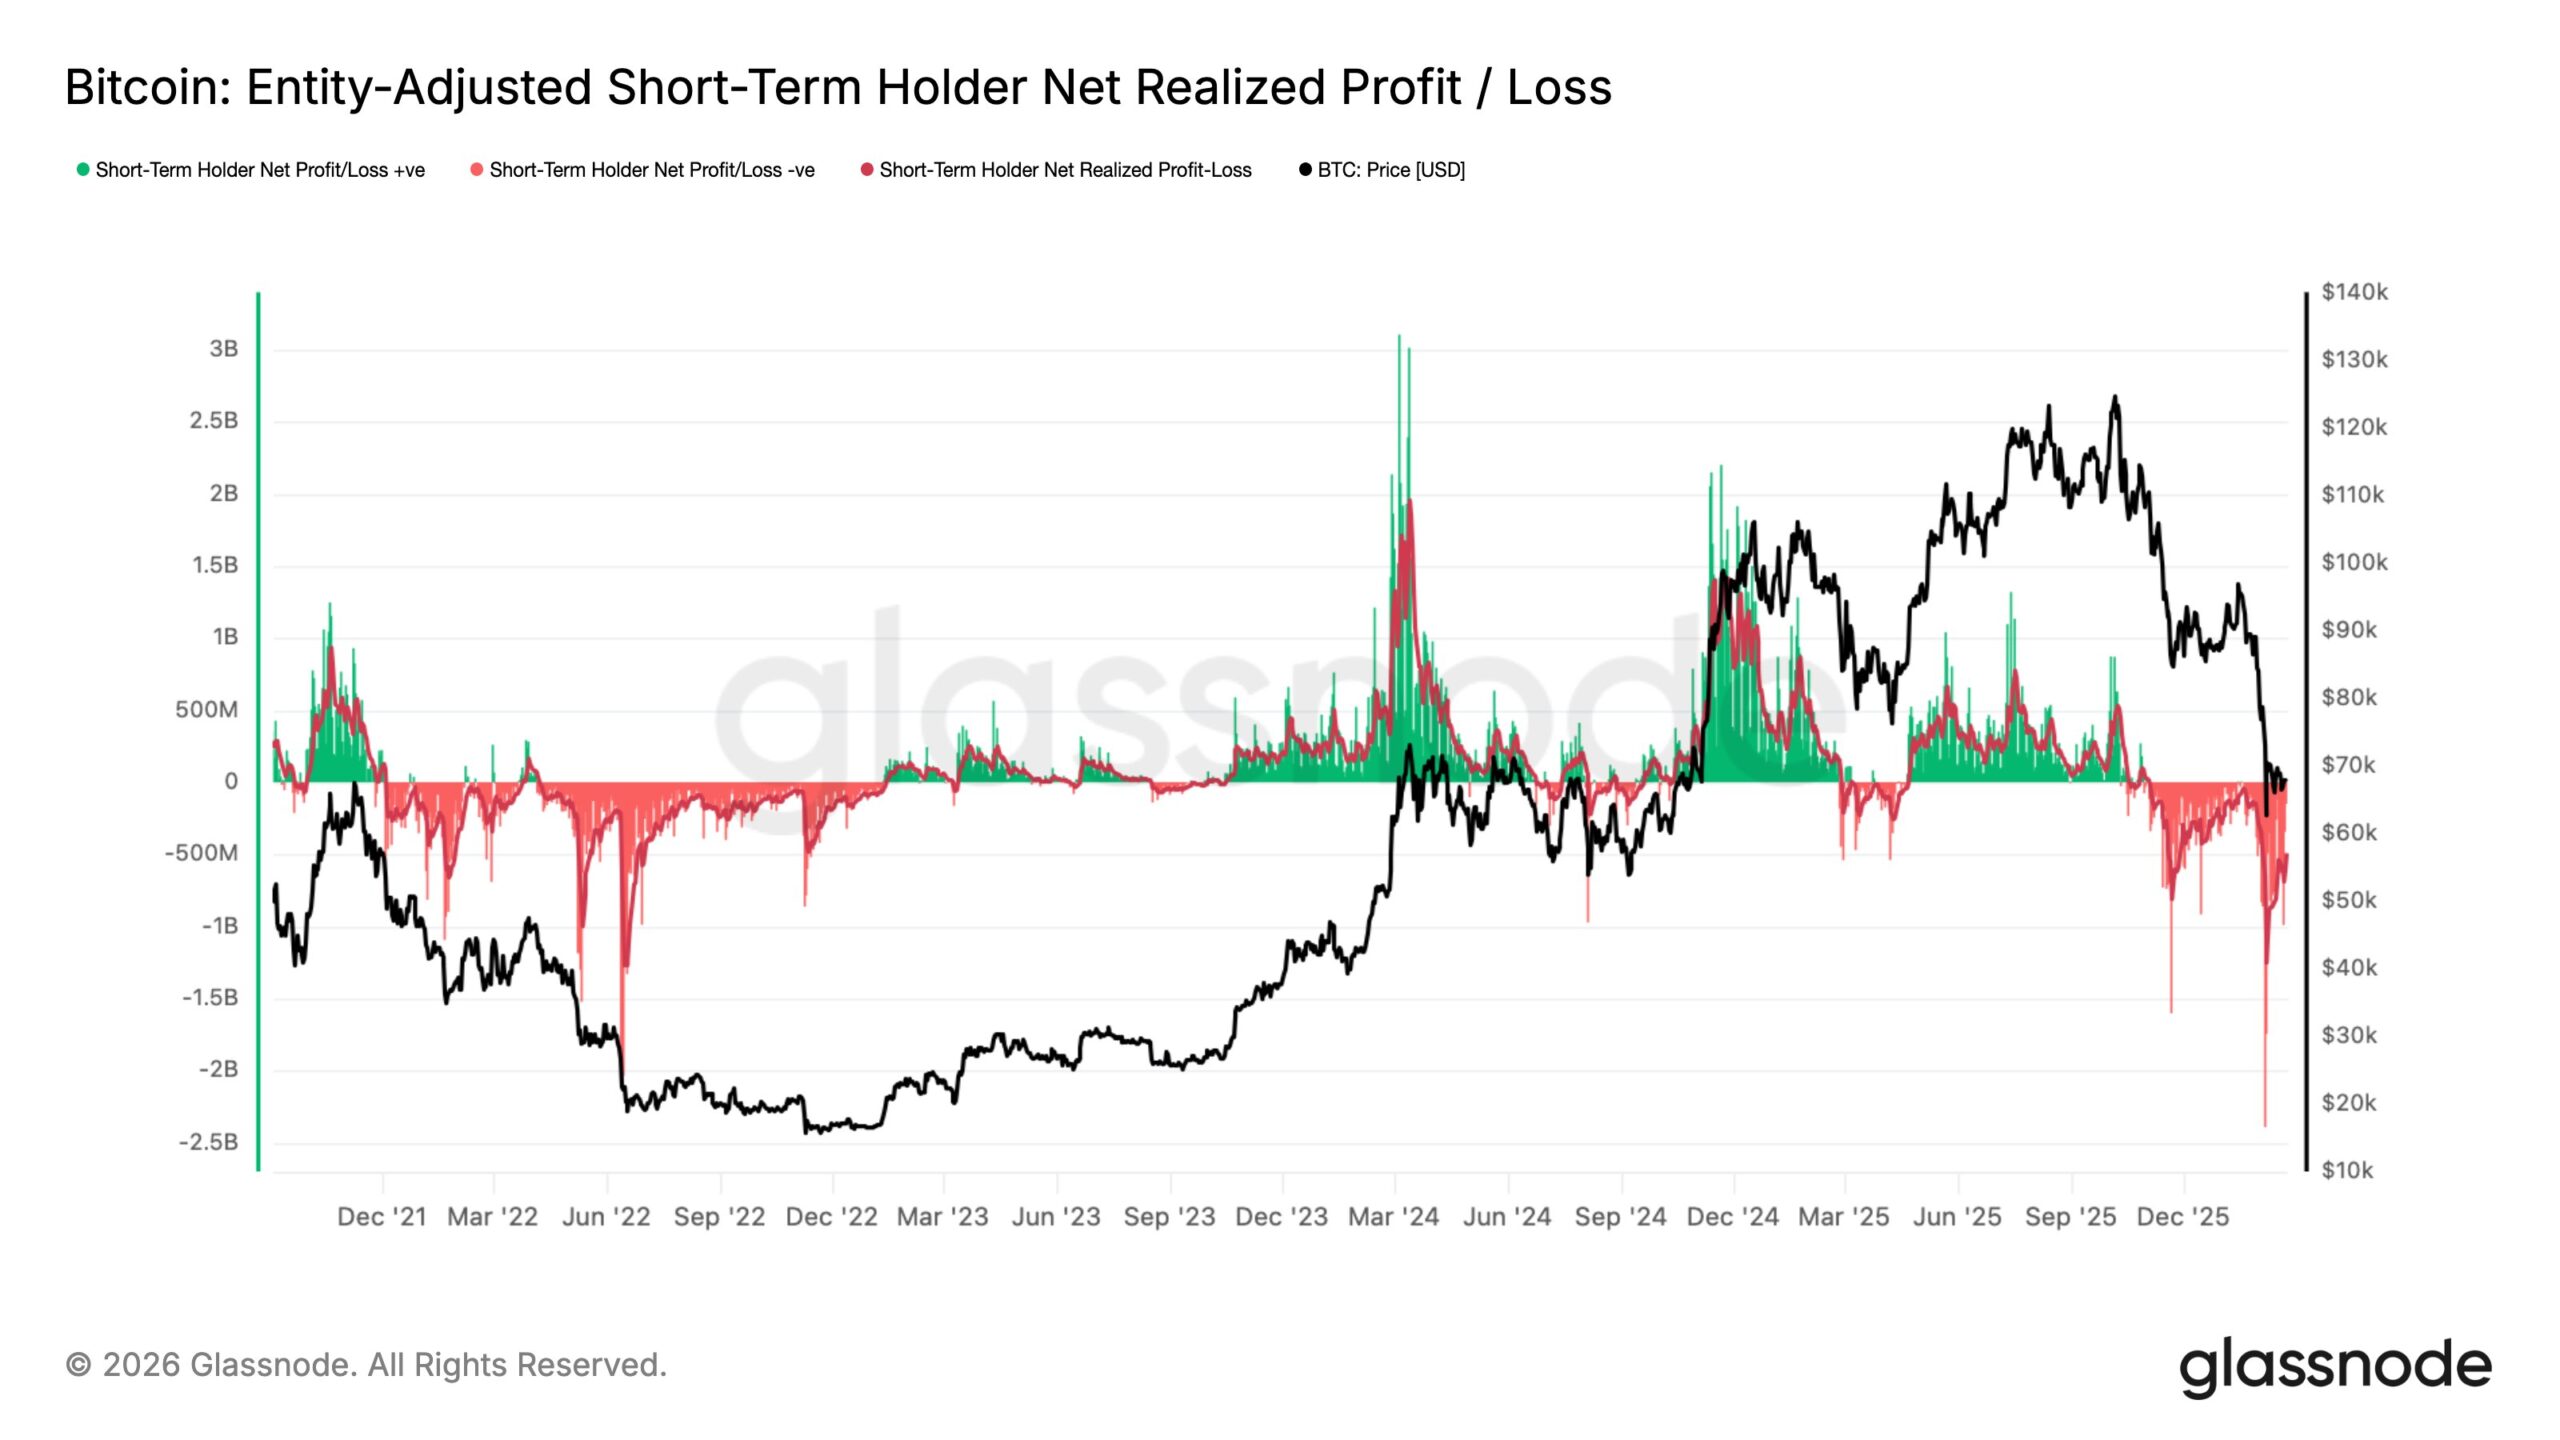
Besides that, Bitcoin’s entity-adjusted short-term holder net realized profit and loss has dropped significantly.
This metric measures whether coins held by newer market participants are being sold at a profit or a loss. The black line is the BTC price, while the green and red bars show realized profit and realized loss from short-term holders.
The most important feature right now is the rise in red bars on the far right. That signals heavy realized losses from short-term holders.
Historically, when this metric spikes negative, it reflects panic-driven distribution from weak hands.
Looking back across previous cycles on the chart, large red spikes tend to cluster near local bottoms rather than at the beginning of drawdowns.
In 2022, similar sustained negative readings occurred as Bitcoin’s price carved out macro lows. In contrast, major tops were characterized by strong green spikes, with short-term holders aggressively realizing profits on strength.
What makes the current reading notable is the scale of the negative realization relative to recent months. This kind of behavior typically resets speculative excess and transfers coins from weaker hands to stronger hands with longer time horizons.
BTC Short-Term Holder Net Realized Profit/Loss | Credit: Glassnode
However, negative readings alone do not guarantee an immediate reversal. In bear phases, loss realization remained elevated for extended periods before price structurally recovered.
The key is whether the selling pressure begins to compress and stabilize while Bitcoin’s price holds support. For now, that seems uncertain.
BTC Price Forecast
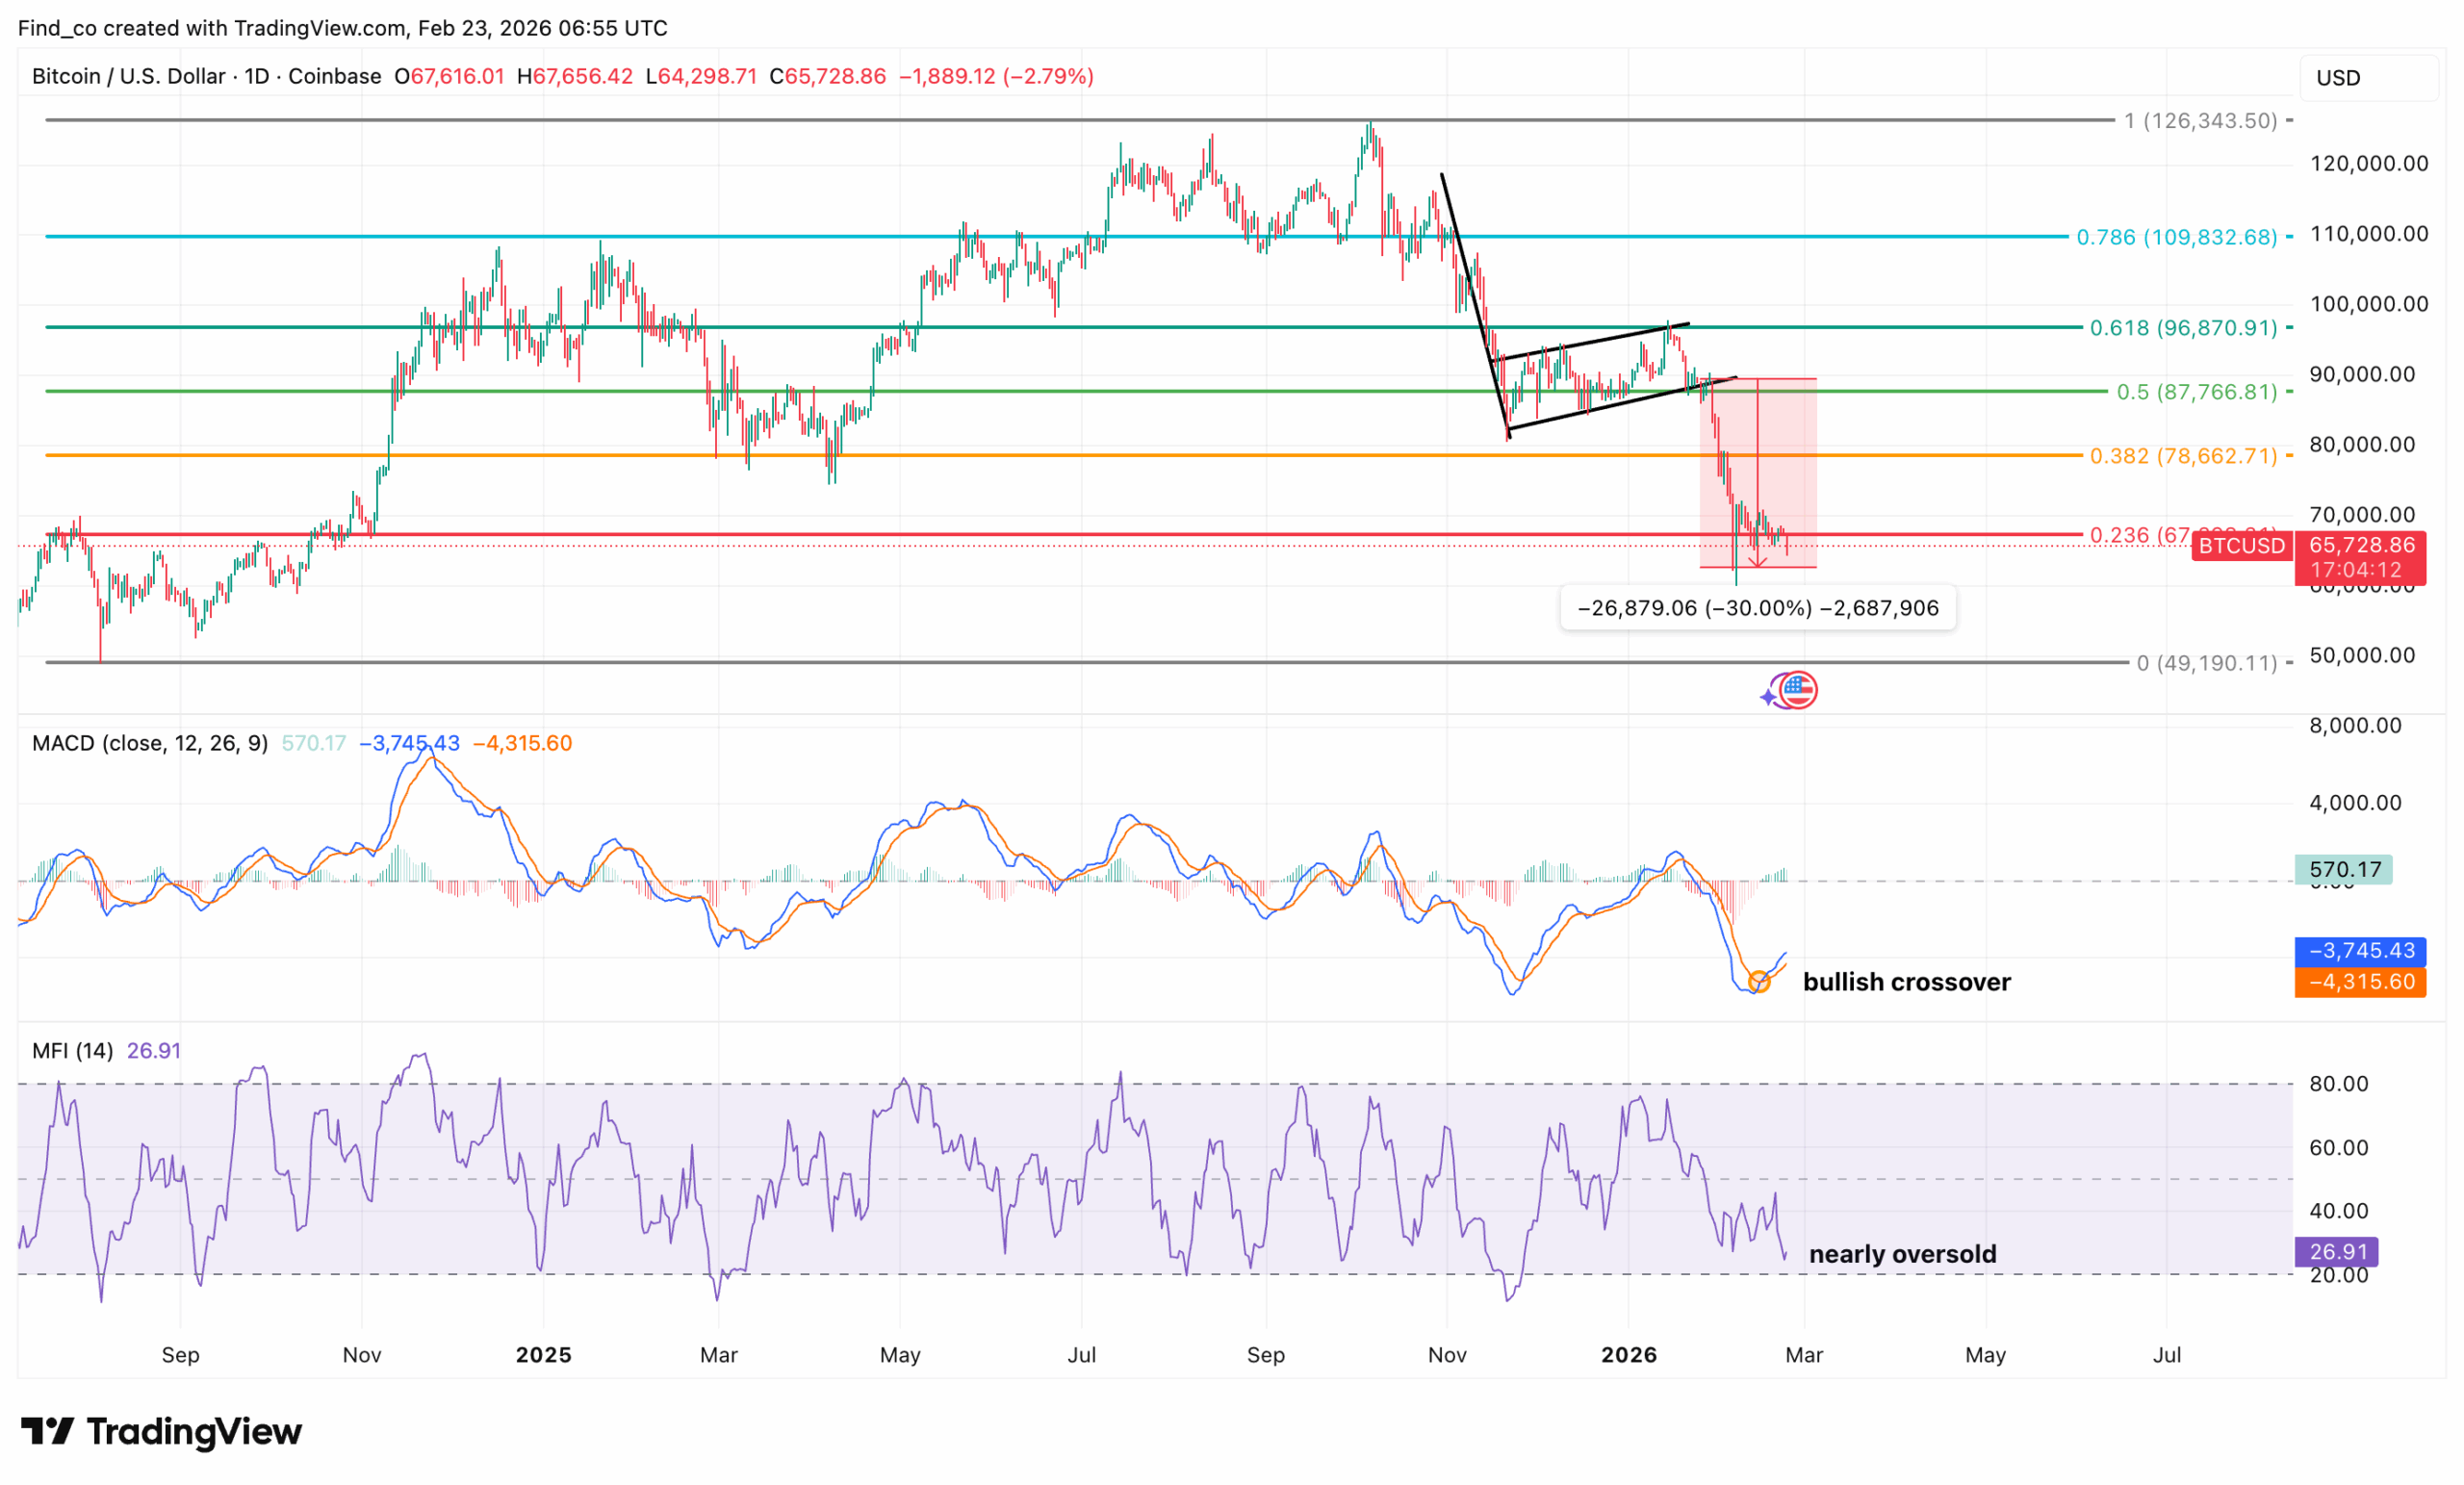
From a technical perspective, Bitcoin’s price has broken below the 0.382 Fibonacci level at $78,662.
At the time of writing, it is trading around 65,700, sitting directly on the 0.236 retracement level. The failed ascending wedge attempt around the 0.5 level transitioned into a selloff, confirming distribution rather than accumulation.
As a result, BTC fell by 30% after breaking below the bear flag’s lower trendline, as shown below.
Structurally, the lower high near $96,870 and the subsequent rejection set the tone for this move.
Once the $87,766 support area gave way, momentum accelerated quickly. The current price action shows a compression near the $67,000 region, which is acting as short-term support.
A loss of this zone would expose the next major macro level near $49,190, which aligns with the zero Fibonacci level
Momentum indicators are beginning to show early signs of exhaustion. For instance, the Moving Average Convergence Divergence (MACD) has printed a bullish crossover from negative territory.
As seen below, the histogram is turning positive, suggesting downside momentum is slowing. Meanwhile, the Money Flow Index (MFI) is near oversold levels, indicating aggressive selling pressure may be nearing short-term exhaustion.
However, trend structure remains bearish. Bitcoin’s price is trading well below prior support-turned-resistance, and there is no confirmed higher low on the daily timeframe yet.
For any meaningful recovery, BTC would need to reclaim the $70,000 region first, then push back above $78,662 to negate the breakdown.
Disclaimer:
The information provided in this article is for informational purposes only. It is not intended to be, nor should it be construed as, financial advice. We do not make any warranties regarding the completeness, reliability, or accuracy of this information. All investments involve risk, and past performance does not guarantee future results. We recommend consulting a financial advisor before making any investment decisions.
Victor Olanrewaju is a crypto analyst and reporter at CCN with deep roots in on-chain research and technical analysis. His crypto journey began in 2017, but it was the 2020 Uniswap airdrop that sparked a full-time pivot into the space.
With a foundation in copywriting, Victor honed his craft creating high-converting content for leading crypto brokers — most notably an XRP price prediction that ranked #1 on Google during the 2021 bull run.
He later joined AMBCrypto in 2022, where he combined storytelling with technical and on-chain analysis to cover key market narratives.
In 2024, he expanded his expertise at BeInCrypto, collaborating with analysts and using tools like Glassnode, Santiment, and IntoTheBlock to break down Bitcoin and altcoin trends.
At CCN, Victor covers the top cryptocurrencies, memecoins, macro shifts, blending real-time insights with deep-dive metrics.
He holds a Bachelor’s degree in Physics from the University of Ibadan, equipping him to simplify complex data for a wide audience. Follow his work or connect on LinkedIn or X.