Gold Price Weakens Near $4,290 as Markets React to Fed and Dollar Surge | Credit: Veronica Cestari
Share
Key Takeaways
Gold marked its seventh consecutive monthly gain following coordinated US-Israeli strikes in Iran.
Bitcoin’s price dropped to $63,038 amid weekend geopolitical shocks, though it later stabilized.
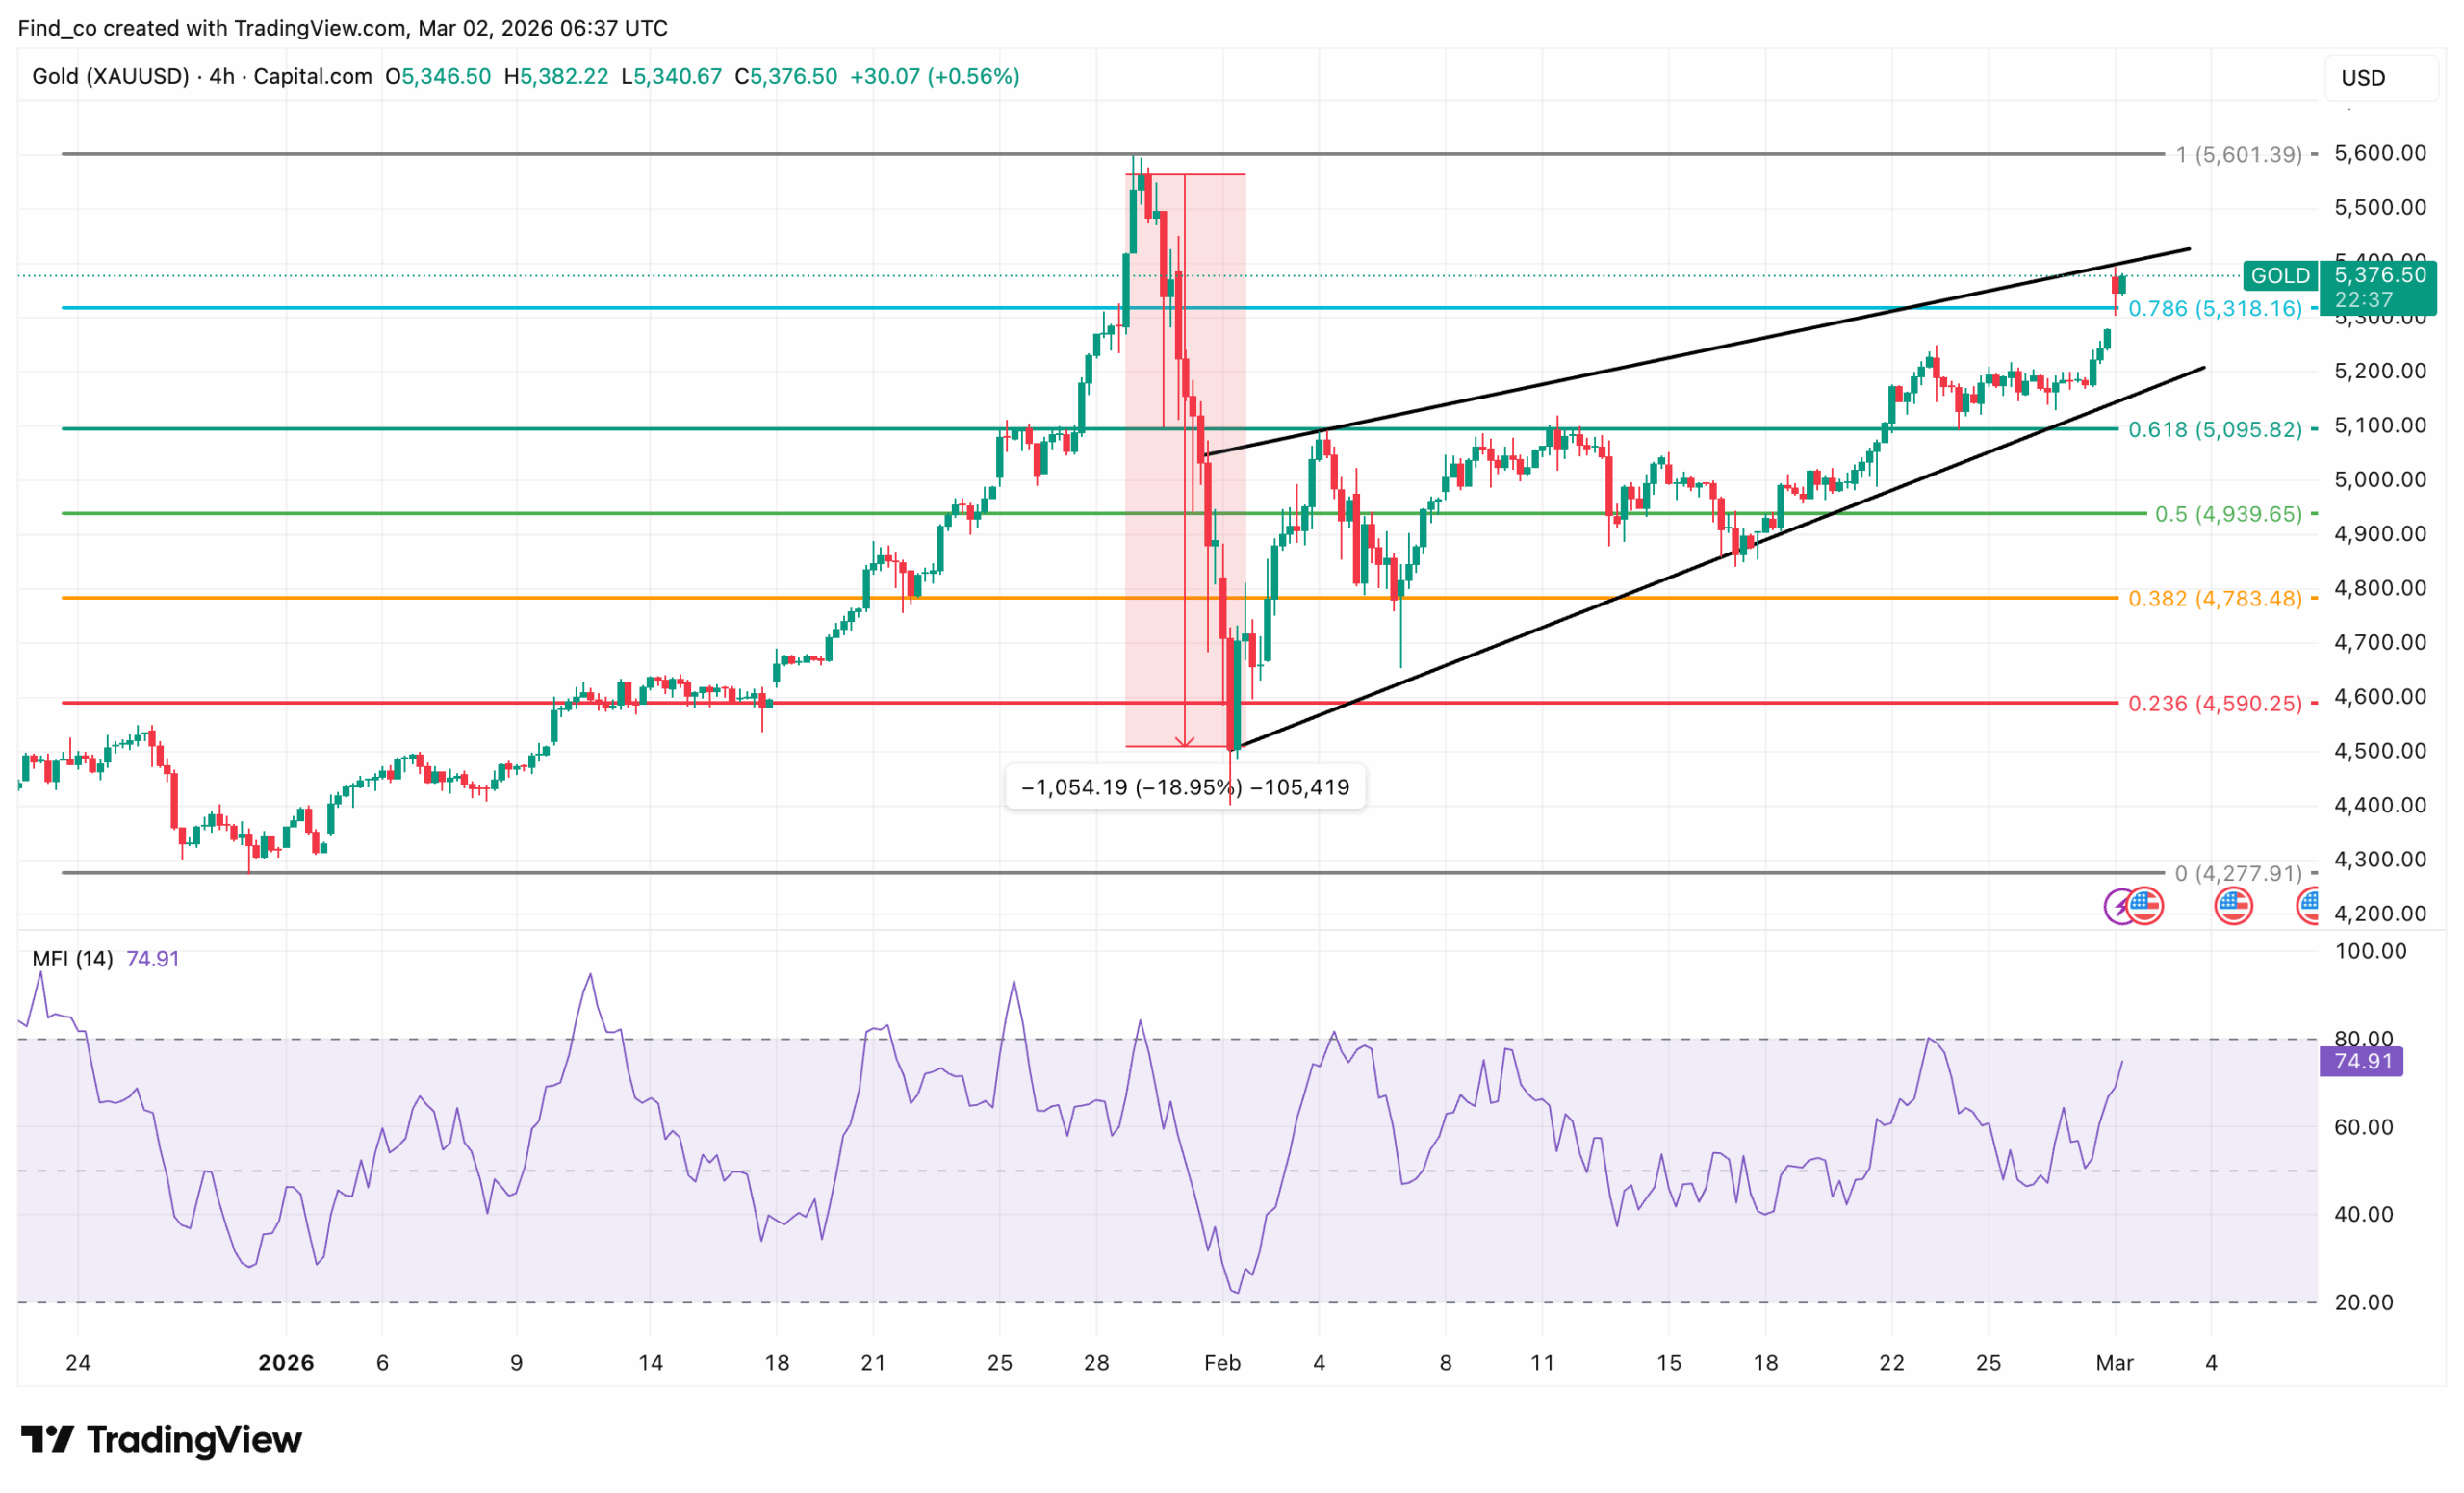
On-chain data signals a potential Bitcoin capitulation, while gold could hit a new high of $5,601.
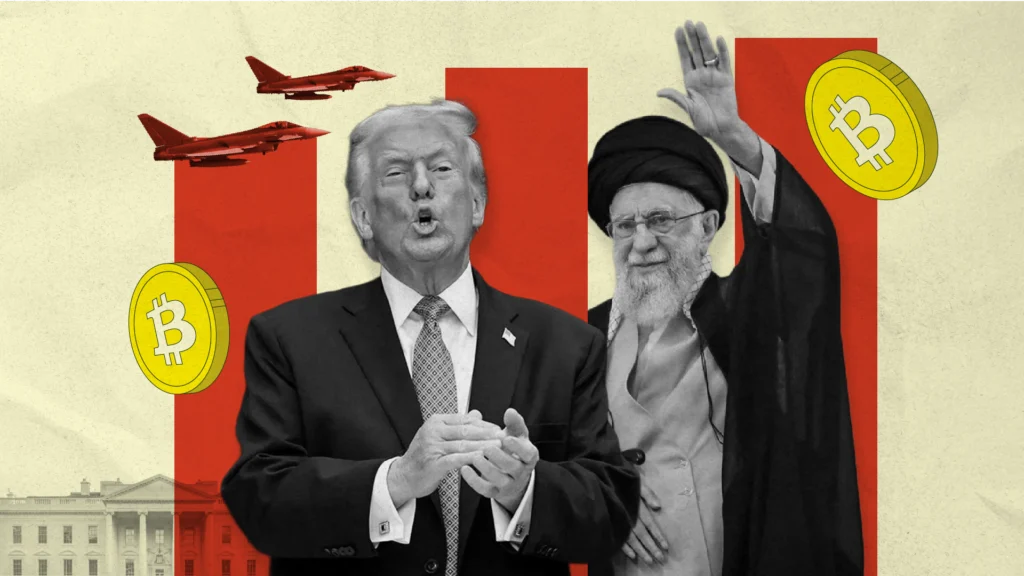
On Feb. 28, 2026, coordinated US and Israeli strikes on Iranian nuclear, naval, and missile infrastructure triggered one of the fastest safe-haven rotations in modern history.
Gold’s price surged from $5,194 to an intraday high of $5,299 per ounce. Bitcoin (BTC), on the other hand, crashed to $63,038.
Later on, it spiked to $68,196 when Iran confirmed Khamenei’s death, and settled at approximately $66,197 as the retaliation cycle began.
Two assets. Two completely different war playbooks. However, both are telling critical stories for the week ahead.
In that scenario, the precious metal market value might decline to $5,095. At best, it consolidates.
“There will be extra haven demand for gold which could see prices rise to around $5,500 again, and possibly a new record high above January’s peak of around $5,600. However, gold’s gains beyond that level could be capped by a potential rebound in the US dollar, especially if crude oil stays sharply higher.” — Fawad Razaqzada, City Index & Forex.com analyst stated.
However, independent metals trader Tai Wong cautioned that gold “could sell off on the fact” at the open, noting the attack had been partially priced in. Ed Yardeni of Yardeni Research suggested gold “might round-trip on Monday,” arguing a resolution-driven oil price drop could cap the premium.
For context, BTC is one of the few large assets tradable on weekends, unlike gold. So, it absorbs geopolitical shock selling when traditional markets are closed.
Over the weekend, $657 million in leveraged positions were liquidated in 24 hours — 75.6% of them long positions — erasing $128 billion in total crypto market cap before the price rebounded.
On Feb. 28, one whale moved 6,318 BTC ($425 million) to Binance in a single transaction, part of an 11,318 BTC ($761 million) inflow on a single day.
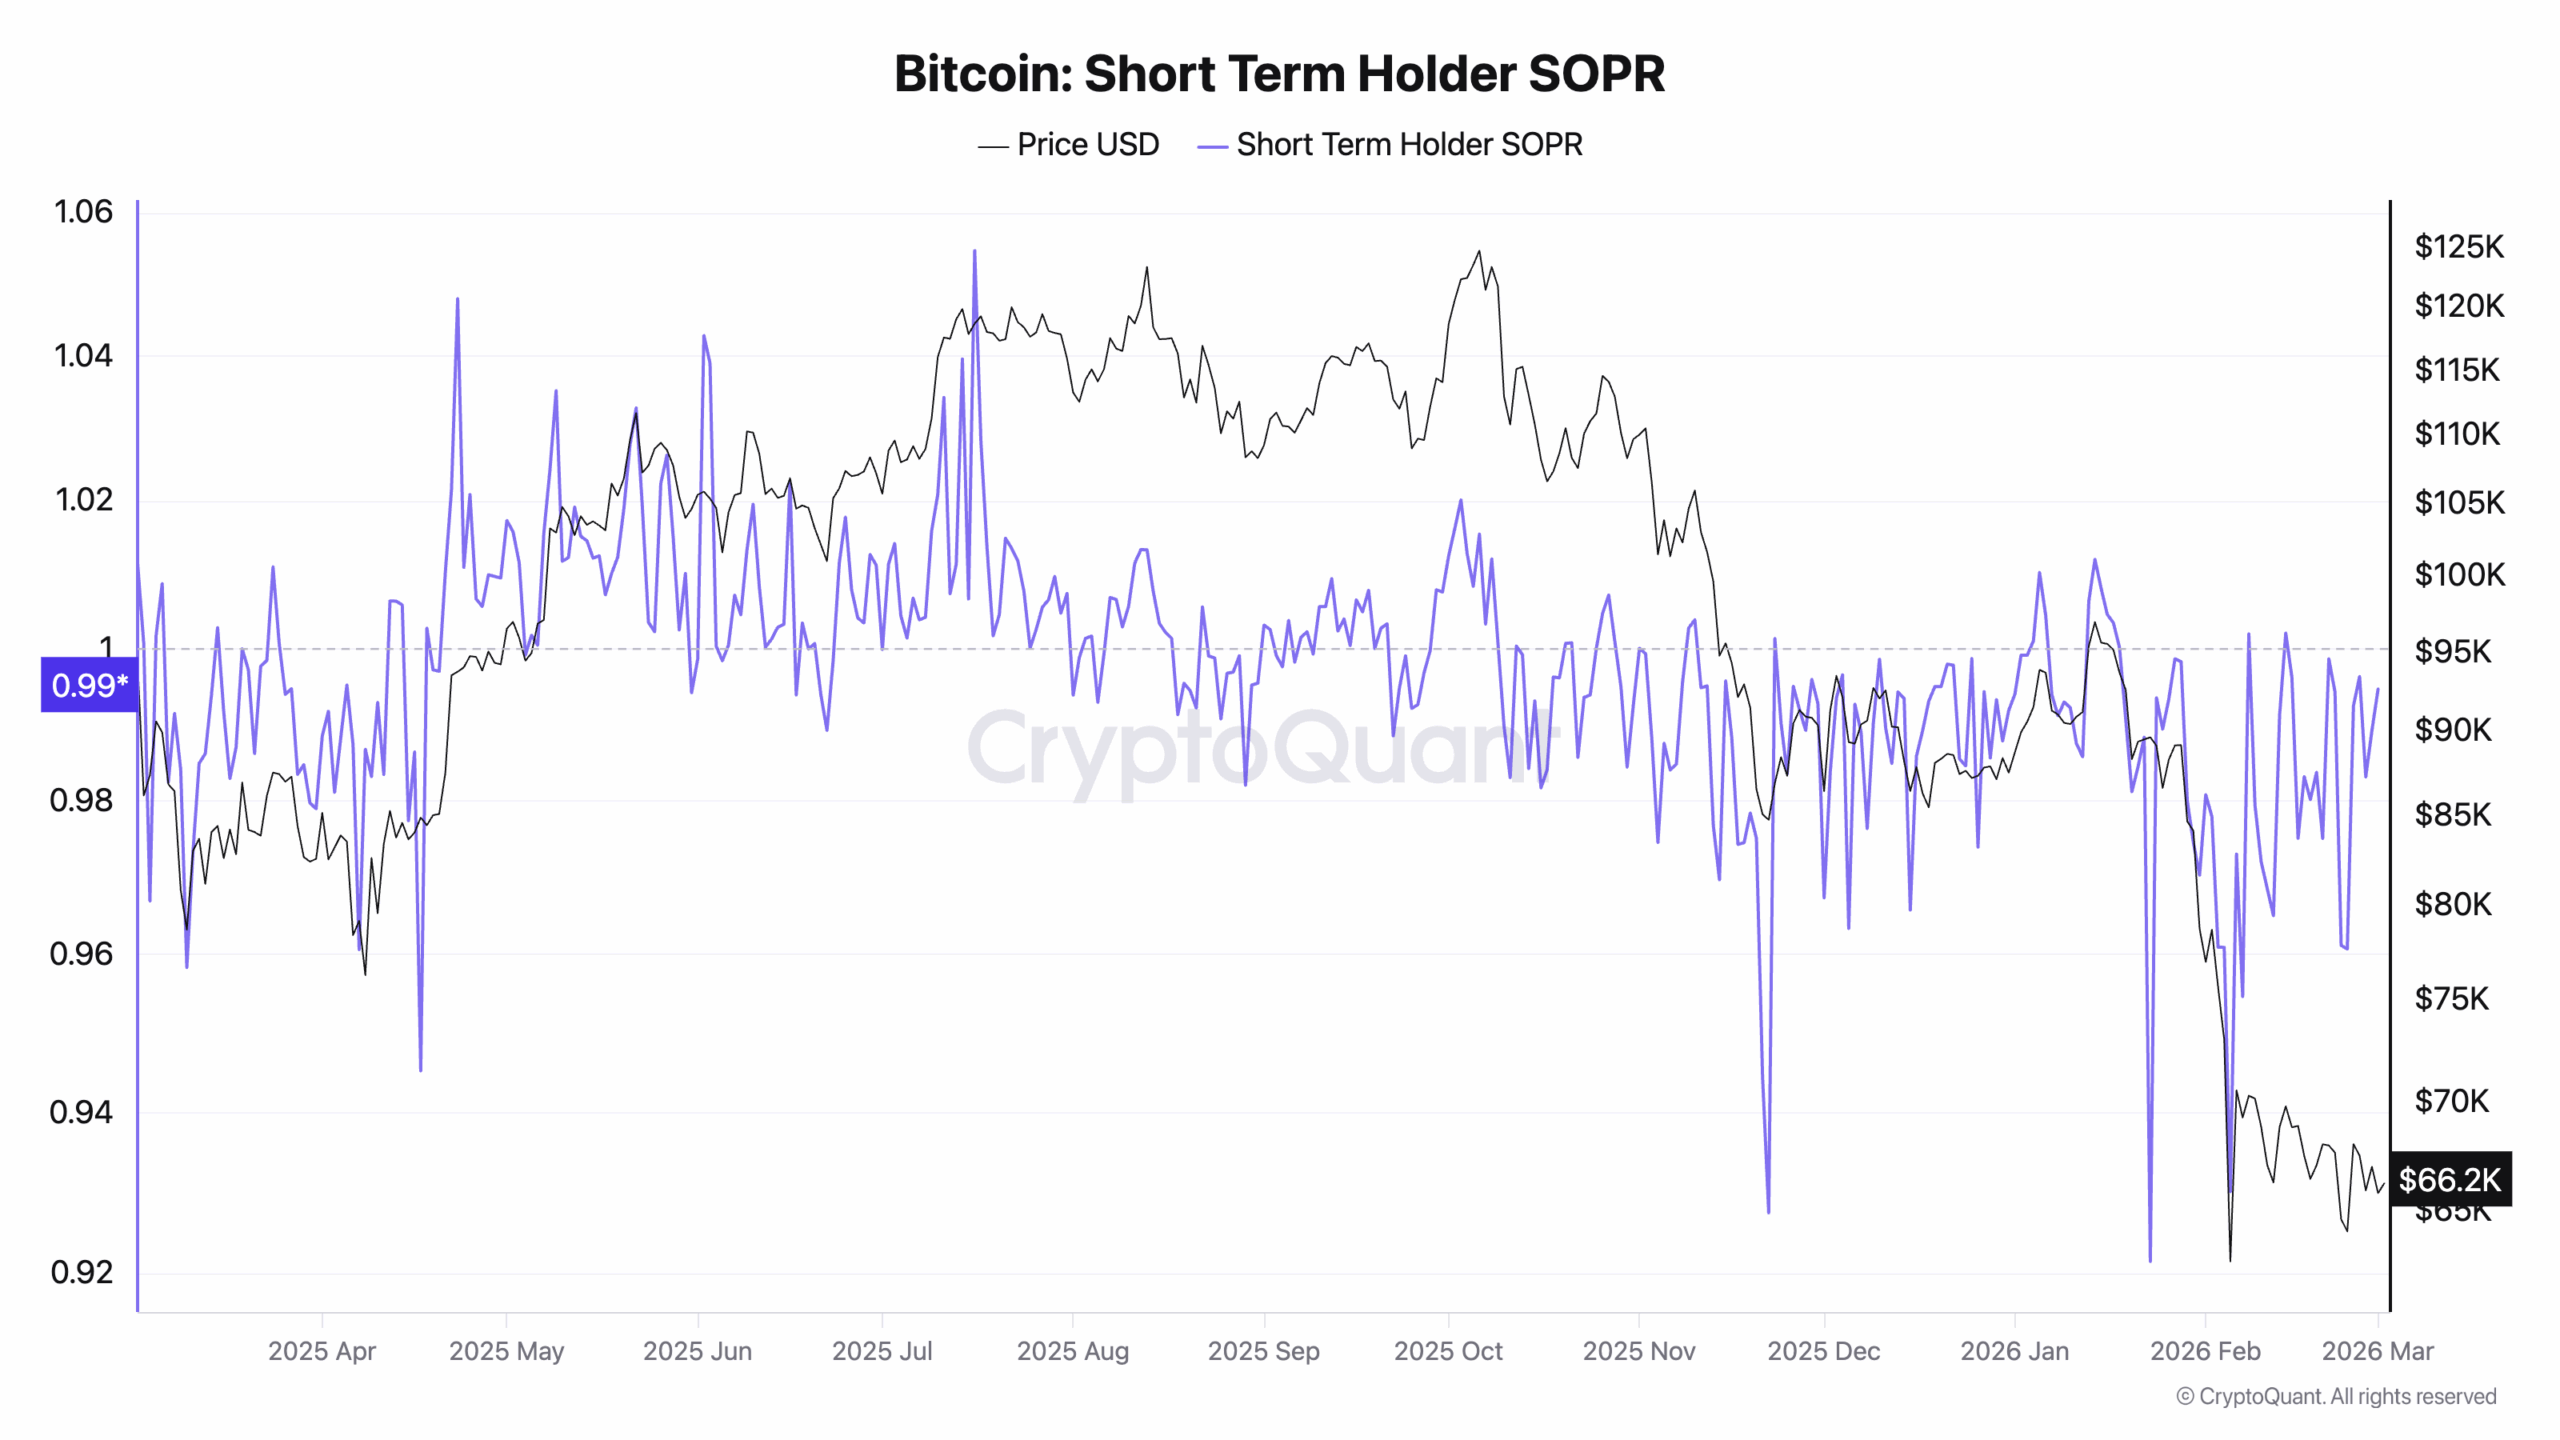
For context, this is the largest since January 2021. In the meantime, on-chain data suggests Bitcoin capitulation despite gold’s price increase.
CryptoQuant data shows the Short-Term Holder SOPR has fallen below 1.0, meaning recent buyers are selling at a loss just to exit, a textbook bottom-formation signal.
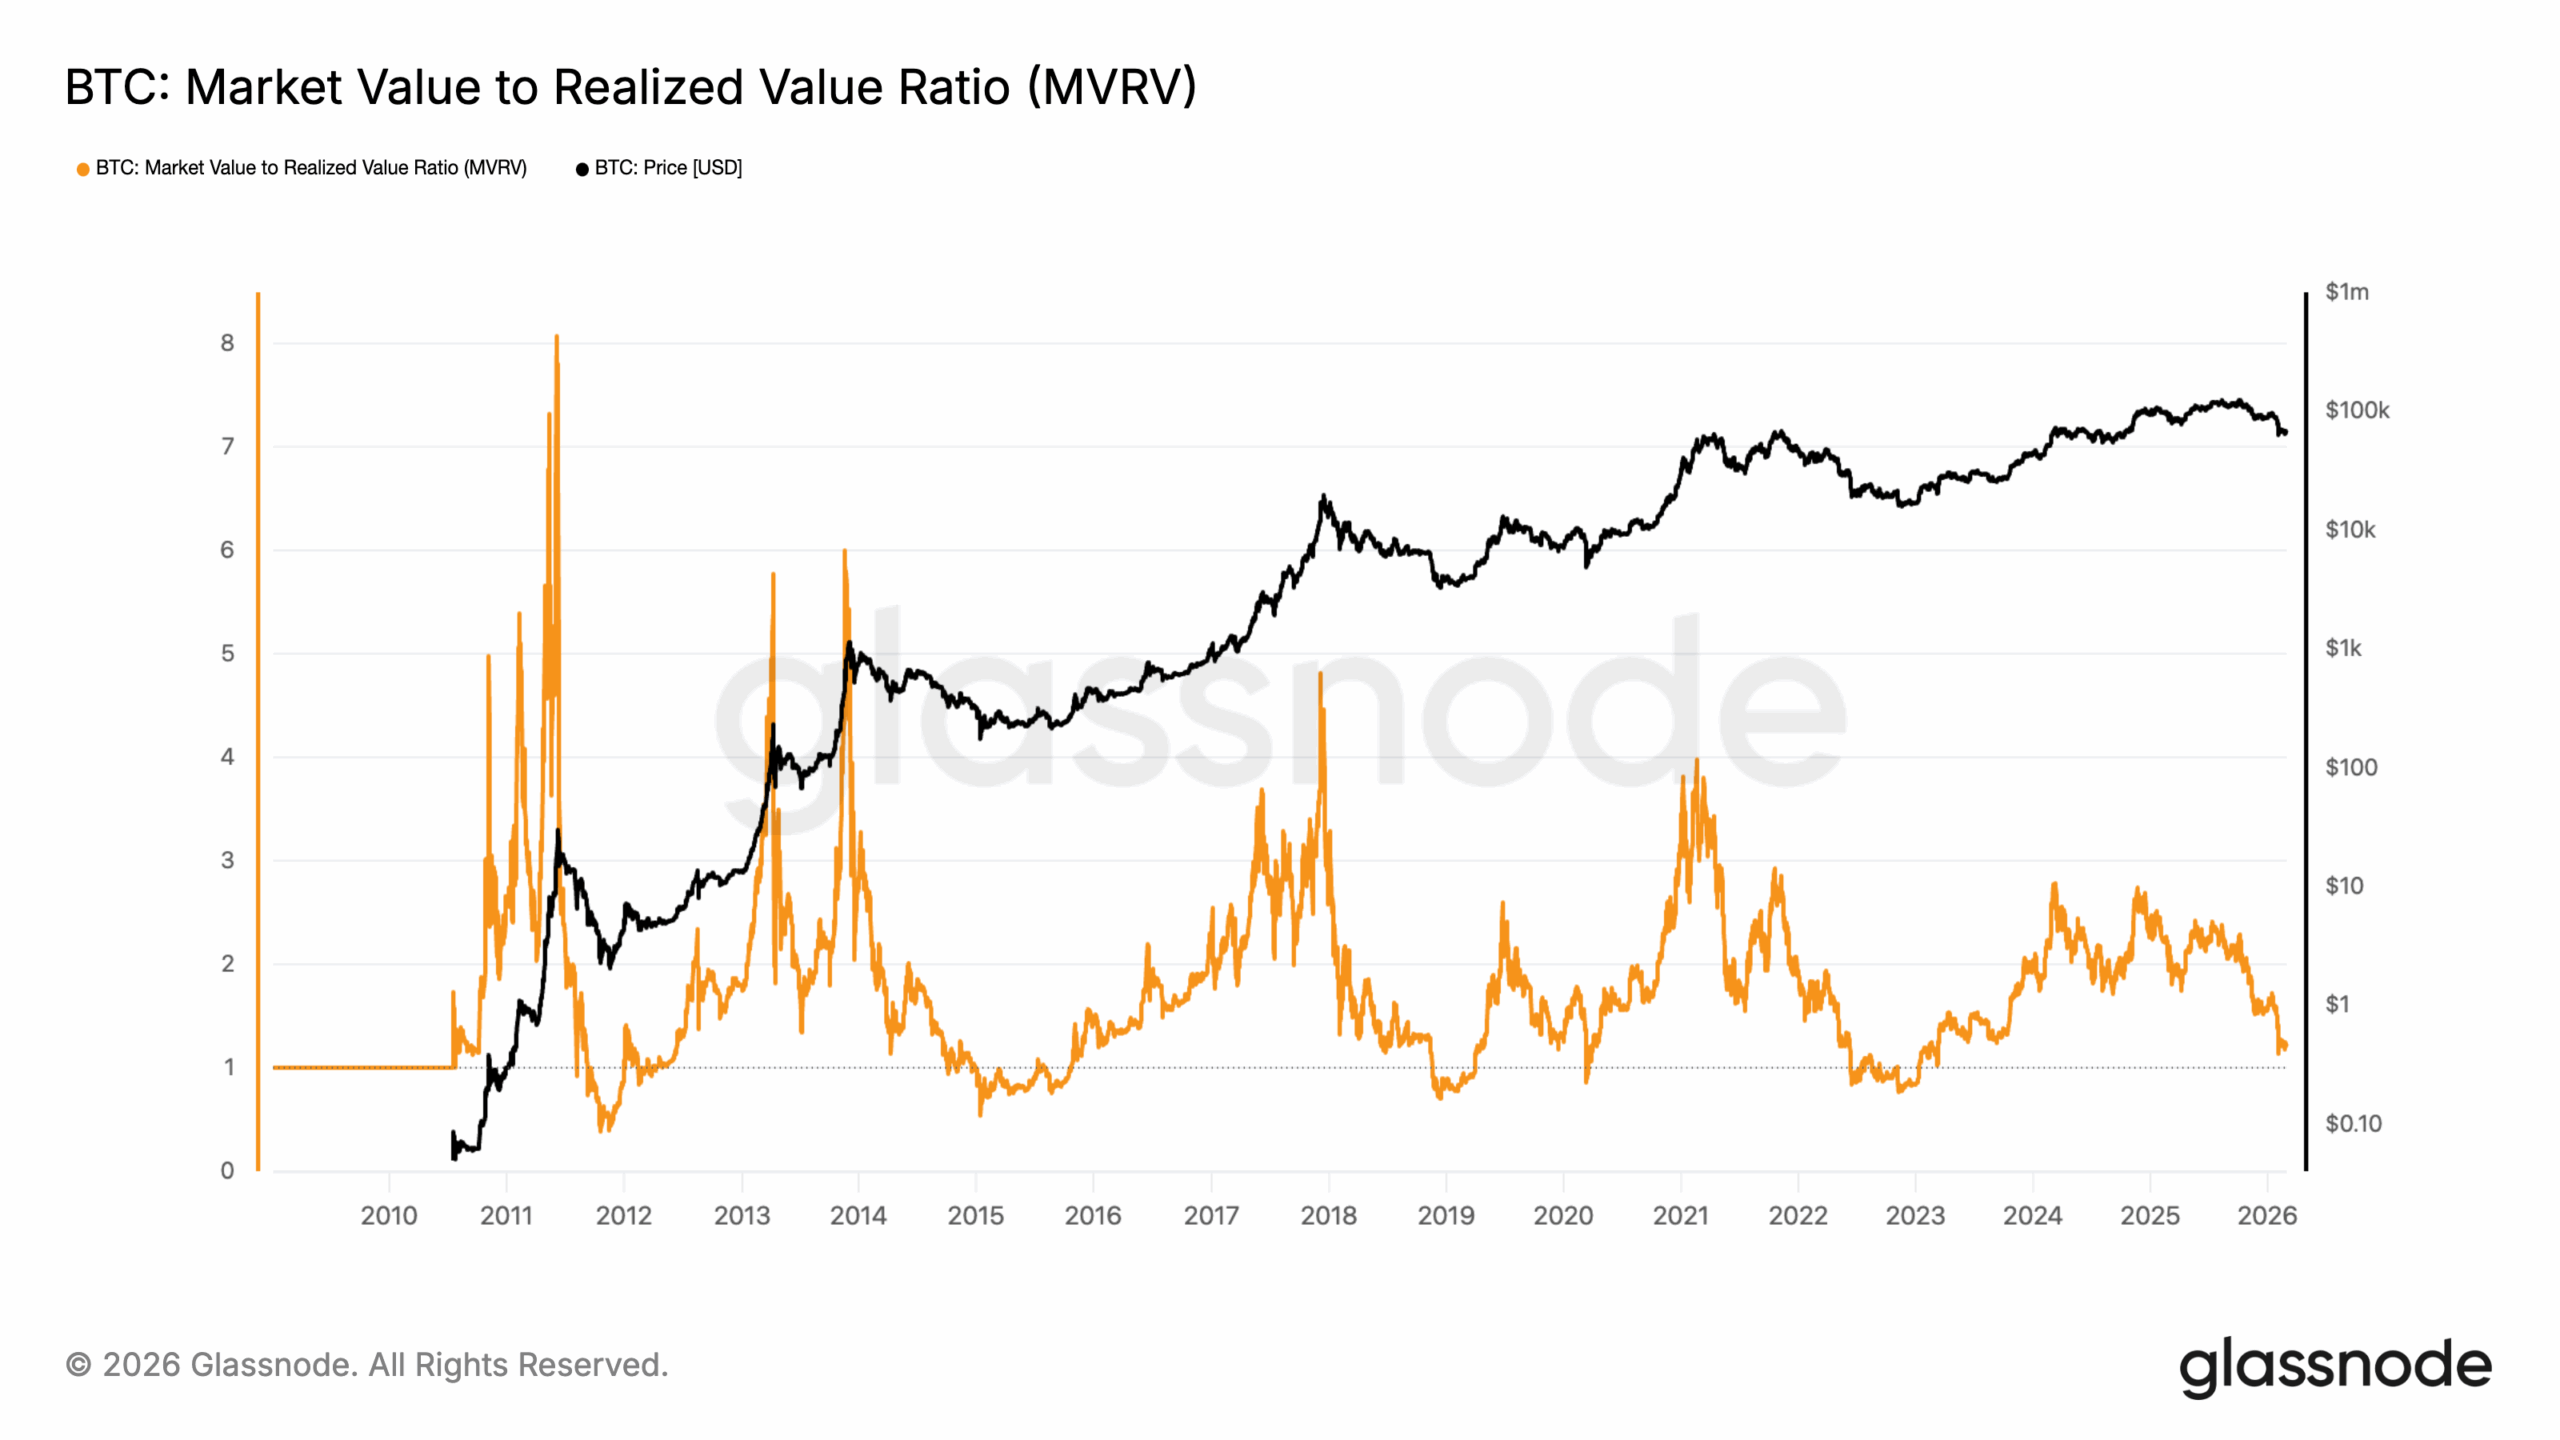
Furthermore, the MVRV ratio has compressed to approximately 1.17, down from 1.24, with the 365-day MVRV at -11%, placing the spot price 11% below the network’s average acquisition cost.
Historically, this combination of SOPR and MVRV readings has preceded major cycle recoveries. But in this instance, it remains unclear whether Bitcoin’s price will continue to track gold amid the Iran-Israel strikes.
“At both the 2021 and 2025 tops, the Z-score triggered a bearish divergence at the new Bitcoin highs, and it flashed a bullish divergence at the 2022 low. We don’t have such divergence yet, plus at 91% the signal itself is not yet at the extremes seen at past lows. This suggests to me that Bitcoin will need to spend more time backing and potentially filling at the $60-$70k level,” Jurrien Timmer, Director of Global Macro at Fidelity opined.
BTC Price Prediction: Bull Trap?
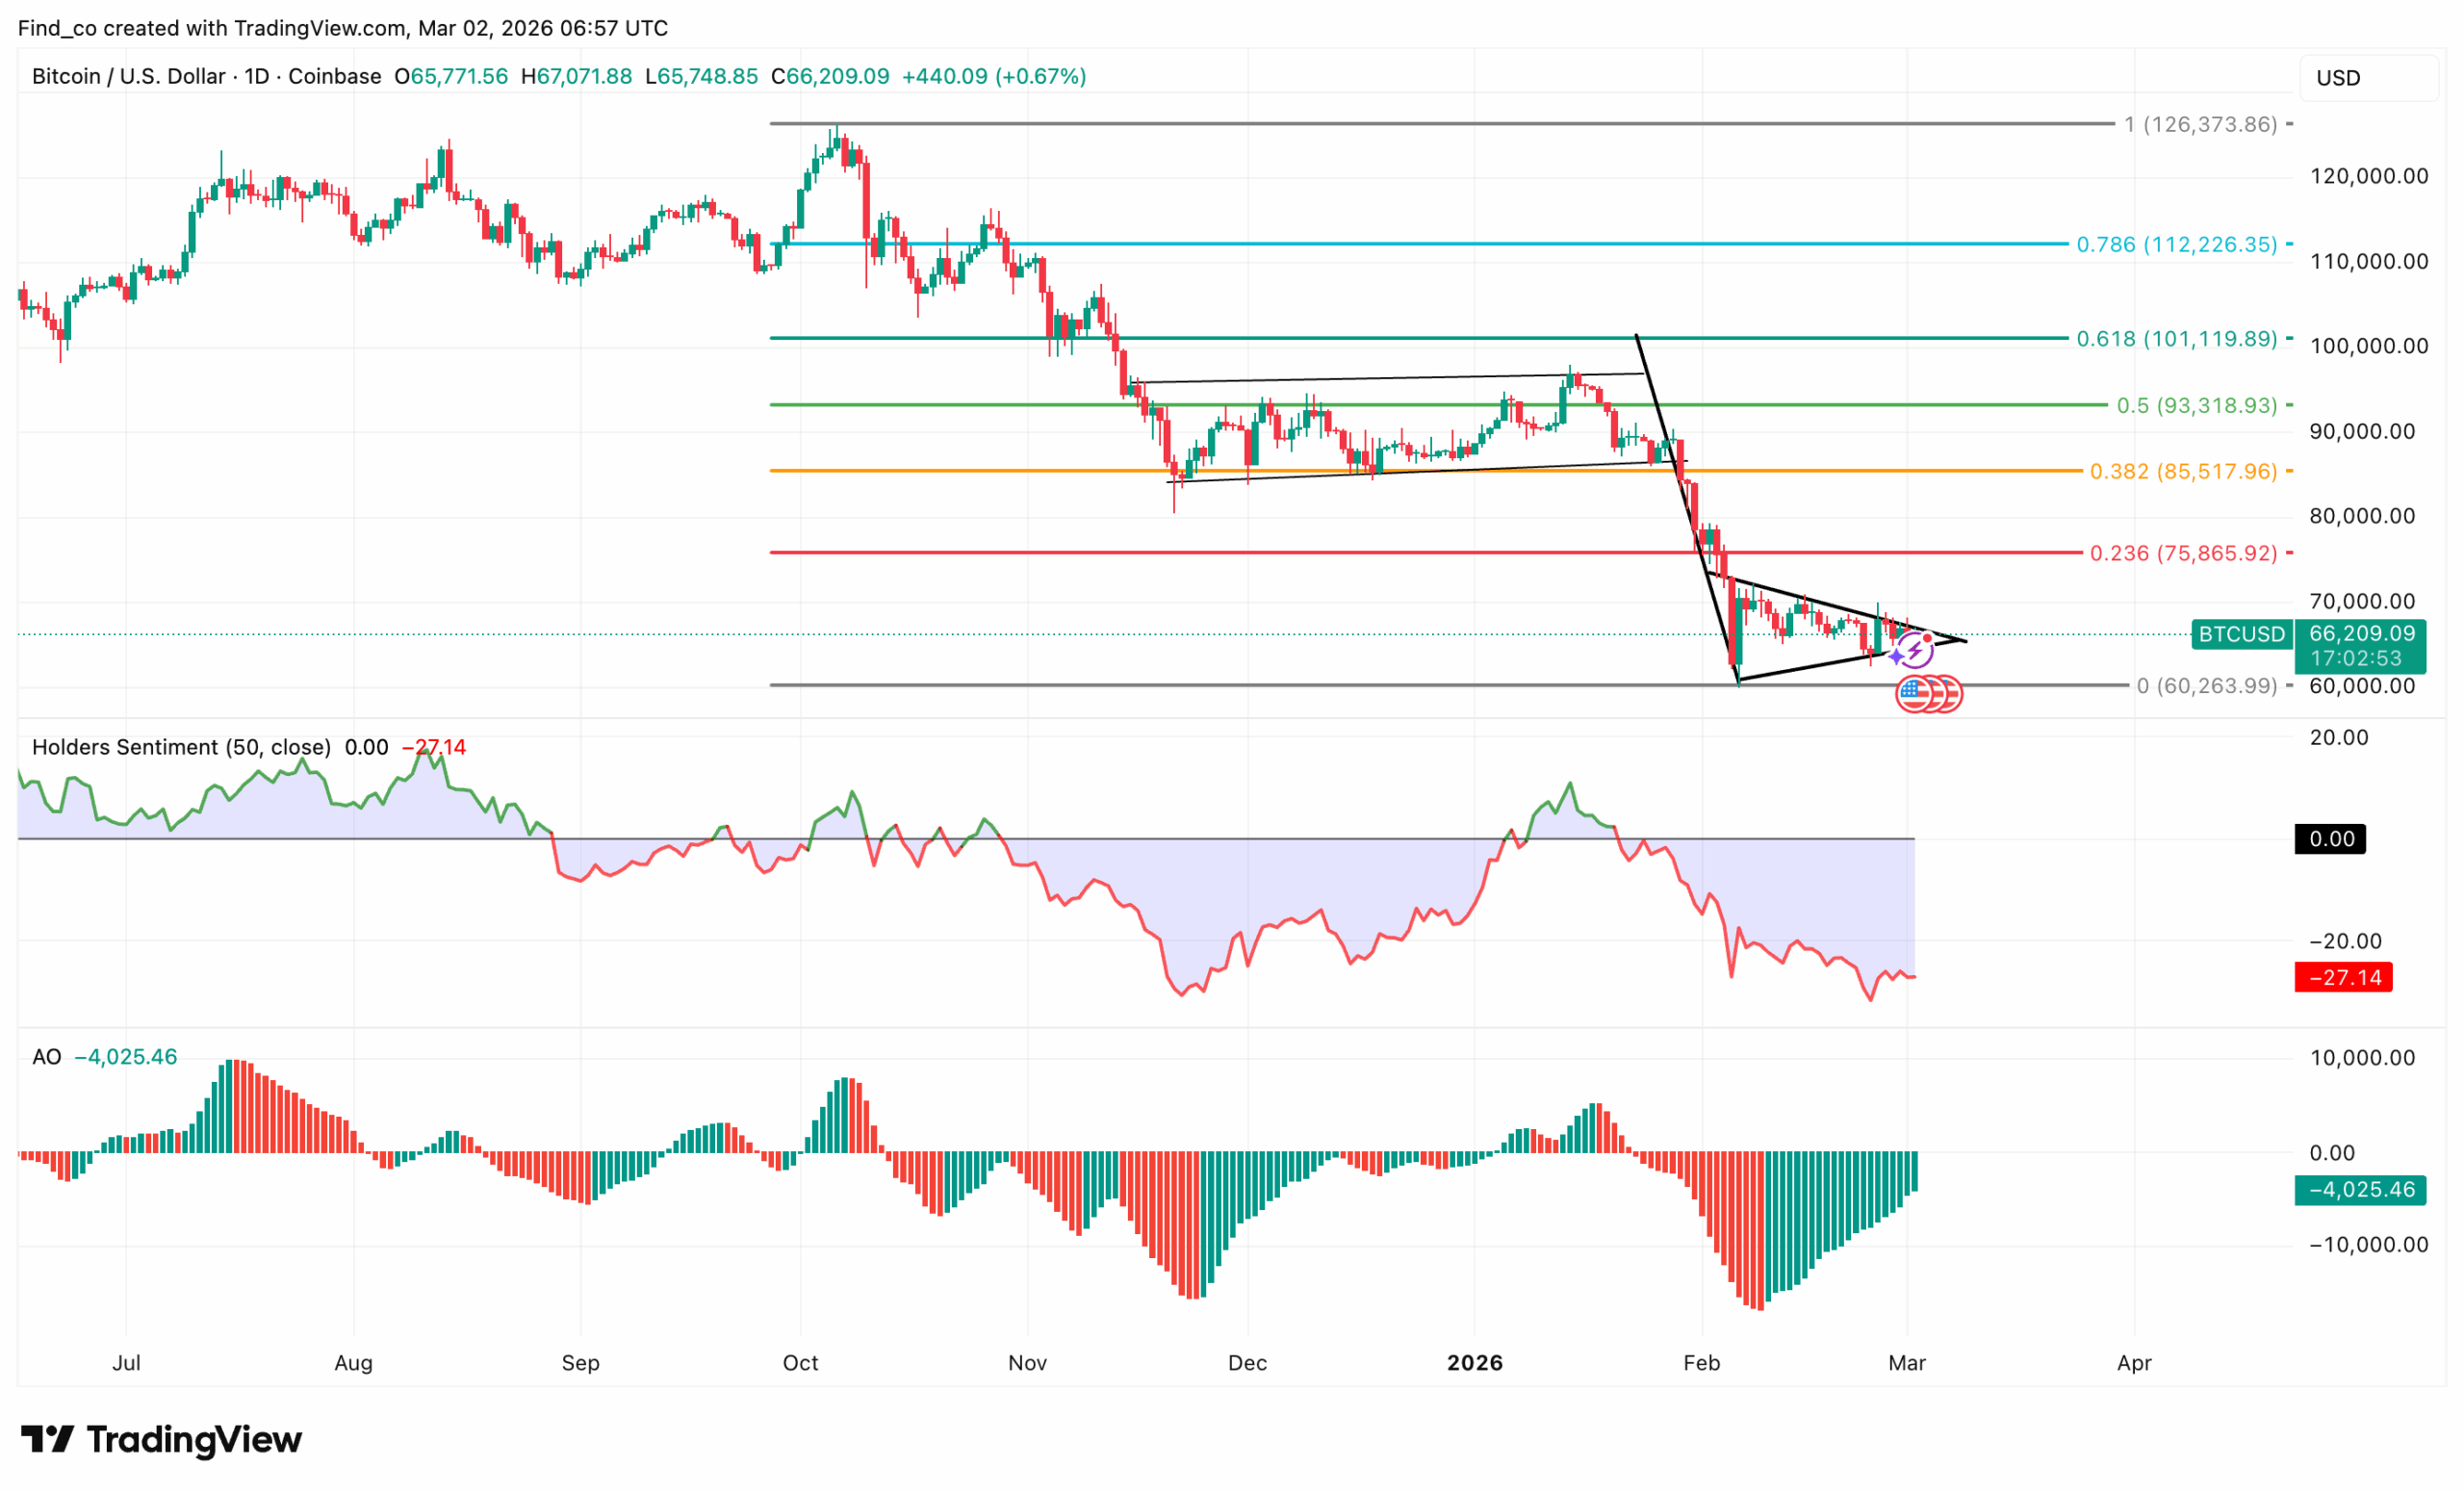
From a technical perspective, Bitcoin’s price remains under macro pressure on the daily timeframe.
However, the short-term compression suggests that a notable move is approaching
At the time of writing, the flagship cryptocurrency trades around $66,149.
That level aligns with a prior major structure area and is currently acting as the base of consolidation. The recent price action has formed a tight pennant following the selloff, which typically represents continuation unless invalidated.
The broader structure remains bearish. Bitcoin’s price is well below the 0.236 retracement at $75,865 and far below the 0.382 retracement at $ 85,517.
Momentum indicators show mixed signals. Holders’ sentiment is deeply negative, suggesting elevated pessimism.
On the flip side, the Awesome Oscillator (AO) remains below zero. However, it is beginning to contract, suggesting downside momentum is slowing, though it has not yet reversed.
The key level remains $60,263. A breakdown below that support would likely open the door toward the $55,000 range and potentially the $49,000 macro level marked on the chart.
On the other hand, a bullish breakout from the bearish pennant, accompanied by strong volume, could trigger a short squeeze toward $75,865.
The binary nature of what happens next has never been starker: it is the Strait of Hormuz, Iran’s next military move, and Monday’s traditional market open against Bitcoin’s most historically oversold RSI reading in years.
Whichever force between Israel and Iran wins this week writes the rest of March’s price history for both gold and Bitcoin.
Disclaimer:
The information provided in this article is for informational purposes only. It is not intended to be, nor should it be construed as, financial advice. We do not make any warranties regarding the completeness, reliability, or accuracy of this information. All investments involve risk, and past performance does not guarantee future results. We recommend consulting a financial advisor before making any investment decisions.
Victor Olanrewaju is a crypto analyst and reporter at CCN with deep roots in on-chain research and technical analysis. His crypto journey began in 2017, but it was the 2020 Uniswap airdrop that sparked a full-time pivot into the space.
With a foundation in copywriting, Victor honed his craft creating high-converting content for leading crypto brokers — most notably an XRP price prediction that ranked #1 on Google during the 2021 bull run.
He later joined AMBCrypto in 2022, where he combined storytelling with technical and on-chain analysis to cover key market narratives.
In 2024, he expanded his expertise at BeInCrypto, collaborating with analysts and using tools like Glassnode, Santiment, and IntoTheBlock to break down Bitcoin and altcoin trends.
At CCN, Victor covers the top cryptocurrencies, memecoins, macro shifts, blending real-time insights with deep-dive metrics.
He holds a Bachelor’s degree in Physics from the University of Ibadan, equipping him to simplify complex data for a wide audience. Follow his work or connect on LinkedIn or X.