Home / Analysis / Crypto / Technical Analysis / Bitcoin (BTC) Miners Are Dumping Again — Why That Could Push BTC Below $60,000 as Q1 Enters Its Final Month
Bitcoin miner sell-offs have intensified in March, with two on-chain signals pointing to growing distribution pressure on the network.
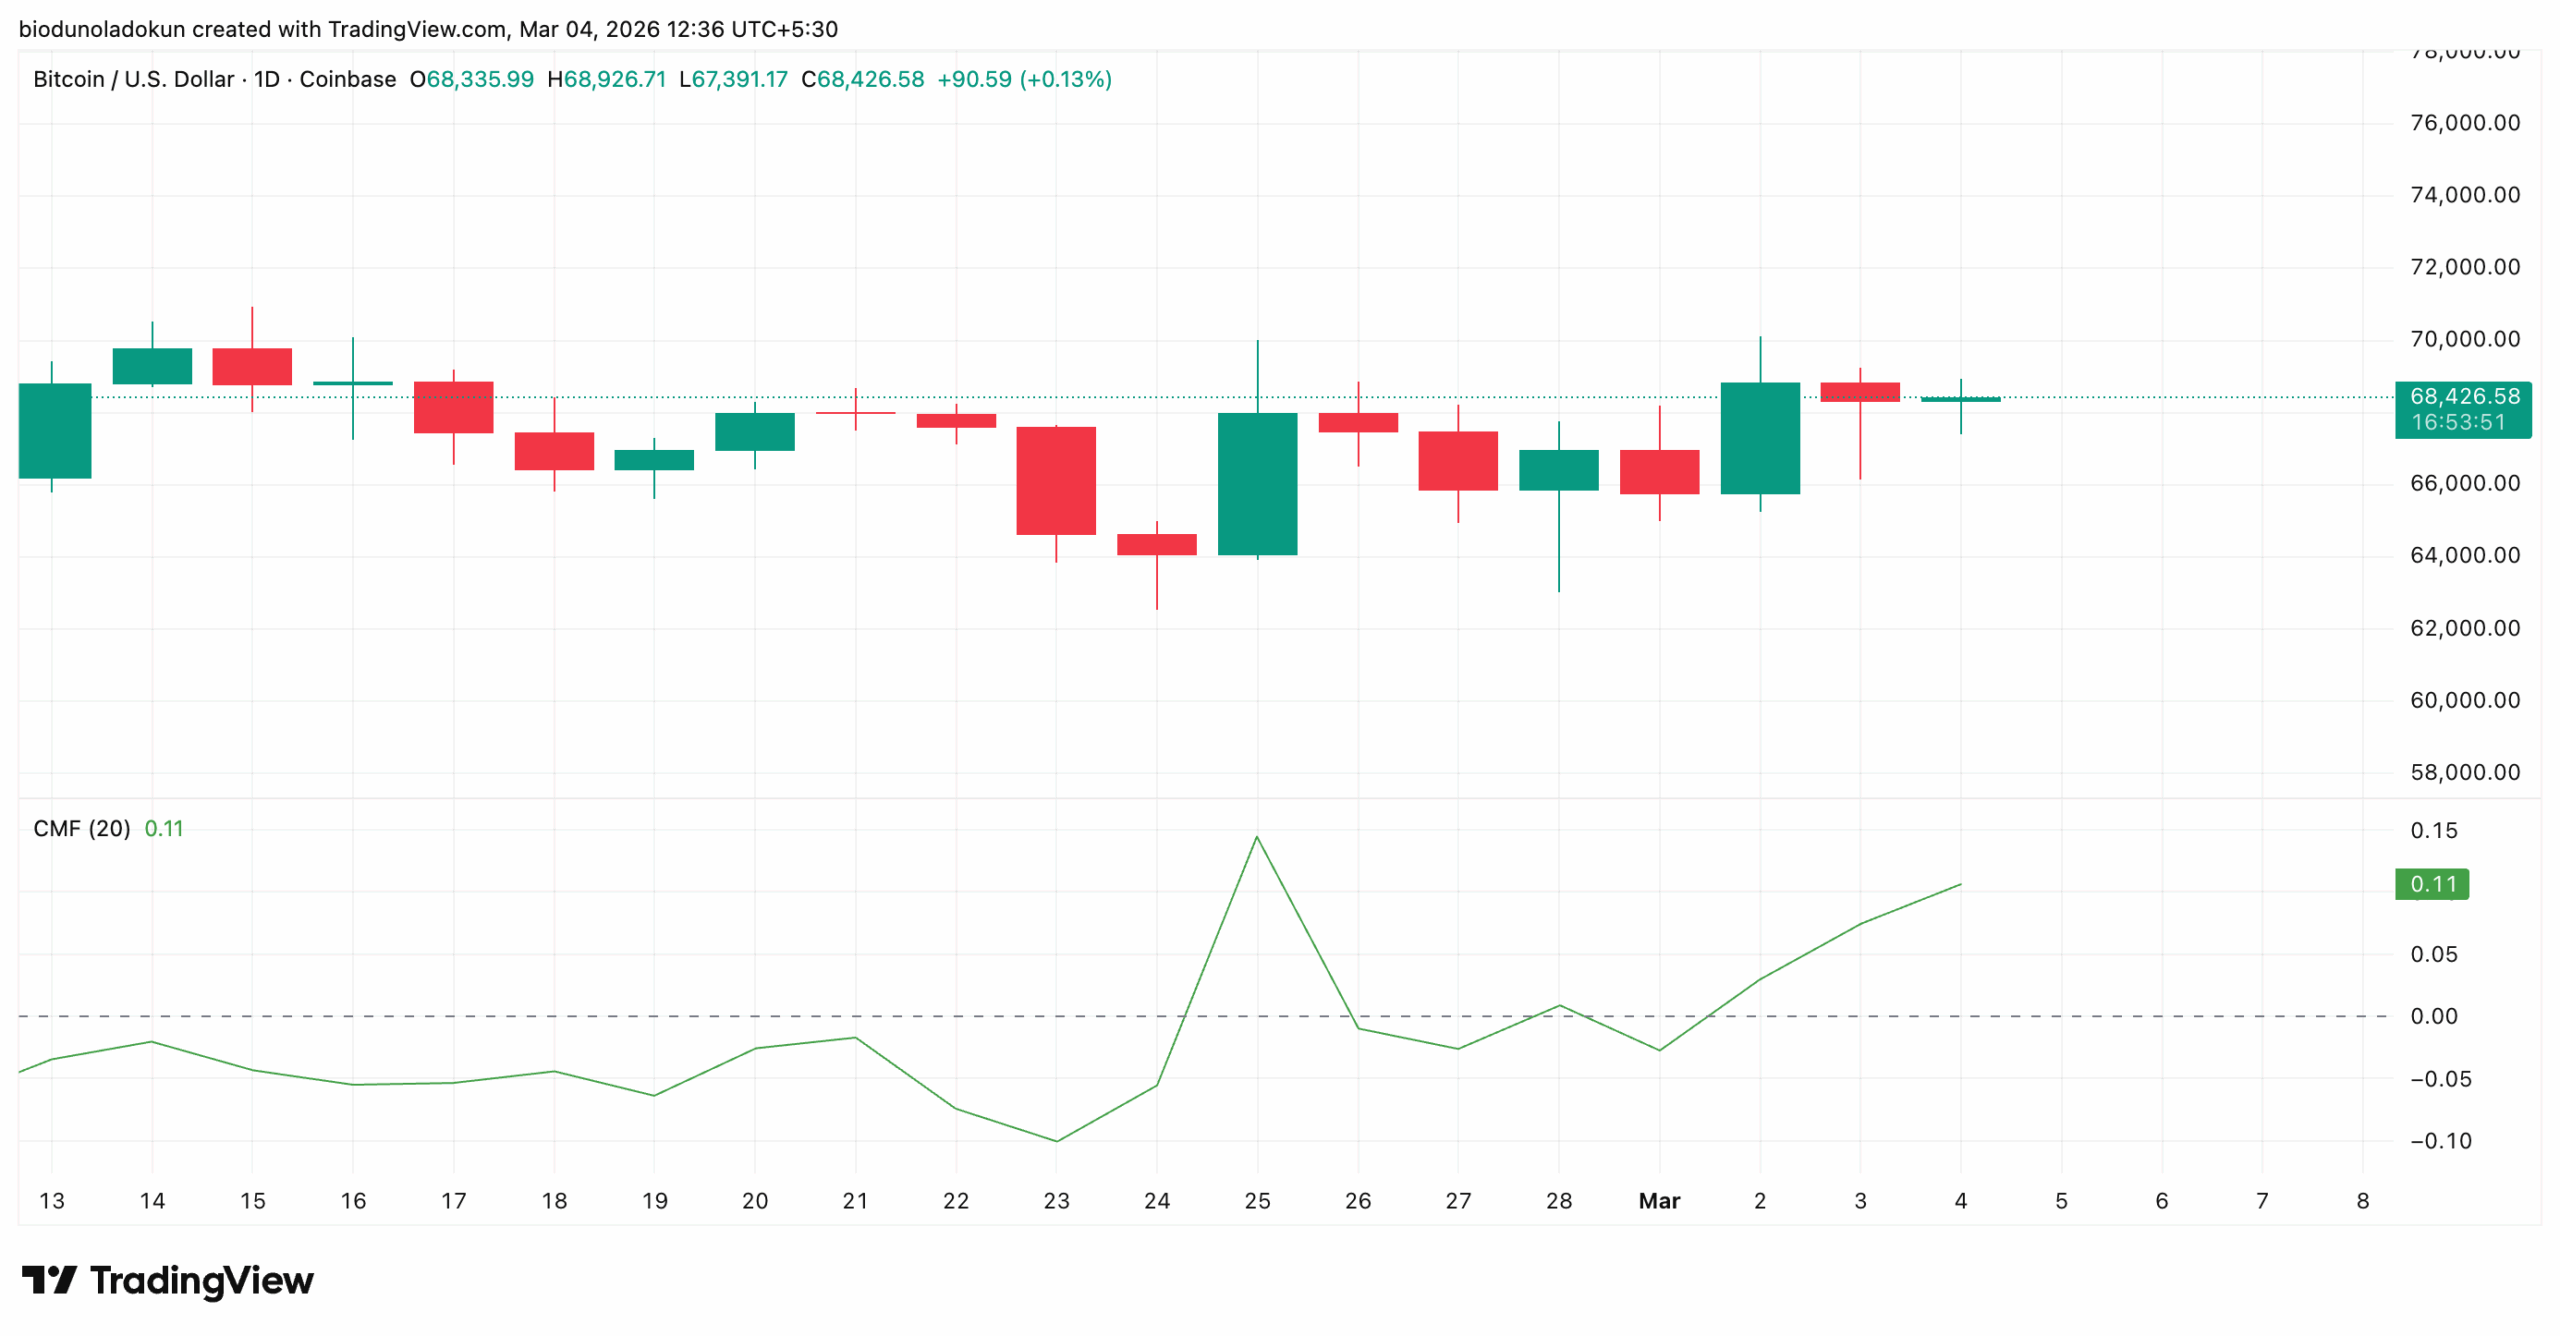
Despite poor market sentiment, quiet accumulation is emerging, with BTC’s Chaikin Money Flow forming a bullish divergence even as prices slide.
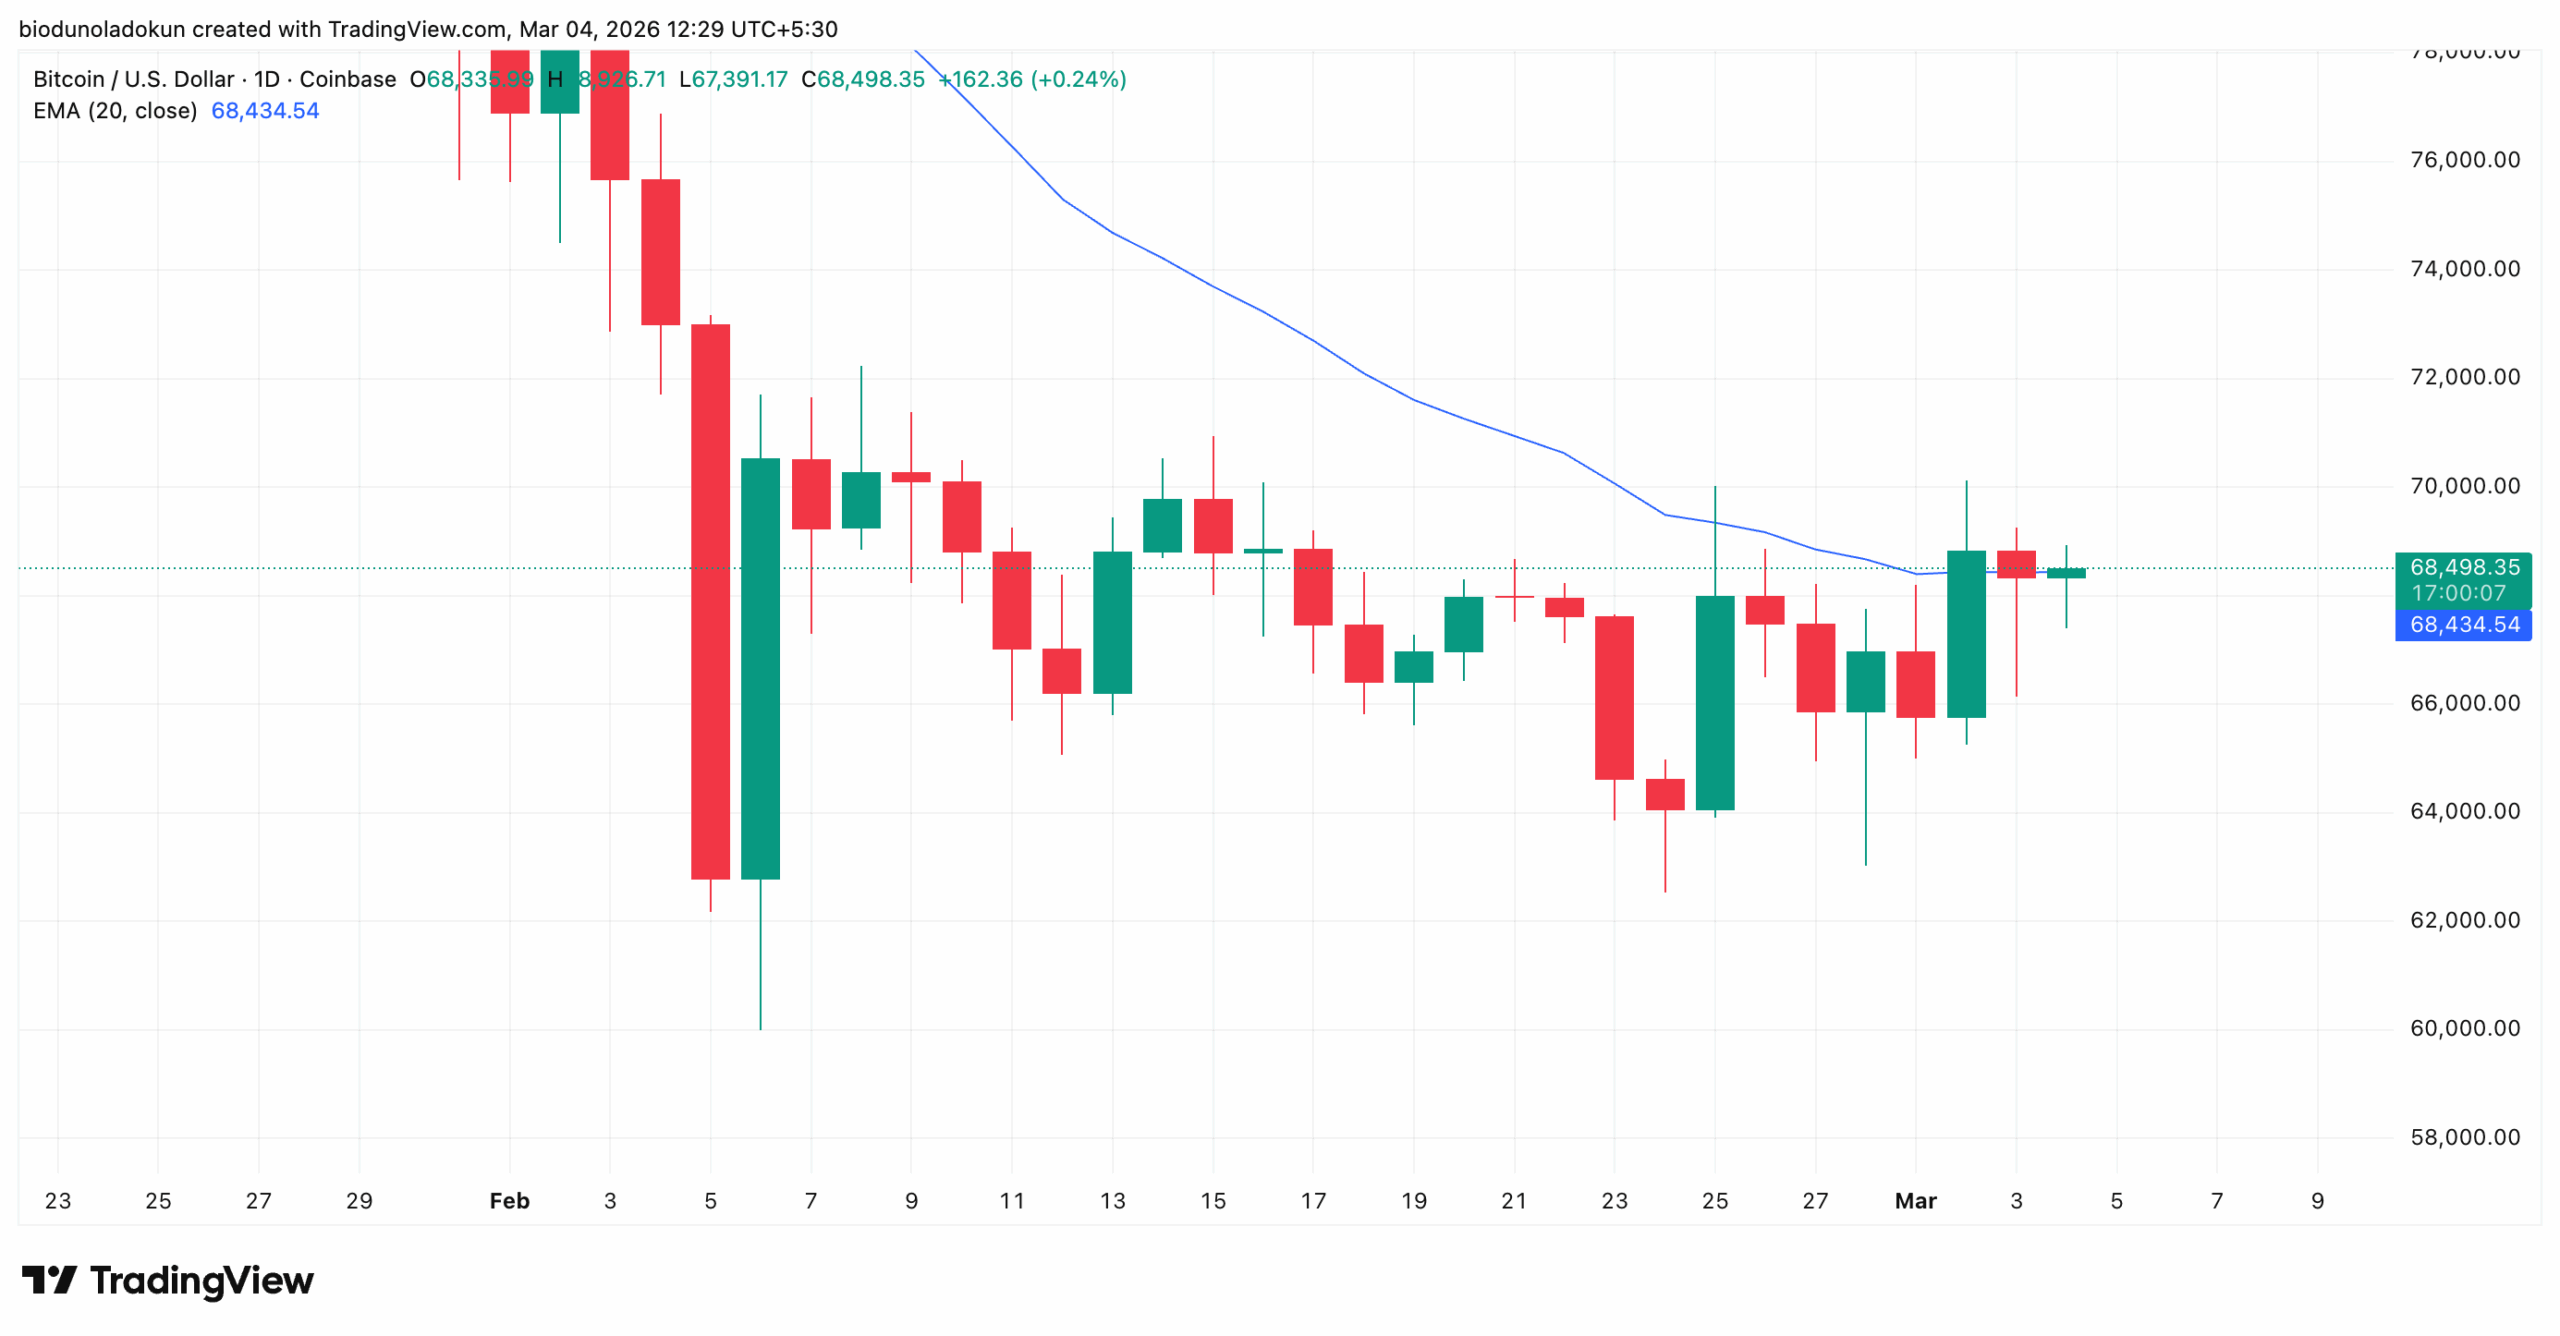
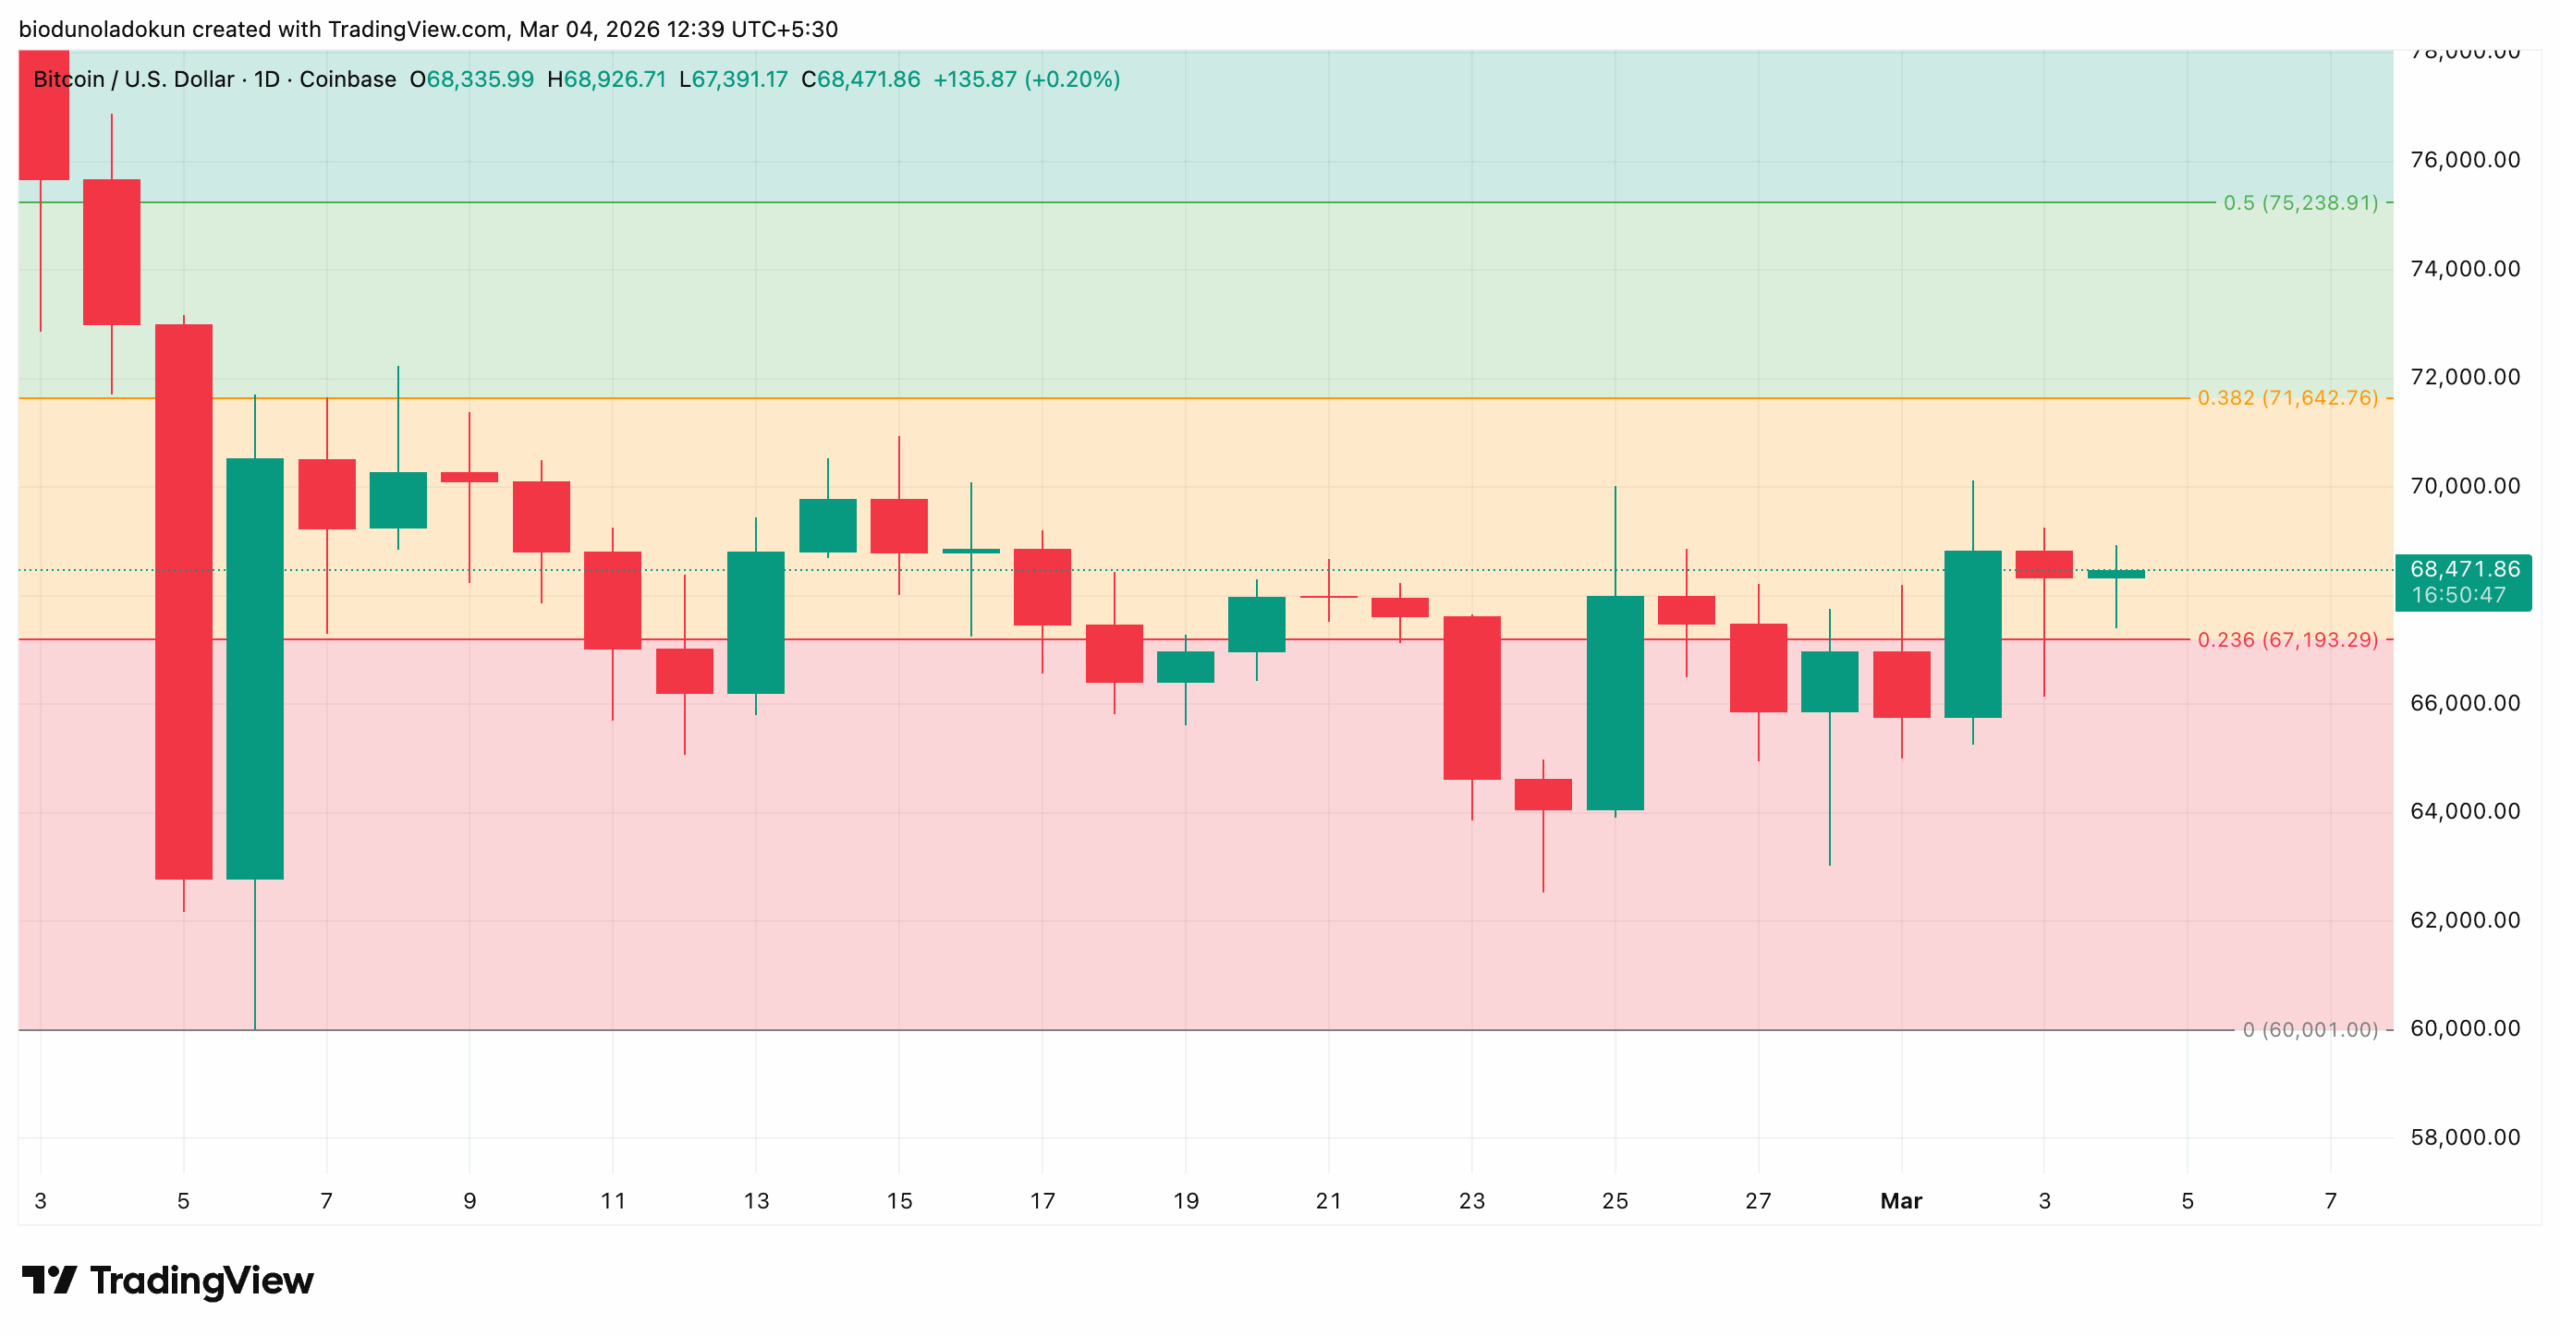
Bitcoin trades above its 20-day EMA at $68,434, with upside targets at $71,642 and $75,238 — but a failure to hold could send the coin toward $60,001 before Q1 closes.
March has seen a marked uptick in Bitcoin sell-offs by miners on the network, on-chain data shows.
The trend follows the coin’s extended sideways price movement throughout February. This stretch was further complicated in the month’s final days by the outbreak of geopolitical conflict in the Middle East, which has since dampened broader market sentiment.
With these key network participants now moving to offload their holdings, the question is what this signals for Bitcoin as Q1 2026 enters its final month.
On-Chain Data Reveals Mounting Miner Distribution
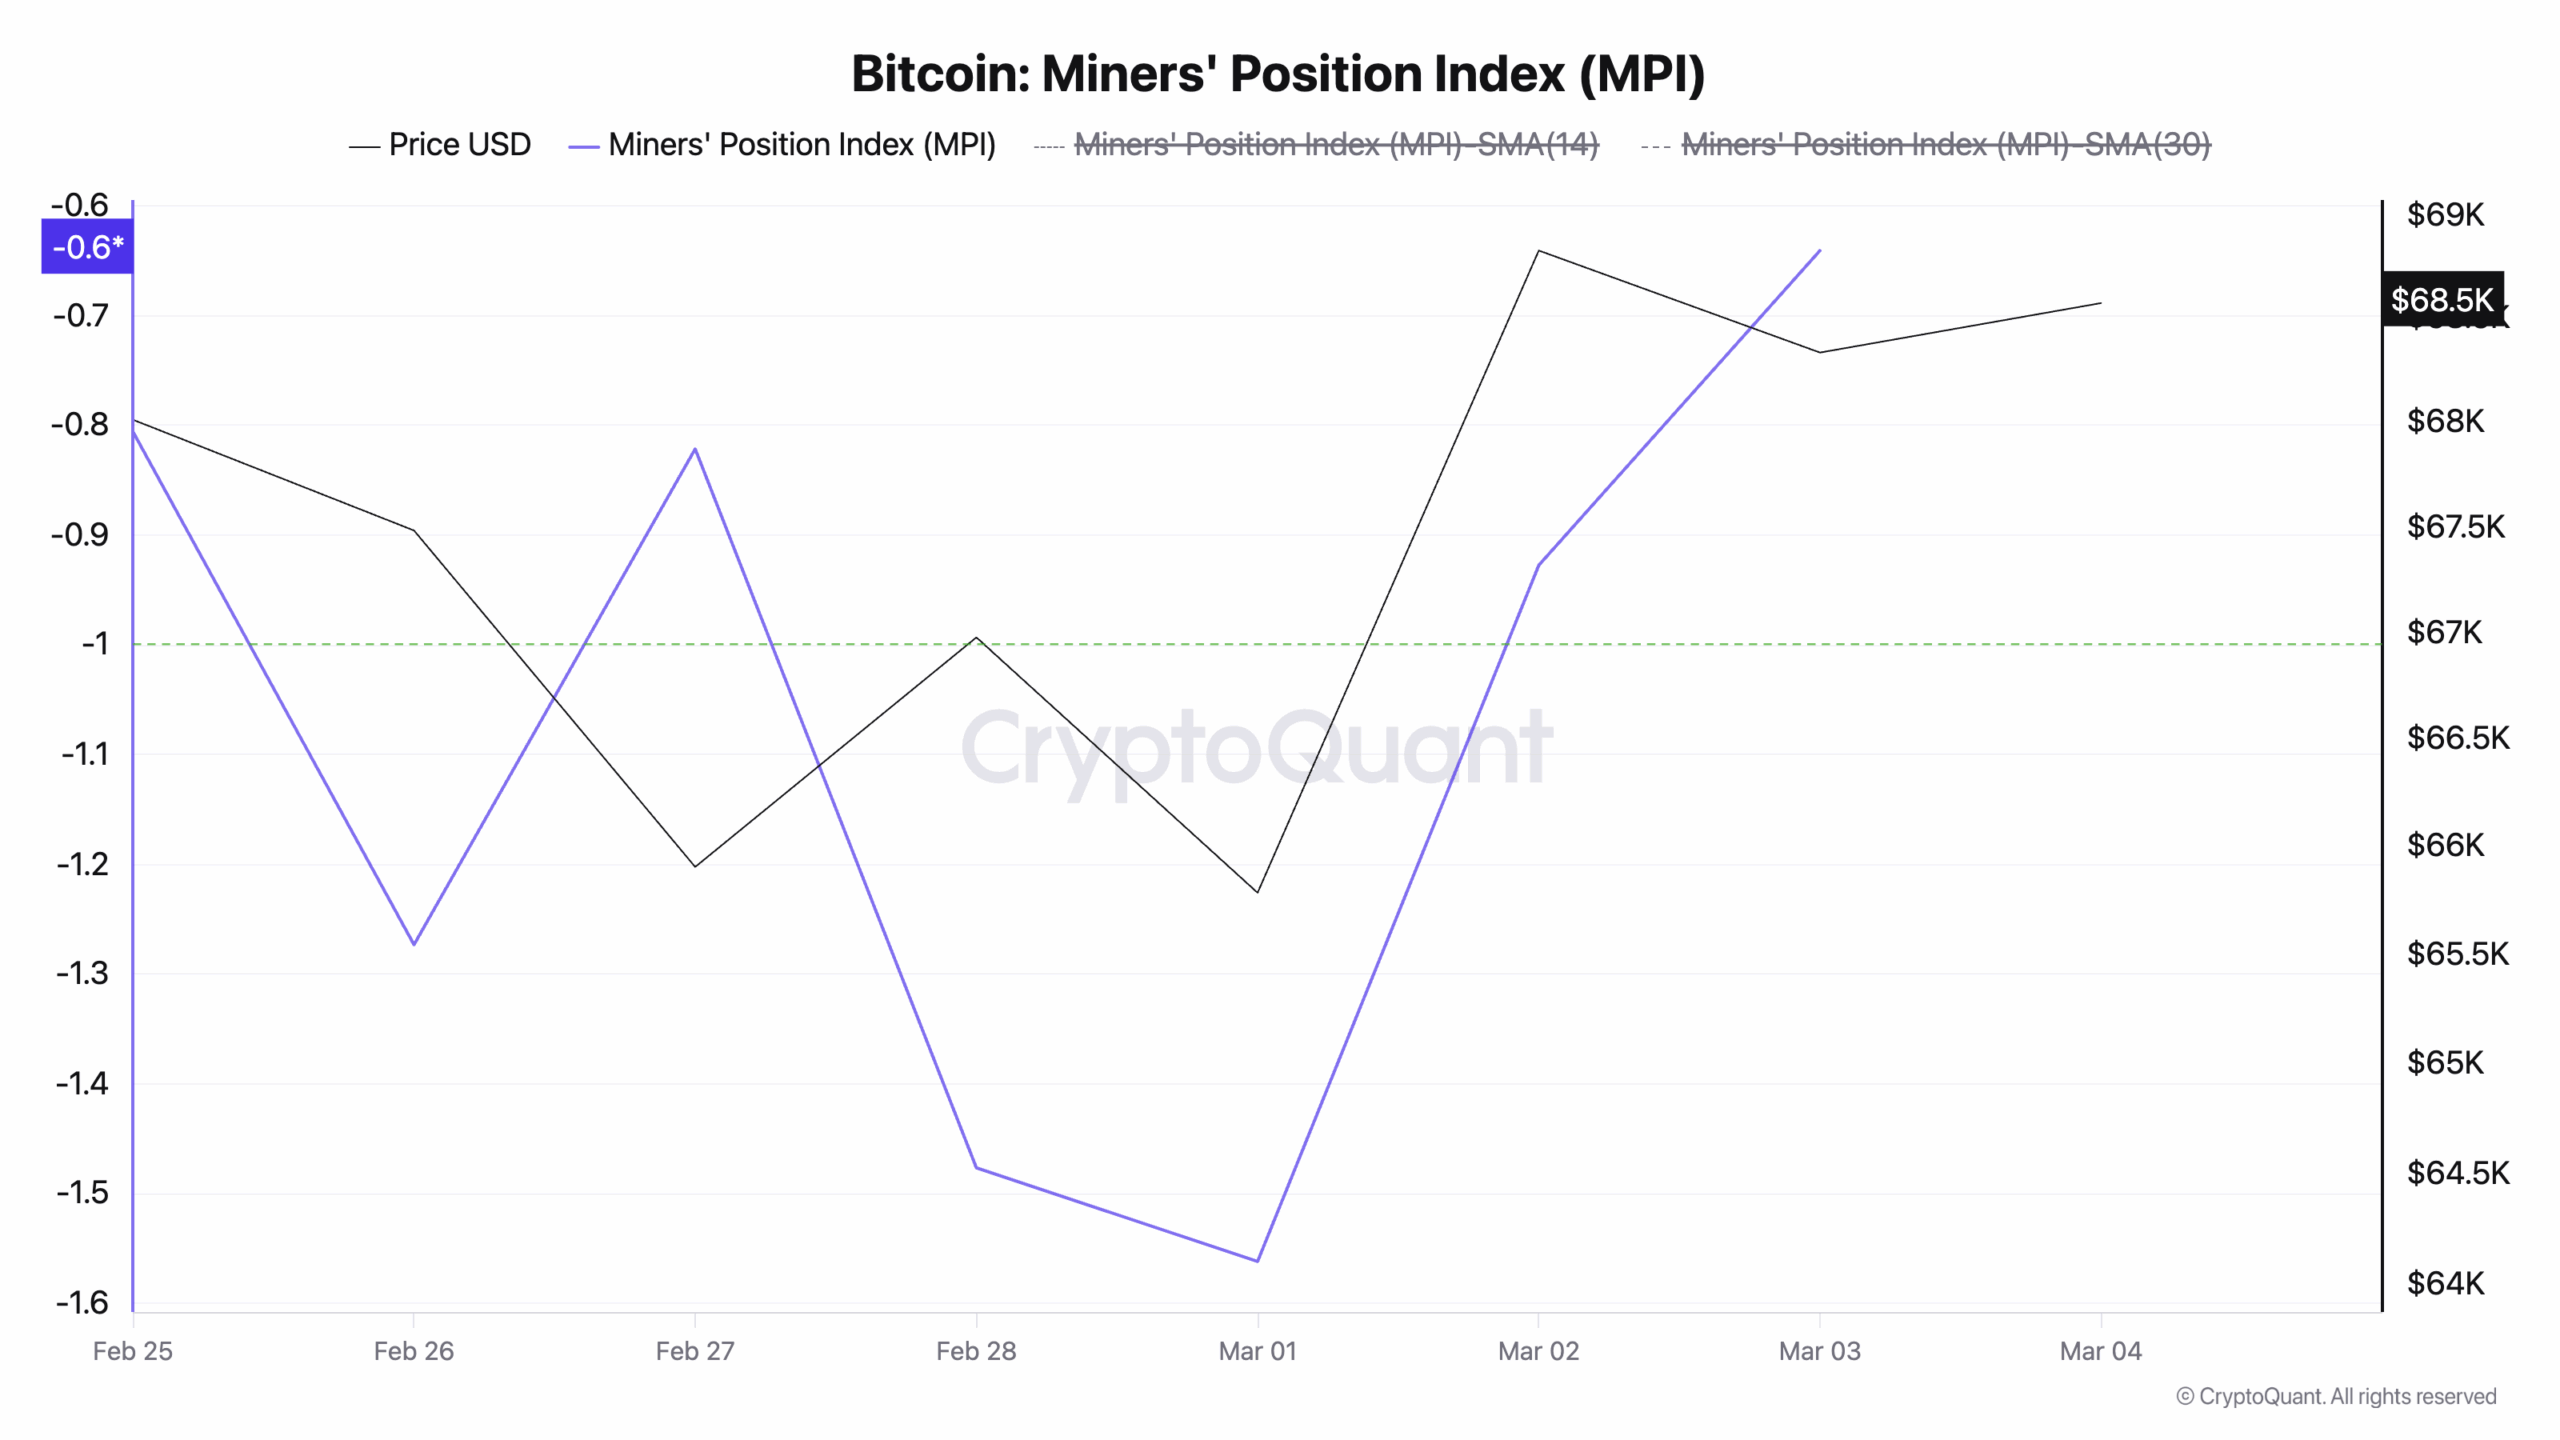
Two on-chain indicators have clearly captured this shift in miner holding behaviour. The first is the coin’s Miners’ Position Index (MPI), which has soared 59% since March 1. At press time, this metric sits at a seven-day high of -0.64.
Bitcoin Miners’ Position Index | Credit: CryptoQuant
The MPI measures the ratio of miner outflows to their one-year moving average. A falling MPI signals that miners are accumulating or holding.
On the other hand, when it climbs like this, it suggests increased selling pressure from miners, indicating they may be offloading coins in anticipation of a market downturn.
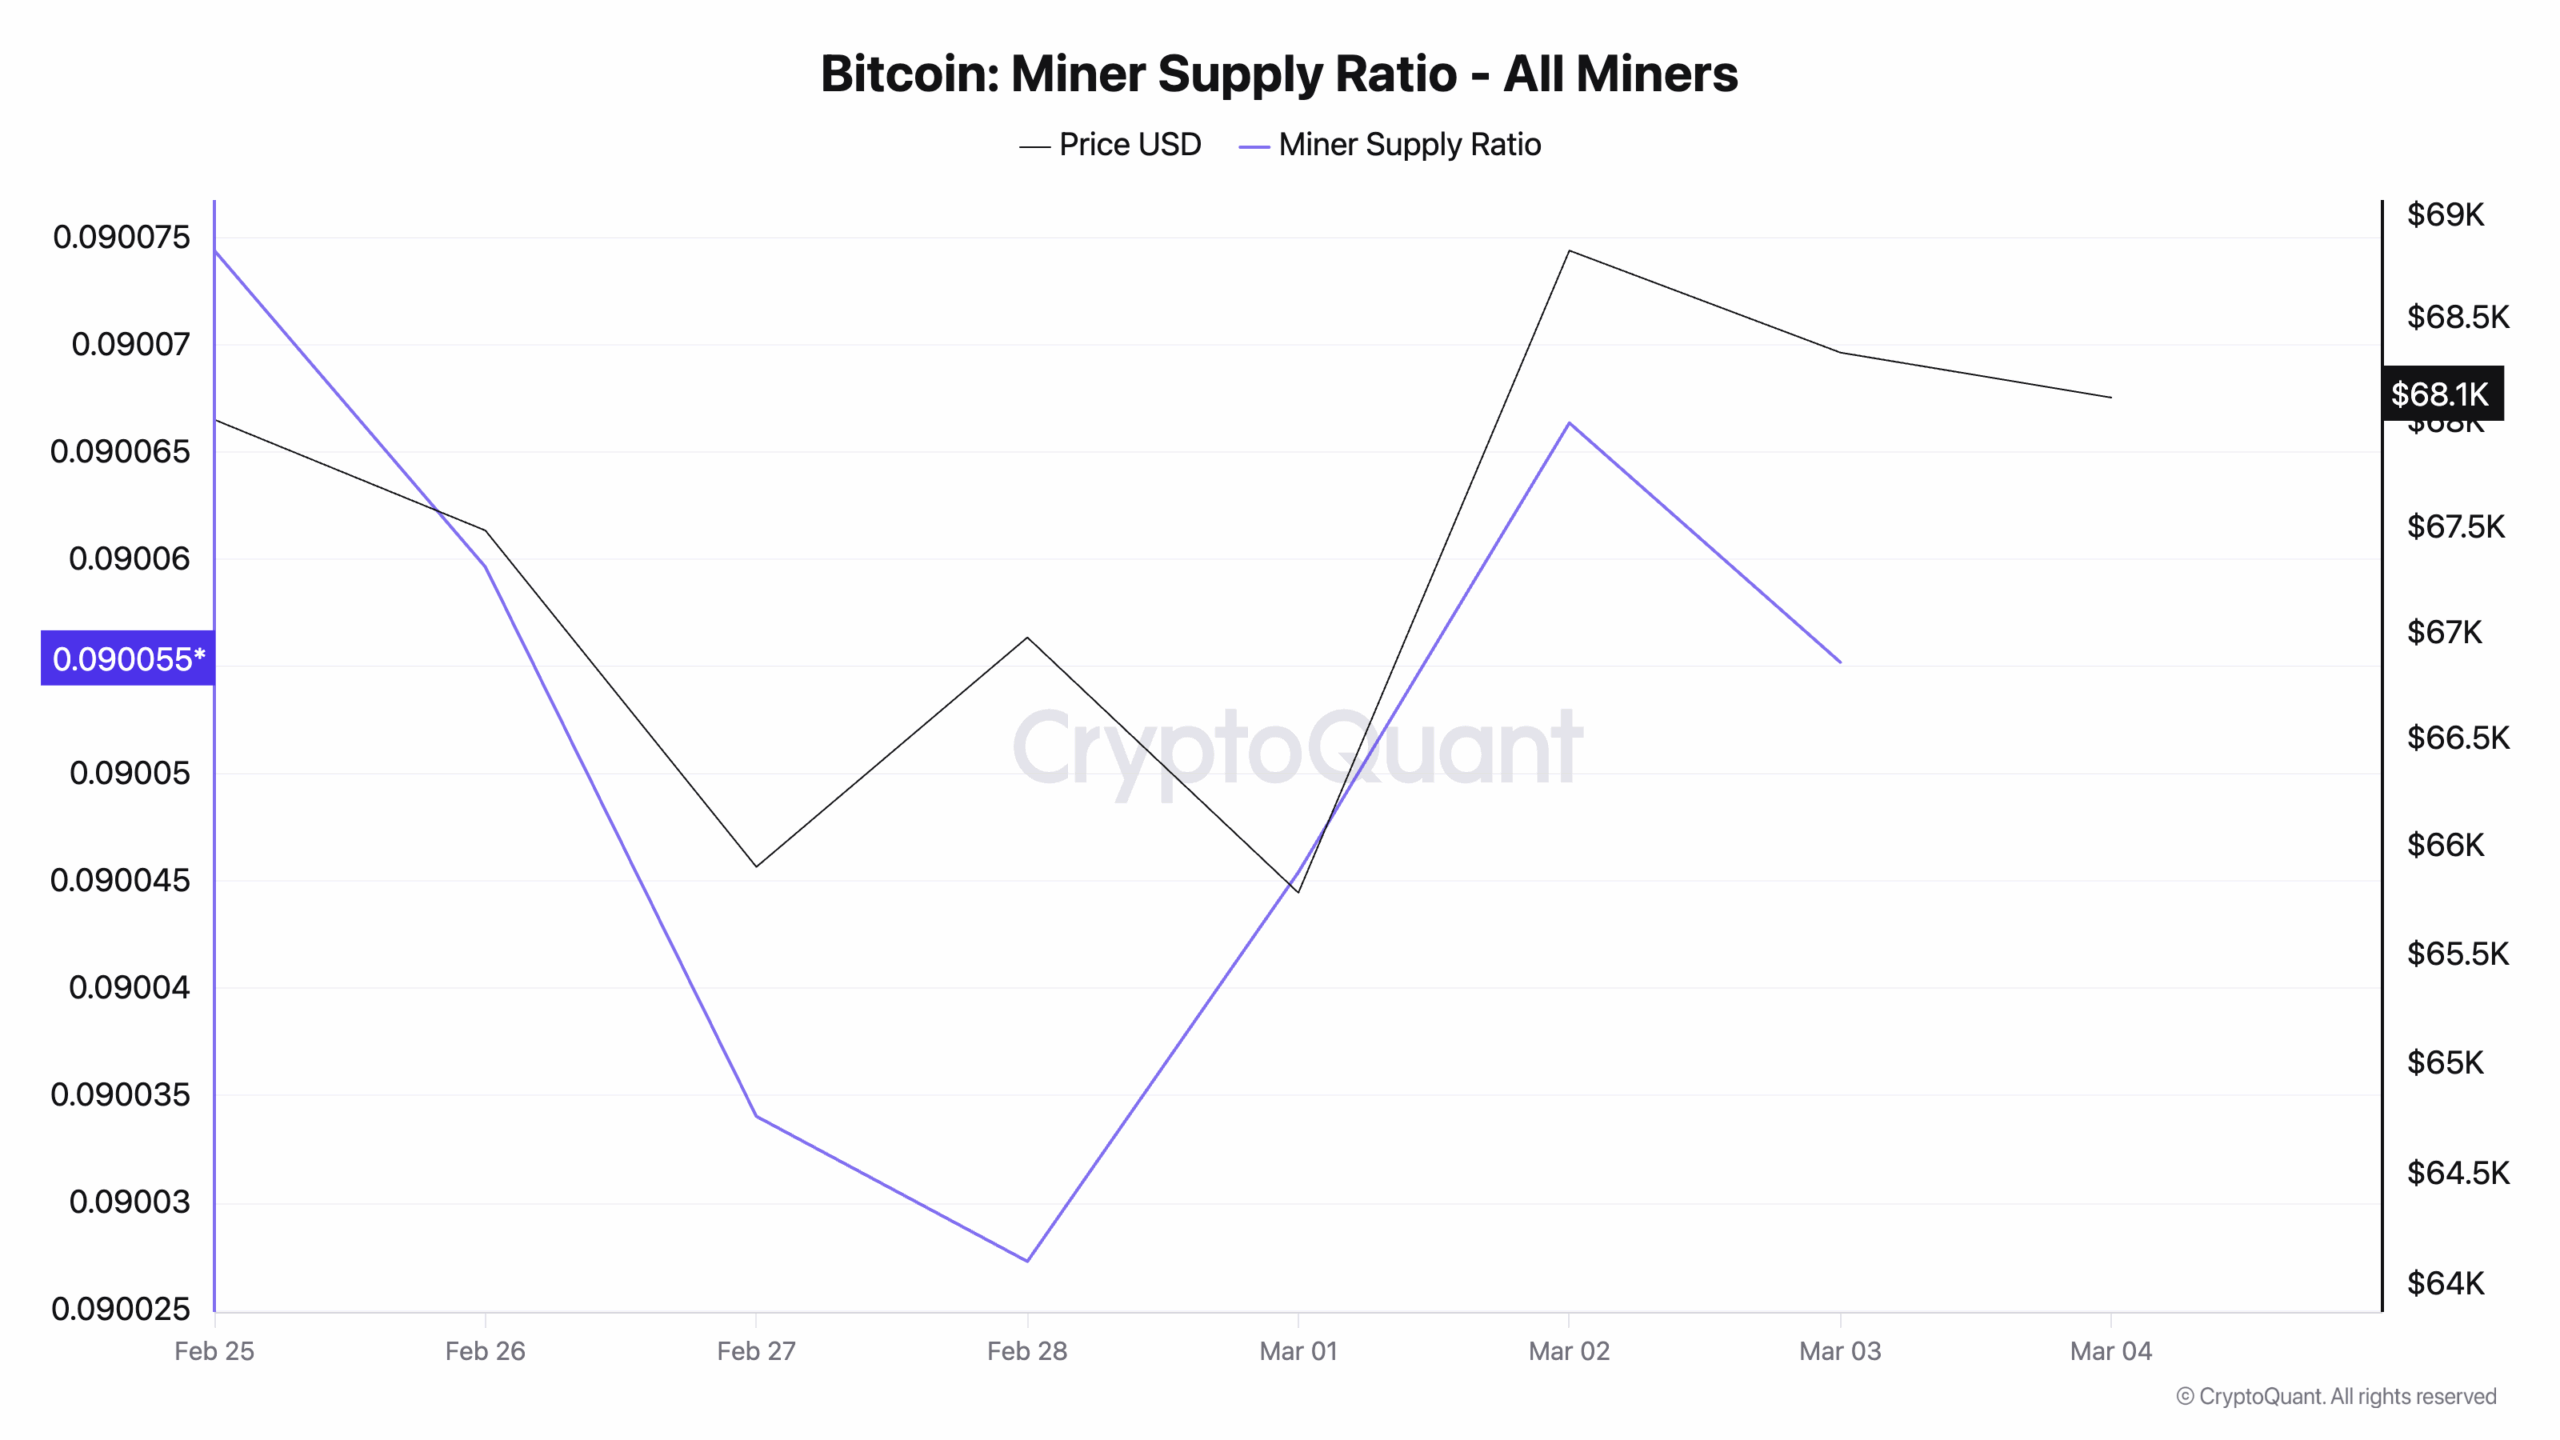
Furthermore, the decline in BTC’s Miners’ Supply Ratio confirms that their holdings are actively shrinking. Per CryptoQuant, this metric has trended downwards since March 2, and is currently pegged at 0.09.
BTC’s Miners’ Supply Ratio tracks the proportion of the total supply of coins held by miners relative to the broader circulating supply. It measures the number of coins remaining in miner wallets at any given time.
When the ratio rises, it signals that miners are choosing to hold their coins rather than sending them to exchanges.
This is broadly seen as a bullish signal, reflecting confidence in higher future prices and reducing the immediate sell-side pressure on the market.
Conversely, when the ratio falls, as is the current trend, miners are moving coins out of their wallets in preparation for selloffs.
This introduces new supply into the market, but without the corresponding demand to absorb it. Should this trend persist, Bitcoin may face continued headwinds in the near term.
Sellers Are Loud, But Buyers Are Busy
Interestingly, while the broader market sentiment remains poor, with many participants adopting a “wait-and-see” approach, some market players have begun quietly accumulating — a trend that may counter miners’ sell-offs and help stabilize BTC’s price in the near term.
Readings from the coin’s Chaikin Money Flow (CMF) confirm this bullish outlook. While BTC’s price has closed at a new low since March 1, this key momentum indicator has trended upward, forming a bullish divergence.
The CMF indicator measures the flow of capital into and out of an asset. When its value is positive, even as an asset’s price falls, it means capital is quietly moving into the asset.
Buyers are absorbing sell pressure rather than fleeing from it.
Usually, this divergence precedes a price reversal, as the rising demand signaled by the CMF eventually drives prices higher.
In addition, BTC now trades above its 20-day exponential moving average (EMA), highlighting a gradual uptick in new demand for the king coin.
At press time, this moving average provides dynamic support at $68,434.
The 20-day EMA measures an asset’s average price over the past 20 trading sessions, giving more weight to recent prices.
When the price remains below this line, it signals that bears maintain control, and short-term sentiment is tilted toward the downside.
Conversely, when an asset trades above the 20-day EMA line, the market favors accumulation and is attempting to drive prices higher.
Bitcoin Price Prediction
Should this quiet accumulation trend persist in the BTC market, it could push the price toward $71,642. A breach of this zone could open the door to a rally toward $75,238.
However, if miner distribution volume grows and new demand falls, the coin risks breaking below its critical support at $67,193 and falling toward $60,001 as March nears its end.
Disclaimer:
The information provided in this article is for informational purposes only. It is not intended to be, nor should it be construed as, financial advice. We do not make any warranties regarding the completeness, reliability, or accuracy of this information. All investments involve risk, and past performance does not guarantee future results. We recommend consulting a financial advisor before making any investment decisions.
Abiodun Oladokun is a Research Analyst at CCN, where he covers cryptocurrency markets with a focus on on-chain analysis, technical assessments, and emerging trends across decentralized finance (DeFi), real-world assets (RWA), artificial intelligence (AI), decentralized physical infrastructure networks (DePIN), Layer 2s, and meme coins.
Prior to CCN, he served as a Senior On-Chain Analyst at BeInCrypto, producing market reports spanning diverse crypto sectors.
Before that, he conducted technical analysis and market assessments of various altcoins at AMBCrypto, where he also contributed long-form quarterly research papers on DeFi, NFTs, DAOs, and scaling architectures, leveraging on-chain platforms including Messari, Santiment, DefiLlama, and Dune Analytics.
He began his crypto career as a research analyst at SixthSense DAO, developing blockchain forensic tools to trace the history of stolen assets.
Abiodun is a lawyer called to the Nigerian Bar and the founder of Ilé Ijó, a Lagos-based electronic dance music collective.