BTC steady after volatility | Credit: Derek Fenech
Share
Key Takeaways
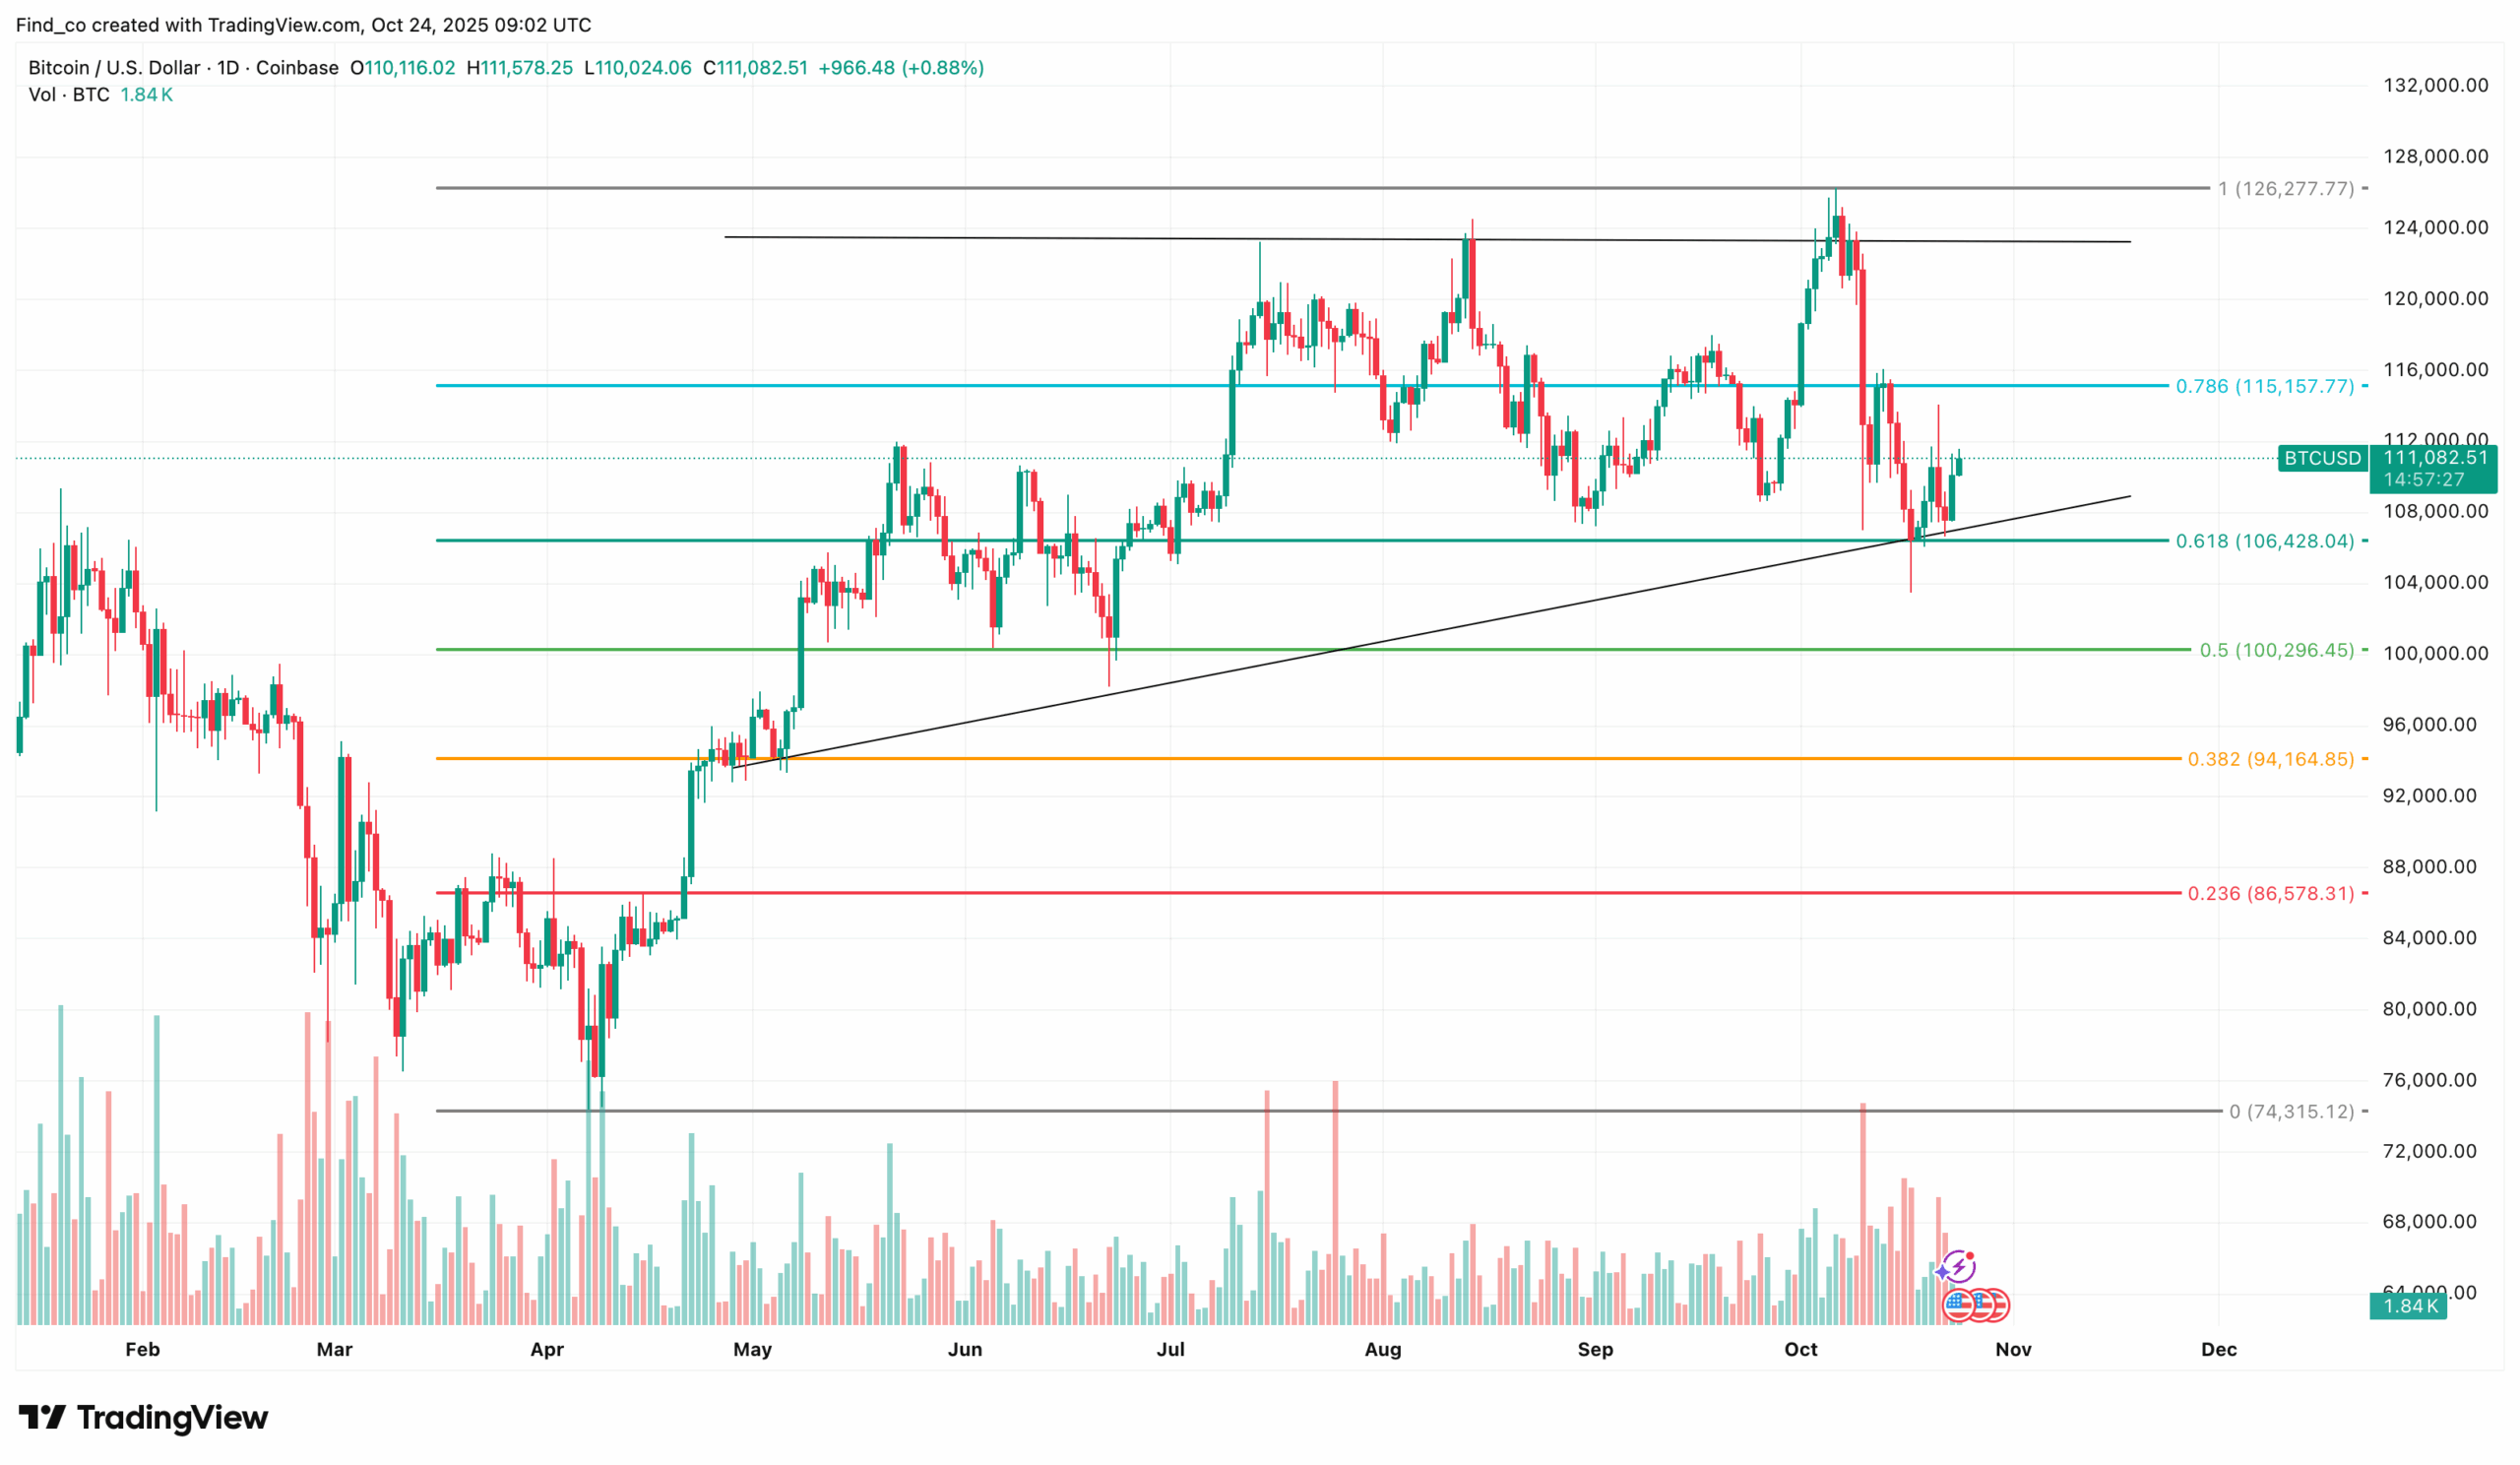
Bitcoin continues to hold key support near $105,971, signaling bullish resilience.
A move above $113,545 could trigger a rally, with CPI likely influencing direction.
Failure to defend key support may lead to consolidation or a short-term correction.
After a wild week of whipsaws, Bitcoin’s (BTC) price chart points north again.
For most of the week, volatility tested Bitcoin. However, it appears that the bulls are not blinking.
With key supports holding firm, here is why BTC looks set to make another run toward the $120,000.
Bitcoin Defies Bears
On the 4-hour chart, Bitcoin’s price is trading within a descending triangle, which typically indicates a bullish structure.
However, a strong support zone near $105,971 has so far held firm, effectively invalidating the immediate downside bias.
Get These Top Crypto Casino Offers Now!
Sponsored
Disclosure
We sometimes use affiliate links in our content, when clicking on those we might receive a commission at no extra cost to you. By using this website you agree to our terms and conditions and privacy policy.
Given this resilience, BTC appears ready to break above the pattern’s upper trendline, potentially targeting the next resistance at $113,545.
Supporting this view, Holder Sentiment, which has remained mostly negative since October 10, is now flirting with the zero signal line. This change in position suggests bearish bias is fading, and market sentiment may soon turn neutral or positive.
In combination with the strong support at $105,971, this structure strengthens the likelihood of a breakout above the $113,545 resistance.
CPI to Light the Fuse?
Beyond technical factors, today’s upcoming release of the Consumer Price Index (CPI) could also influence Bitcoin’s next move.
A lower-than-expected CPI would suggest cooling inflation, likely supporting a bullish breakout.
However, a higher reading could pressure risk assets, potentially triggering a correction or forcing BTC into a short-term downtrend as traders price in tighter monetary expectations.
“BTC has reclaimed the $110,000 support level. CPI data will be released today, and it’ll decide the next move for Bitcoin. I’m currently looking for BTC to reclaim the $113,000 to $114,000 level for more upside. But if this pump turns out to be a fakeout like the past ones, expect another sharp correction,” Ted Pillows, Investor, and entrepreneur at CypherHunter, opined.
BTC Price Analysis: Bulls Regain Control
On the daily chart, Bitcoin’s price has formed a megaphone pattern that typically signals increasing volatility.
Disclaimer:
The information provided in this article is for informational purposes only. It is not intended to be, nor should it be construed as, financial advice. We do not make any warranties regarding the completeness, reliability, or accuracy of this information. All investments involve risk, and past performance does not guarantee future results. We recommend consulting a financial advisor before making any investment decisions.
Victor Olanrewaju is a crypto analyst and reporter at CCN with deep roots in on-chain research and technical analysis. His crypto journey began in 2017, but it was the 2020 Uniswap airdrop that sparked a full-time pivot into the space.
With a foundation in copywriting, Victor honed his craft creating high-converting content for leading crypto brokers — most notably an XRP price prediction that ranked #1 on Google during the 2021 bull run.
He later joined AMBCrypto in 2022, where he combined storytelling with technical and on-chain analysis to cover key market narratives.
In 2024, he expanded his expertise at BeInCrypto, collaborating with analysts and using tools like Glassnode, Santiment, and IntoTheBlock to break down Bitcoin and altcoin trends.
At CCN, Victor covers the top cryptocurrencies, memecoins, macro shifts, blending real-time insights with deep-dive metrics.
He holds a Bachelor’s degree in Physics from the University of Ibadan, equipping him to simplify complex data for a wide audience. Follow his work or connect on LinkedIn or X.