Bitcoin doesn’t trade on 20M coins, but just on 3M available on exchanges. Here’s how marginal supply and spot demand really drive BTC price. | Credit: CCN.com
Share
Key Takeaways
Bitcoin briefly dropped to $63,000 after a joint U.S.-Israel attack on Iranian targets but quickly rebounded, closing near $67K on February 28.
Significant inflows into BTC ETFs on March 2 suggest that institutional investors are still bullish on Bitcoin despite global tensions.
Despite strong on-chain data, Bitcoin’s technical indicators point to bearish trends, with resistance at $70,000 and a risk of a drop to $65,000 or lower.
Following a joint U.S. and Israeli strike on Iranian targets last weekend, Bitcoin’s (BTC) value plunged momentarily.
On February 28, when the first attack was launched, the king coin dropped to an intraday low of $63,108 before rallying to close near $67,049 that same day.
Despite the initial price dip and Iran’s subsequent retaliatory attacks across the Gulf, on-chain data suggests a resilient underlying interest in BTC.
This signals the possibility of a break above the horizontal channel that has kept the coin’s price capped since early February.
Wall Street Stays Bullish Amid Market Volatility
While tension continues to escalate in global markets, institutional players seem to view the volatility as a buying opportunity rather than a reason to exit.
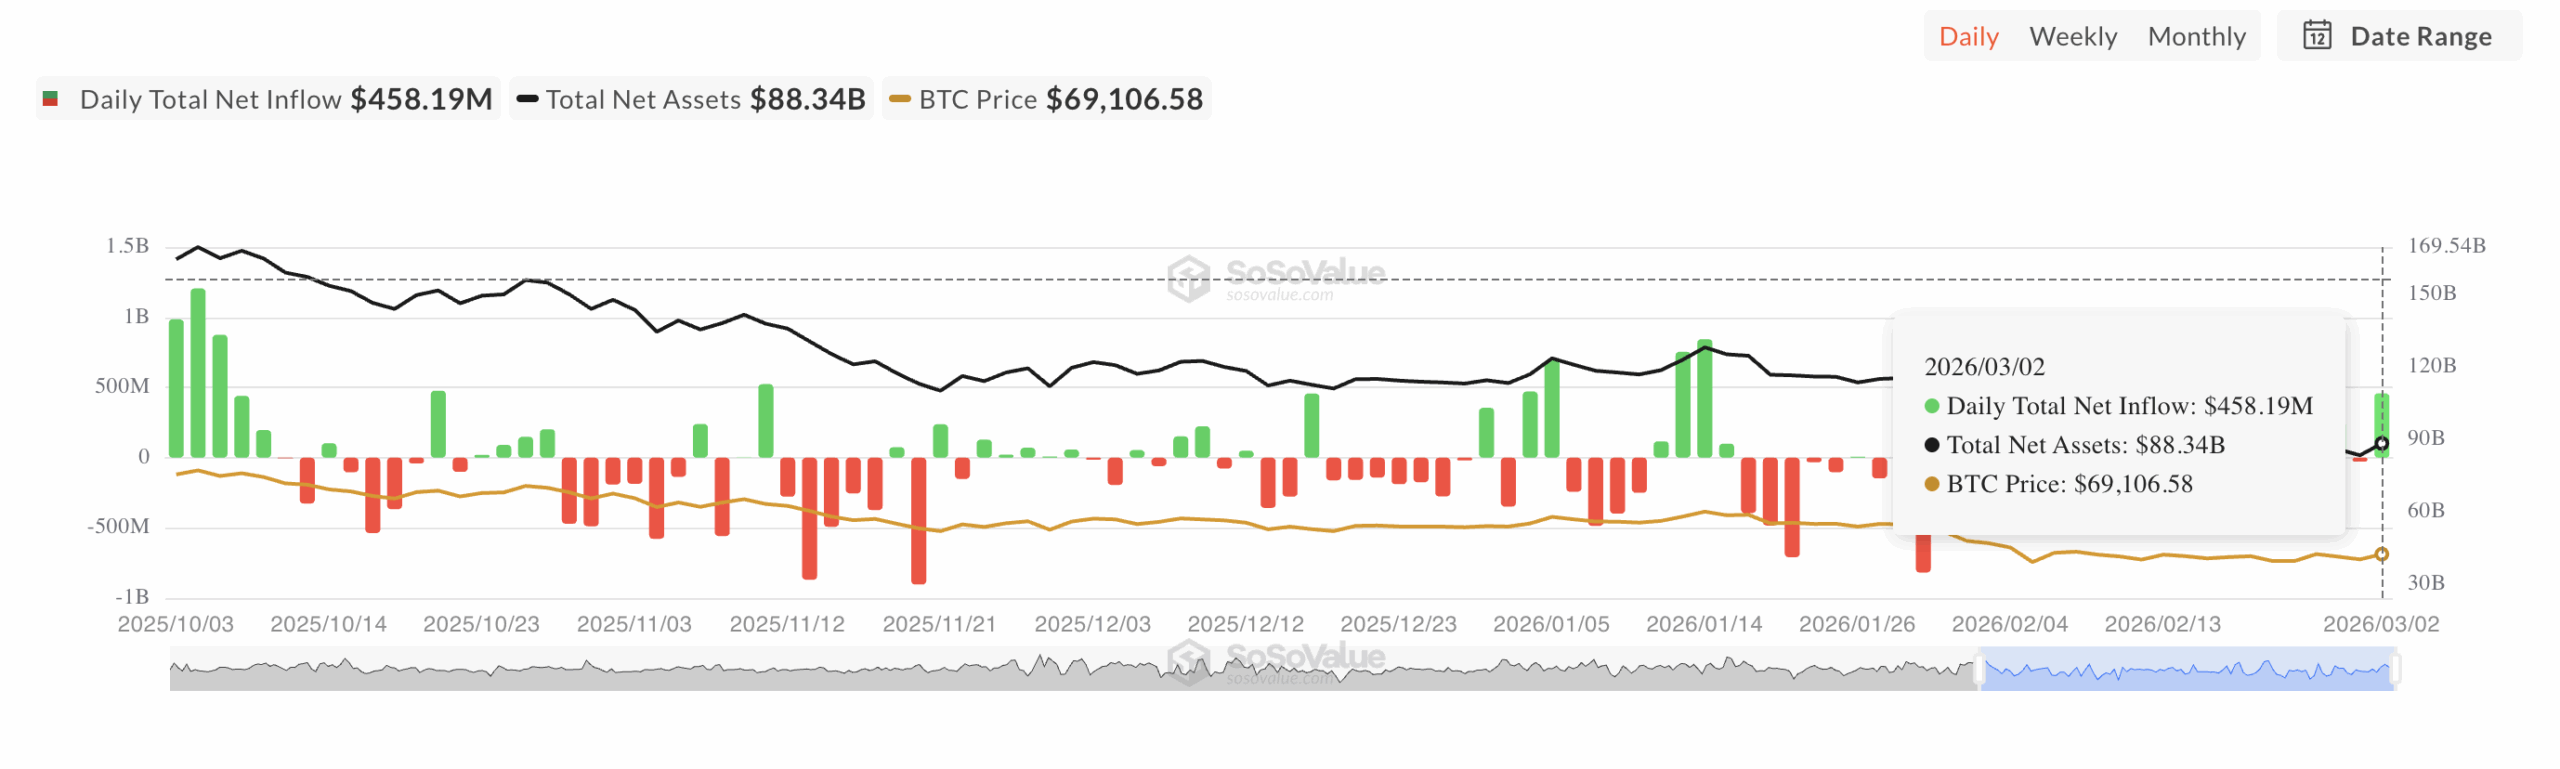
On March 2, net inflows into BTC spot exchange-traded fund (ETFs) totaled $458.19 million.
Total Bitcoin Spot ETF Net Inflow | Credit: SosoValue
Per SosoValue, none of the 12 active ETFs recorded a net outflow yesterday. This signaling renewed confidence among “smart money” investors that BTC’s value could rise soon, even as the ongoing war and resulting volatility continue to unsettle the broader market.
This show of confidence from institutional holders could also help improve retail sentiment. This is because when large funds continue allocating capital despite macro headwinds, smaller investors often interpret it as a signal of underlying strength.
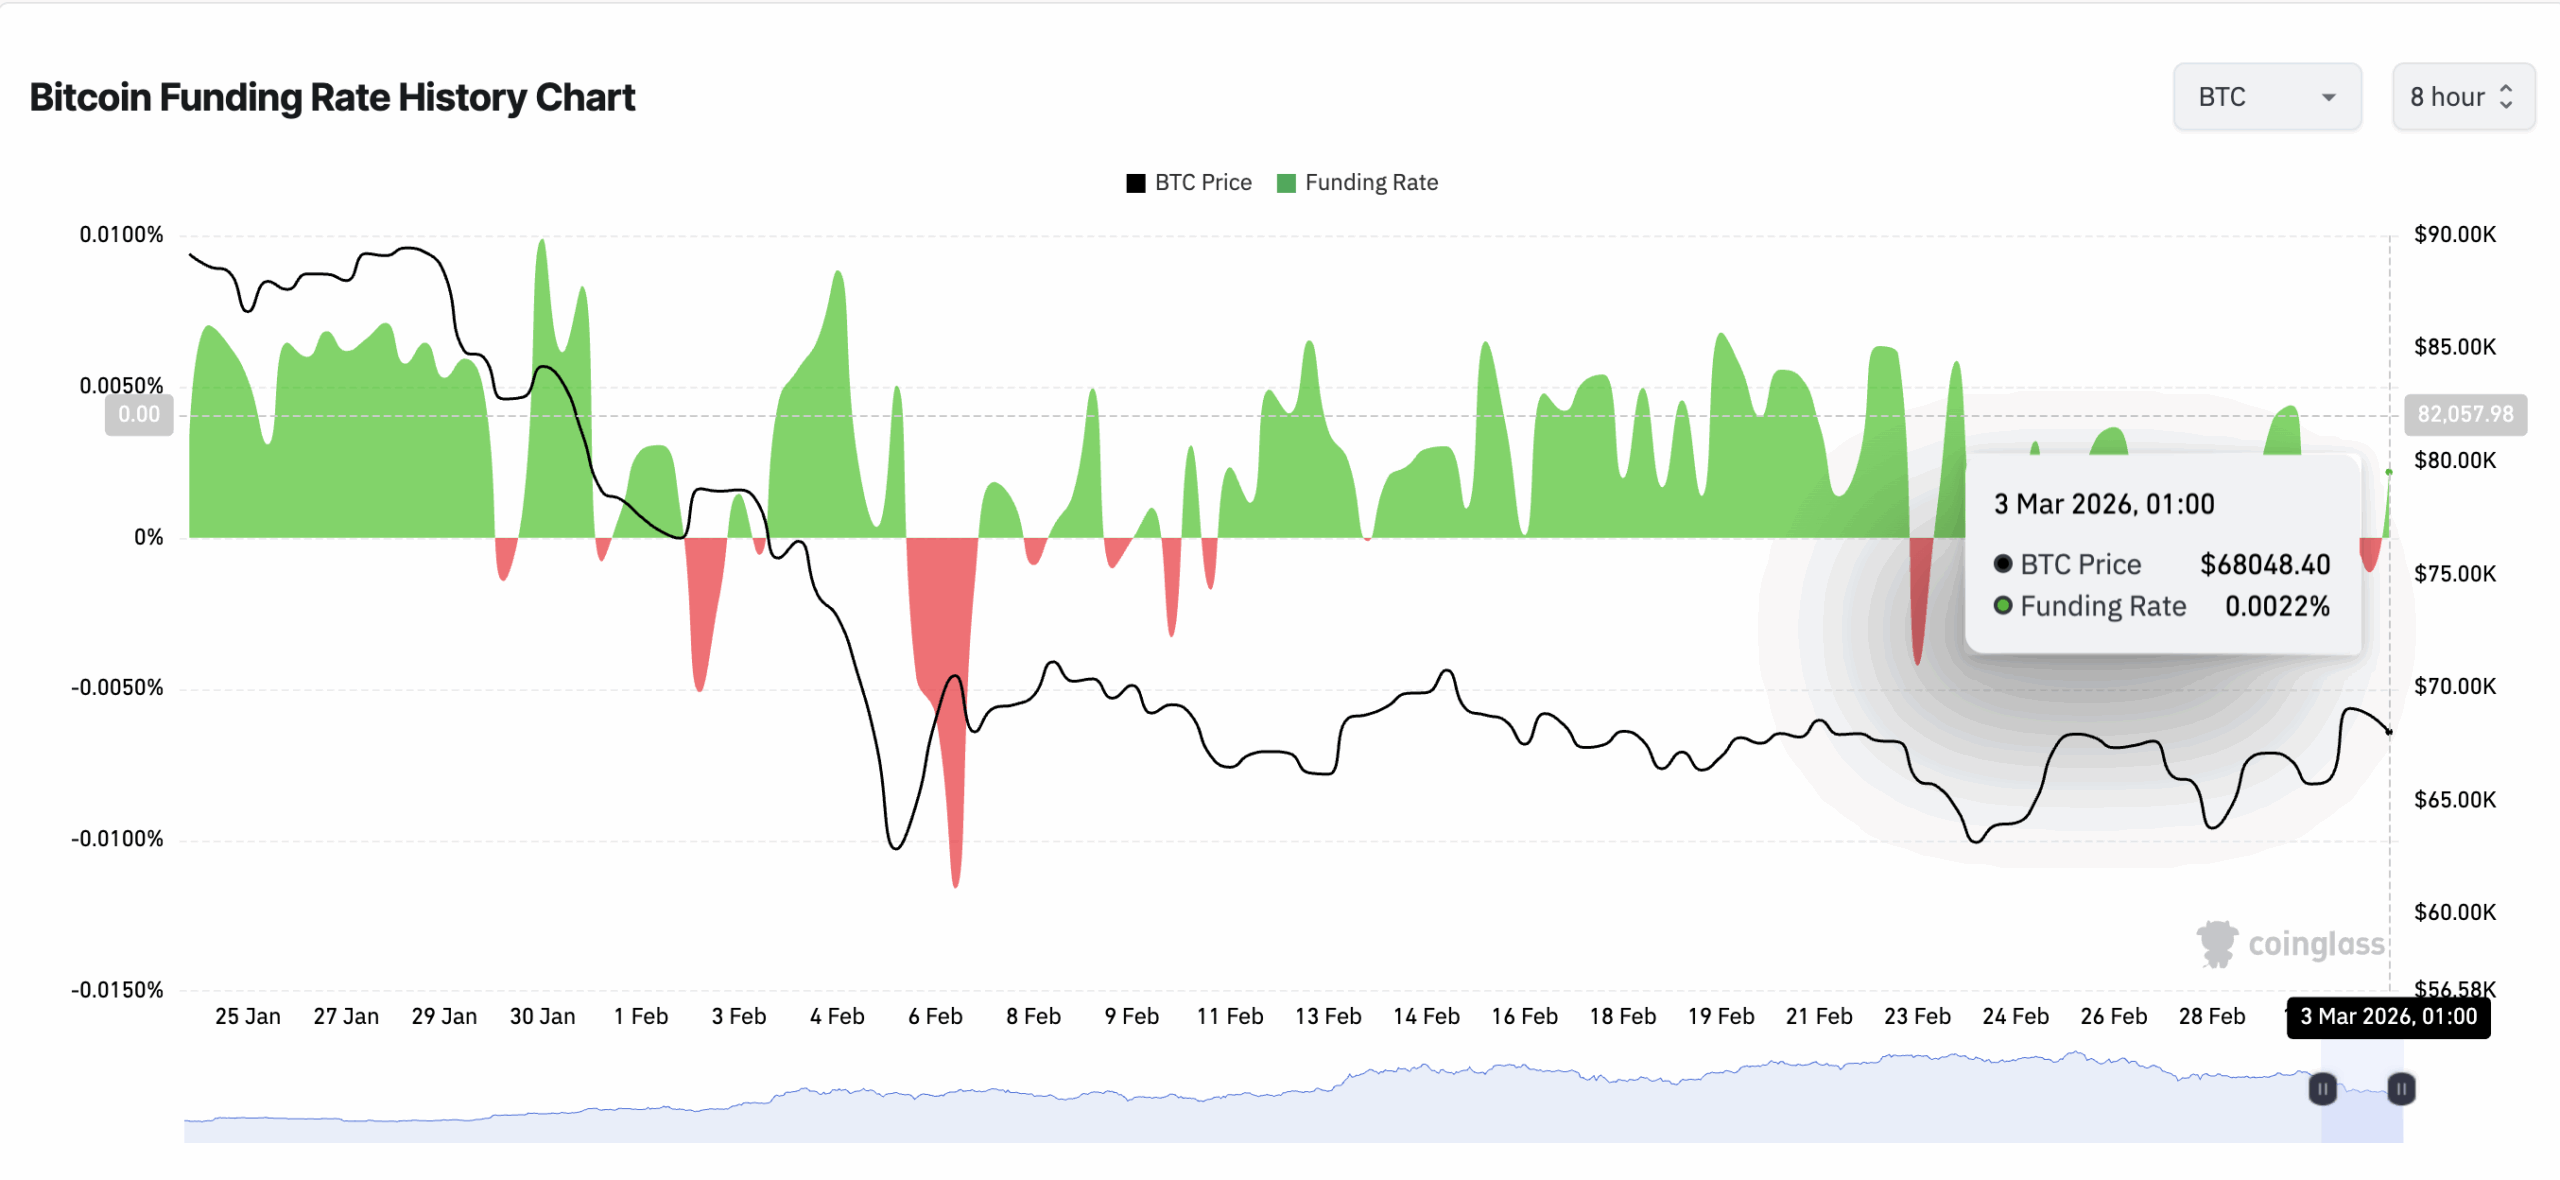
Furthermore, today’s trading session has seen BTC’s funding rate flip back into positive territory. According to Coignlass, this currently stands at 0.0022%.
An asset’s funding rate is the periodic payment between traders in perpetual futures contracts to keep its contract price aligned with the spot price.
A positive funding rate indicates higher demand for long positions. This, combined with sustained ETF inflows, suggests that BTC traders are increasingly positioning for a near-term upside, which could occur if this momentum continues.
BTC On-Chain Data Looks Bullish, But the Chart Disagrees
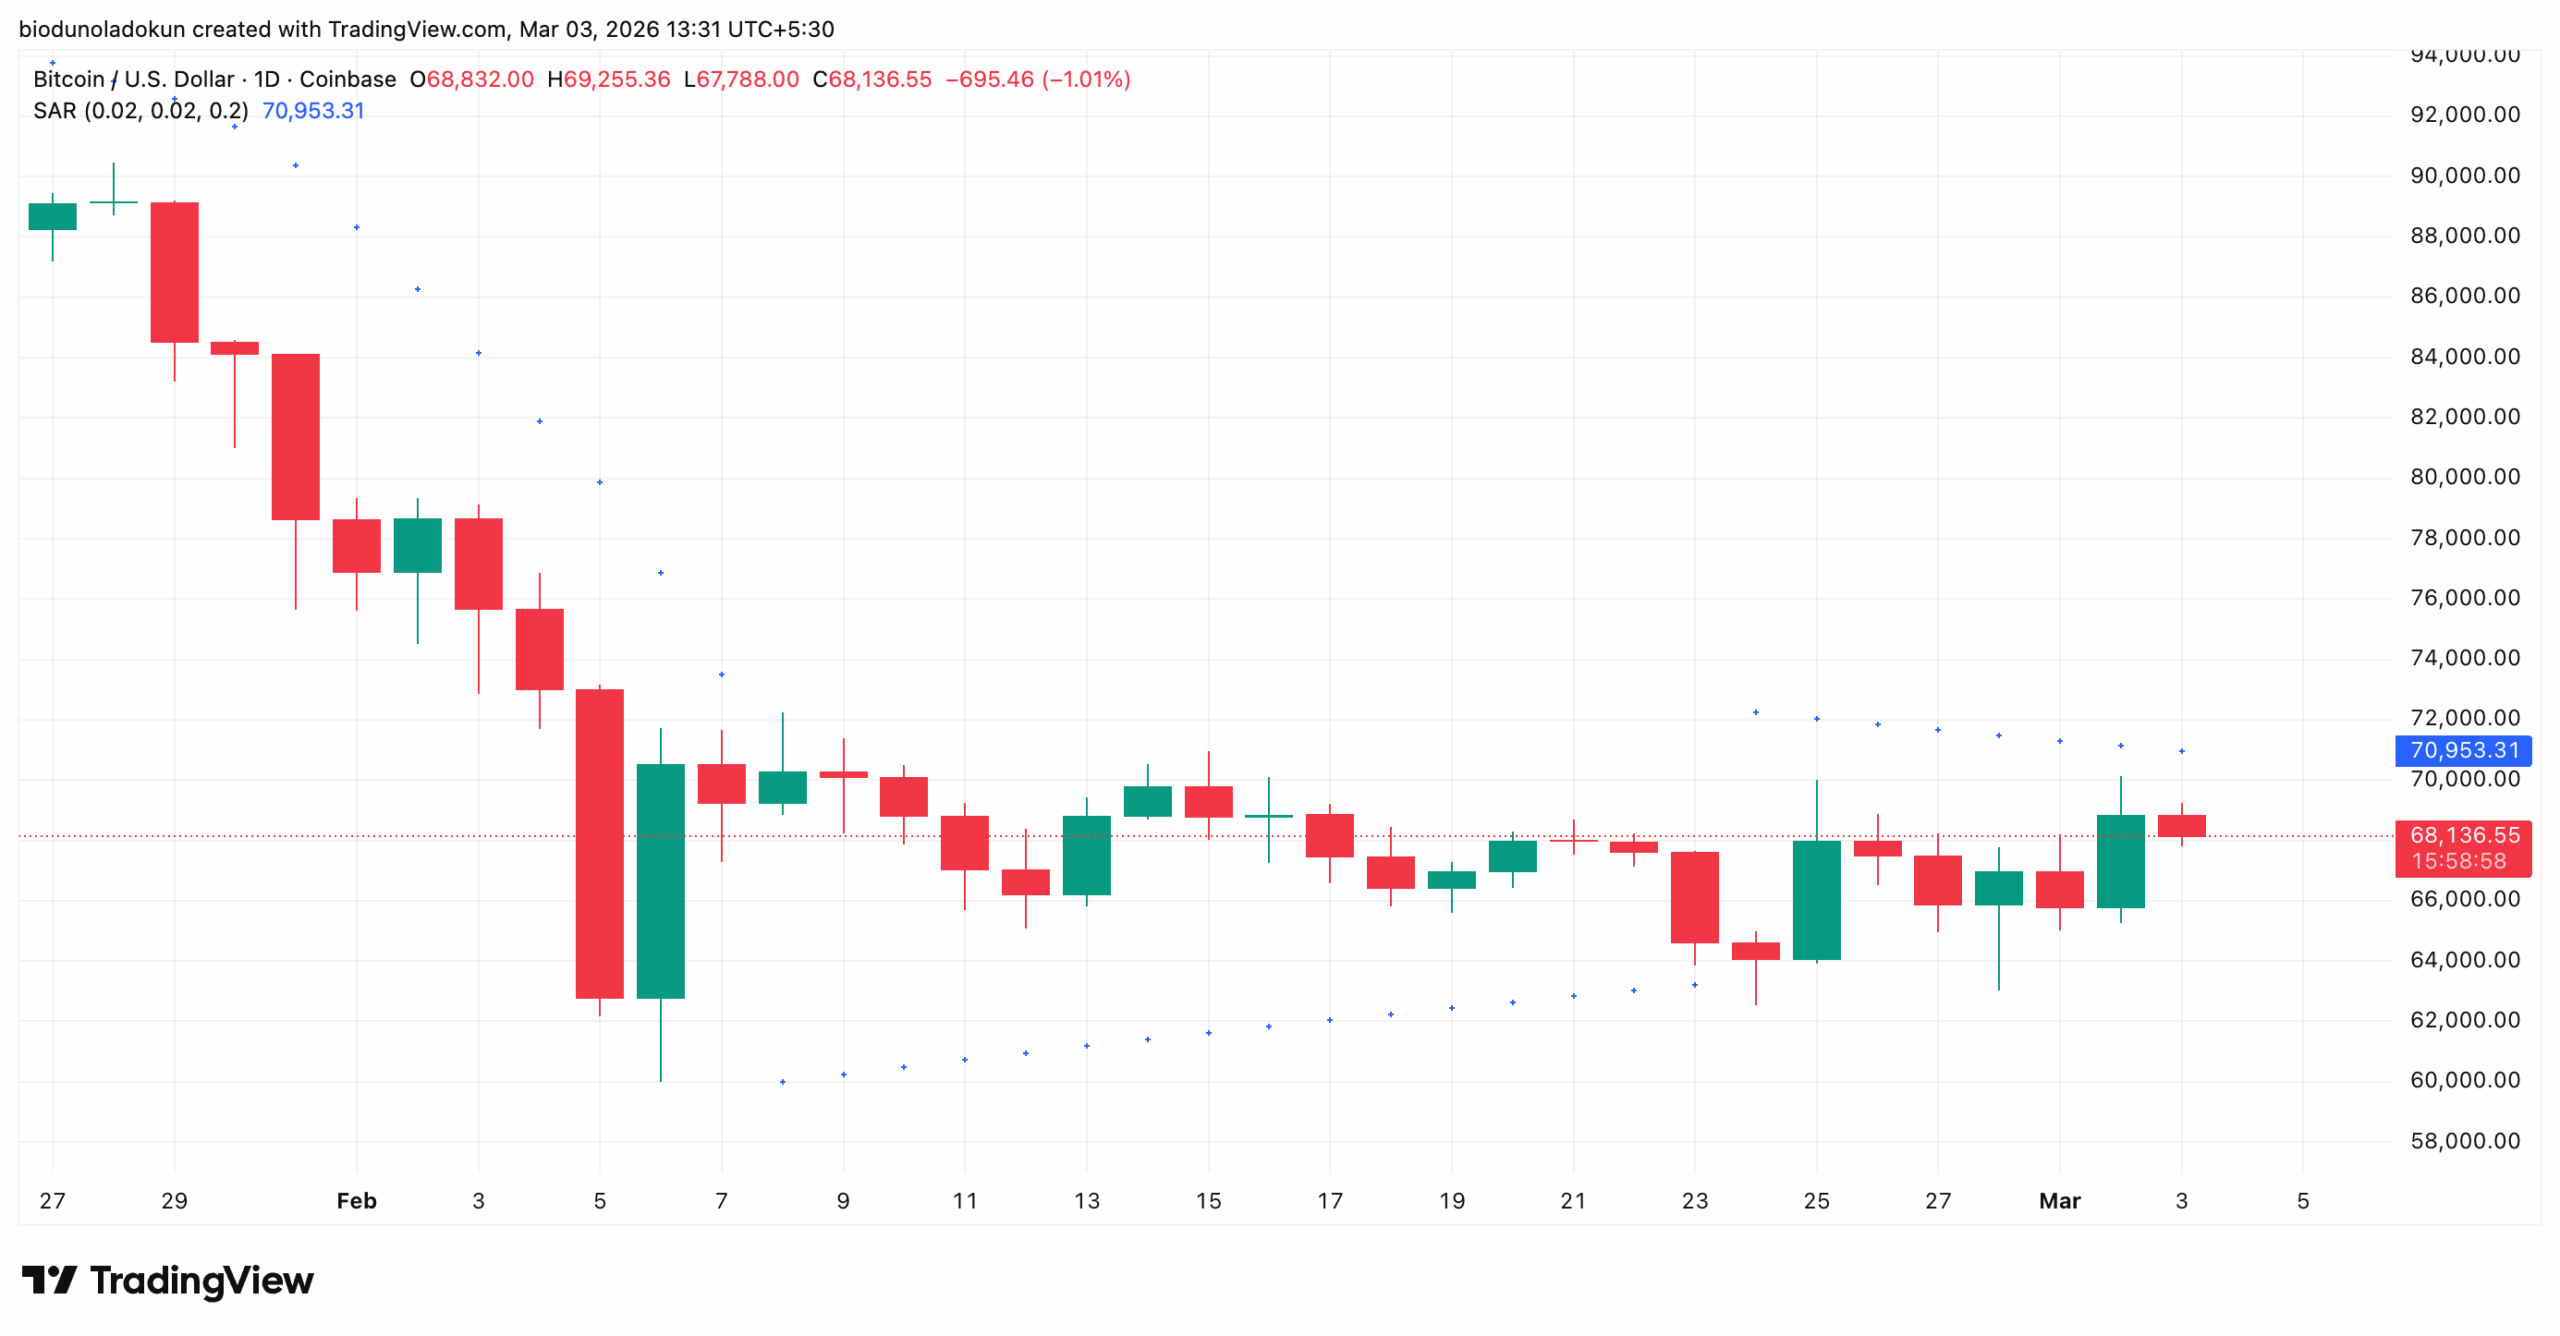
Despite these bullish on-chain signals, the BTC one-day chart suggests caution.
As of this writing, the coin trades below the dots that make up its Parabolic Stop and Reverse (SAR), signaling strong bearish leanings among spot traders.
This indicator identifies potential trend direction and reversals in an asset’s price. When its dots are placed below an asset’s price, the market is in an uptrend.
It indicates that an asset is experiencing bullish momentum and that its price could continue to rally if buying persists.
On the other hand, when these dots lie above the price, as in BTC’s case, they form dynamic resistance, preventing significant upward price movements.
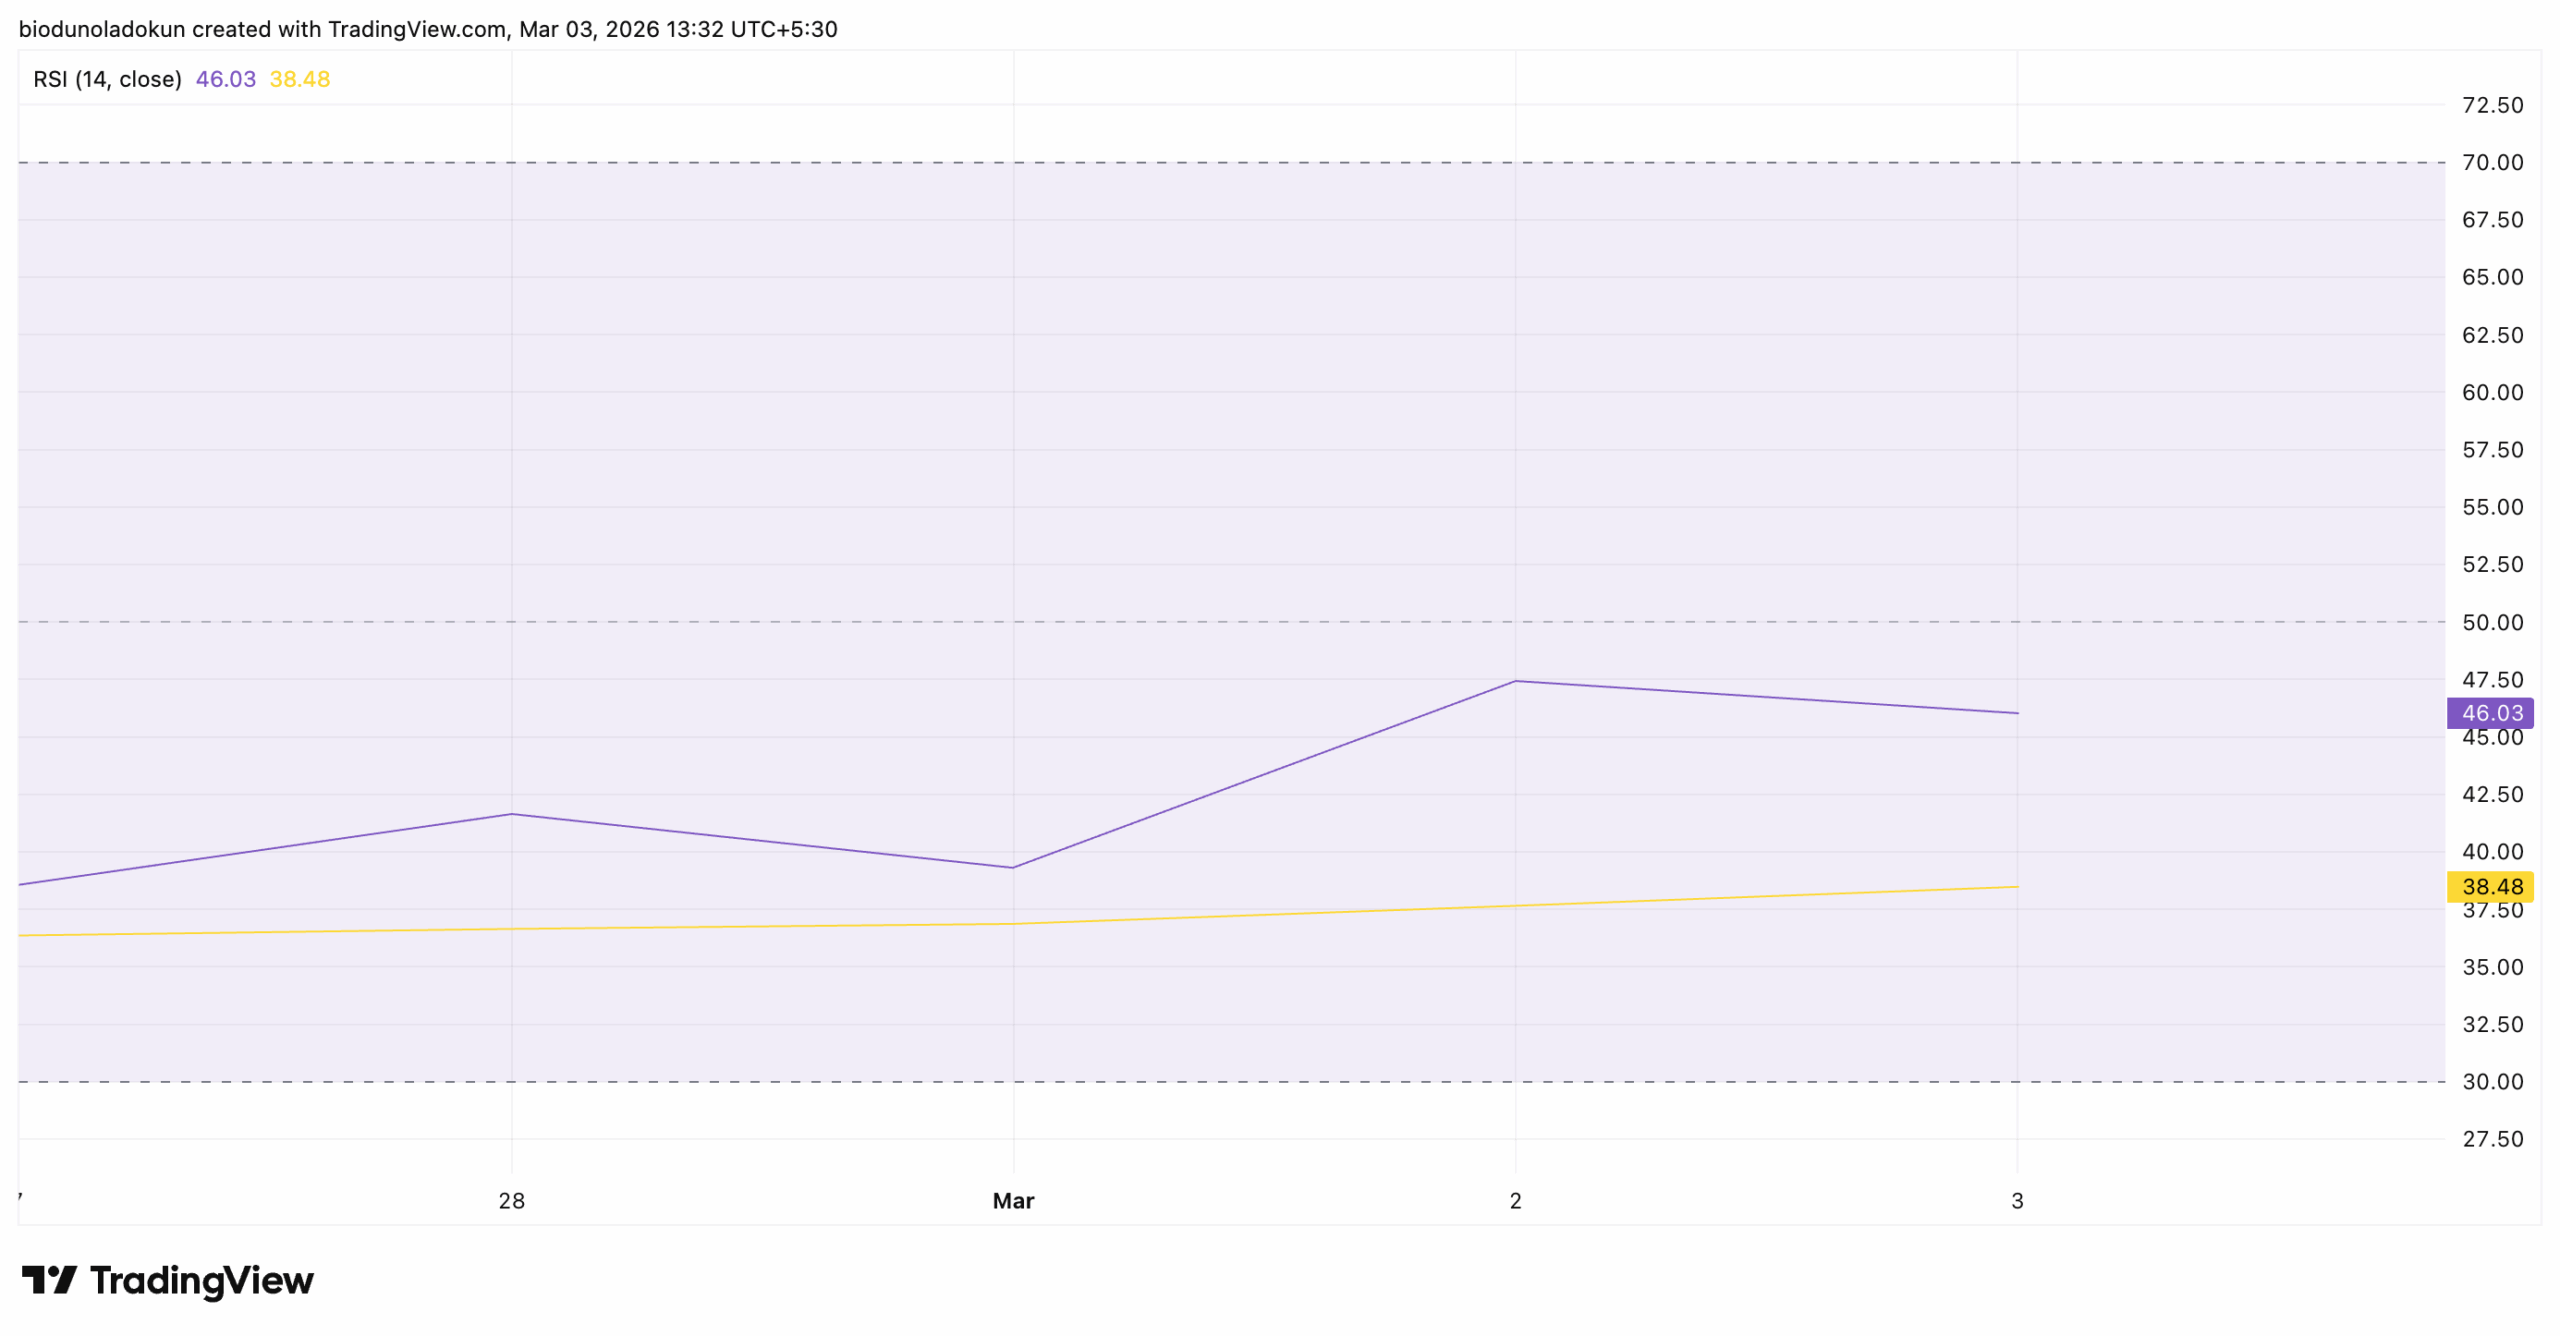
Moreover, the coin’s falling Relative Strength Index (RSI) confirms this bearish outlook. At press time, this momentum indicator is at 46.03 and in a downtrend, confirming the growing sell-side pressure among spot market participants.
The RSI indicator measures an asset’s overbought and oversold market conditions. It ranges between 0 and 100.
Values above 70 suggest the asset is overbought and due for a price decline, while values below 30 indicate the asset is oversold and may witness a rebound.
At 46.03 and falling, BTC’s RSI suggests traders are preferring distribution over accumulation amid escalating geopolitical tensions.
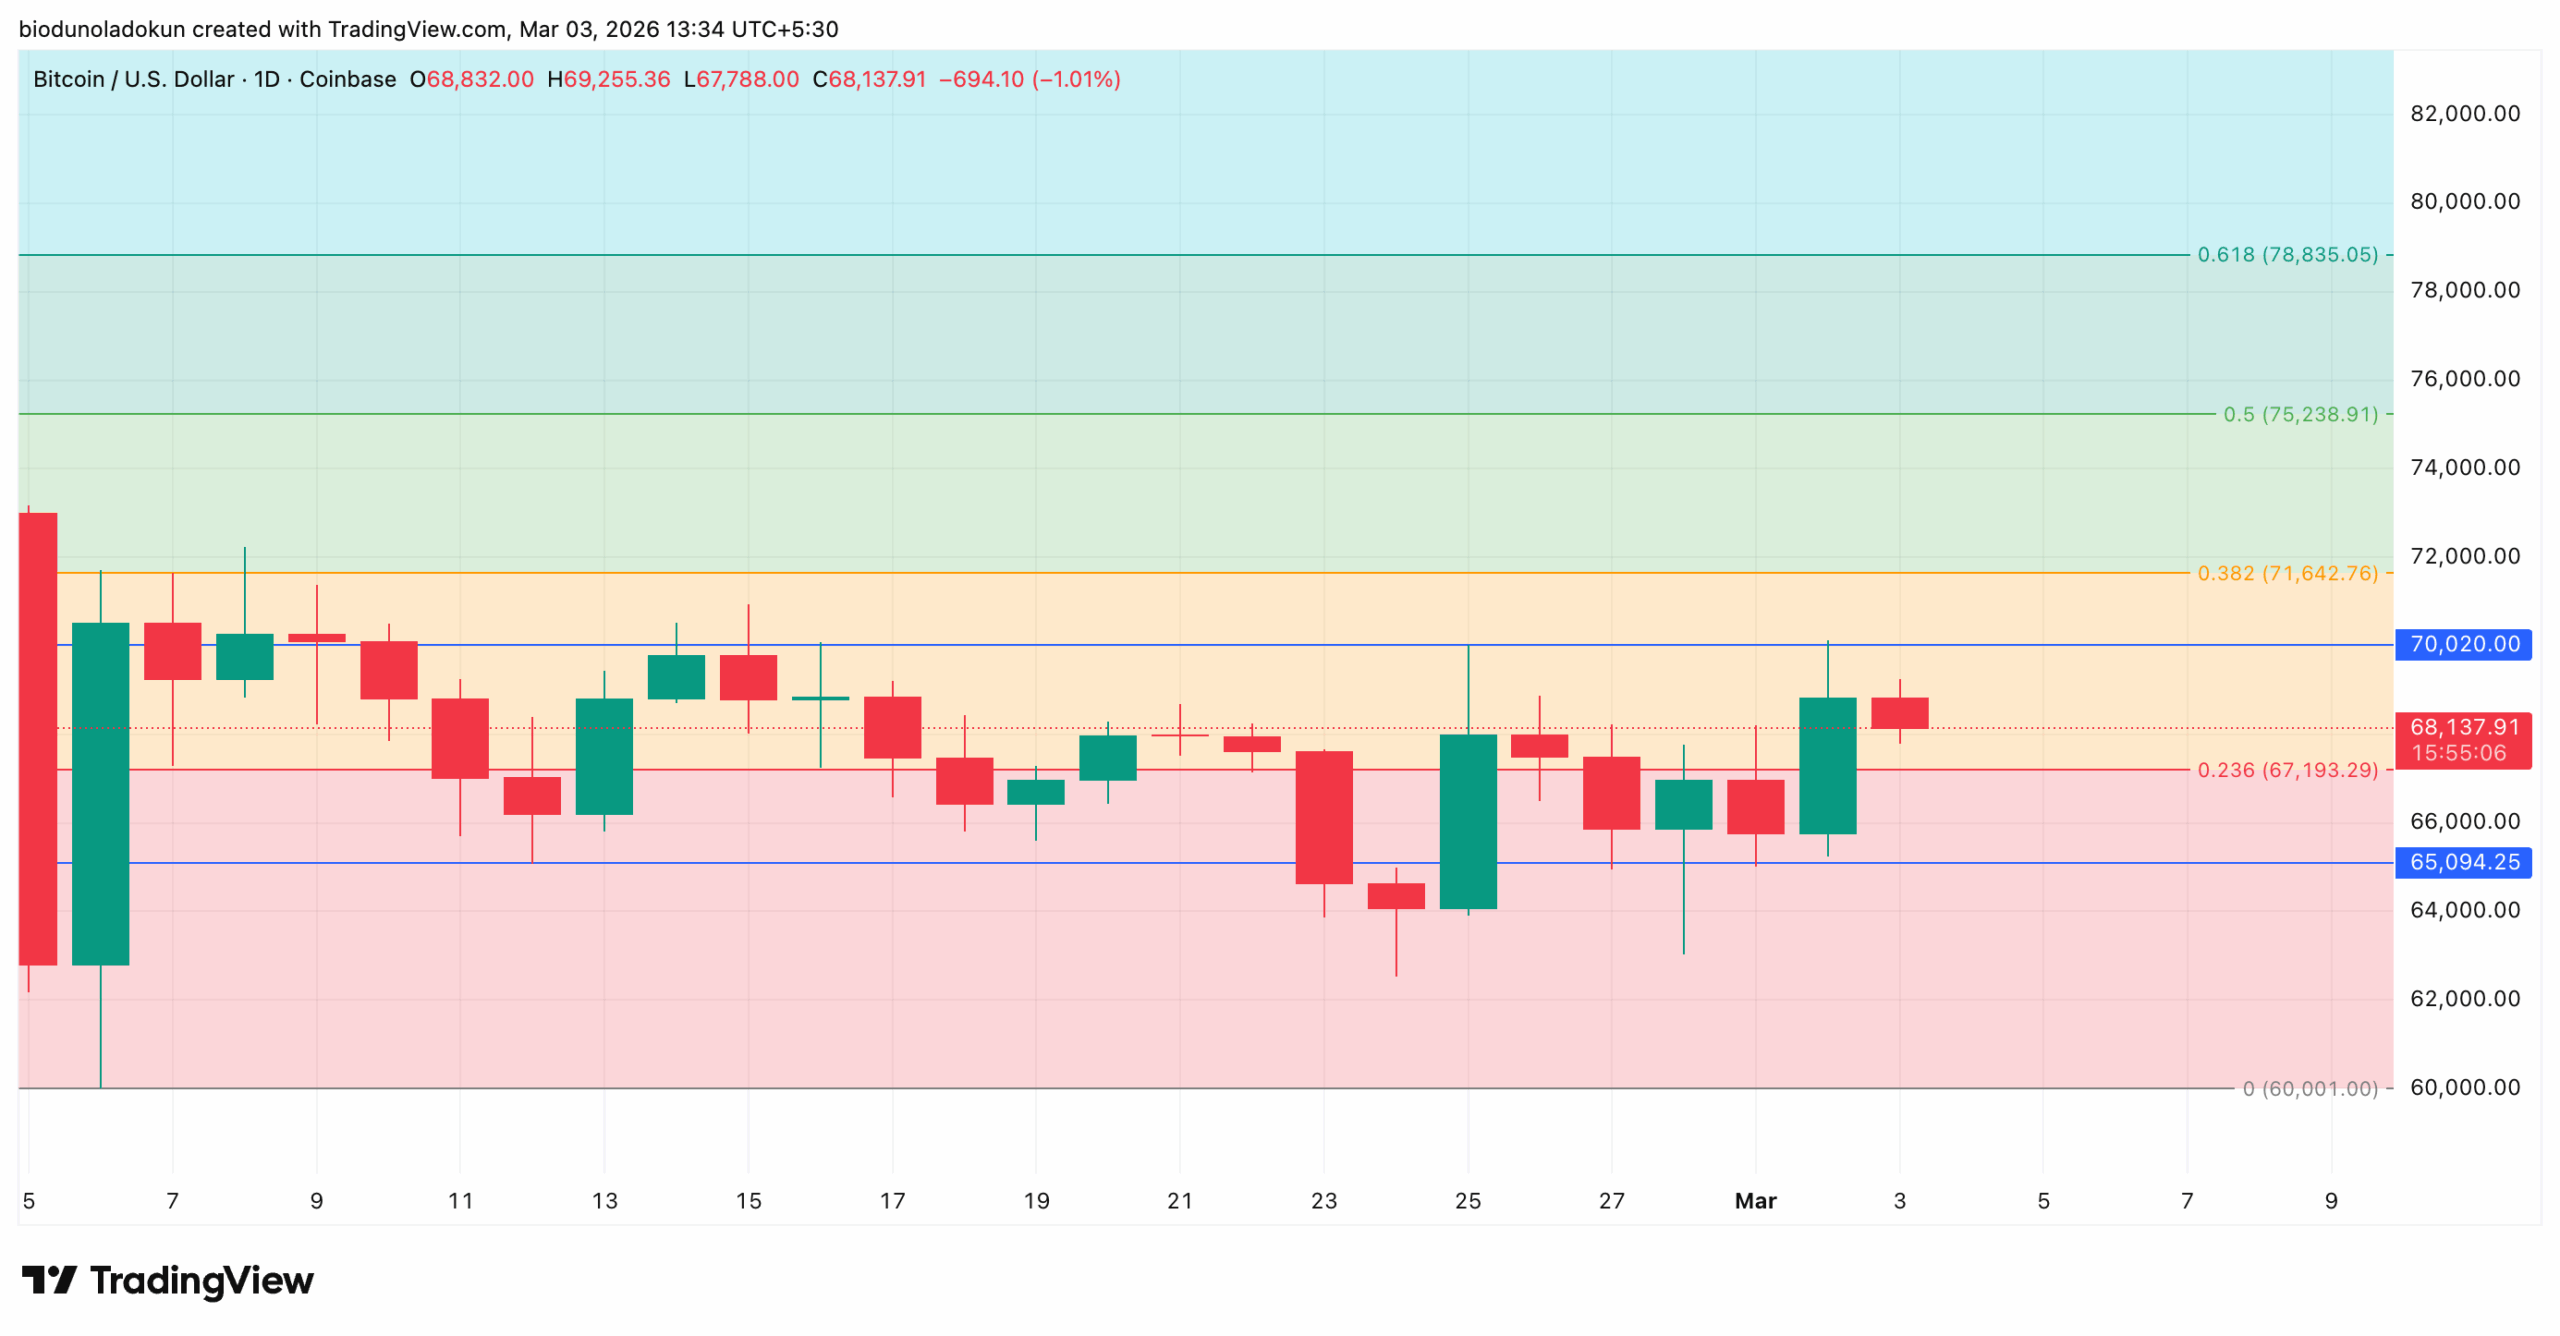
Bitcoin Bulls Eye $75K as Bears Target $60K Floor
At press time, BTC trades at $68,075, oscillating within a horizontal channel that forms resistance at $70,020, with a support floor at $65,094.
If institutional demand for the coin persists and, in turn, improves retail sentiment, BTC may attempt a push towards the $70,102 price barrier. A breach of this upper trend line would confirm the resurgence in bullish sentiments and could open the door to a rally toward $75,238.
However, a continued decline in spot interest would invalidate this bullish outlook. If demand falls further, BTC’s price could fall toward the $65,094 support floor.
Should the bulls fail to defend this level, the coin’s price could dip further toward $60,000, a low last seen on February 6.
Disclaimer:
The information provided in this article is for informational purposes only. It is not intended to be, nor should it be construed as, financial advice. We do not make any warranties regarding the completeness, reliability, or accuracy of this information. All investments involve risk, and past performance does not guarantee future results. We recommend consulting a financial advisor before making any investment decisions.
Abiodun Oladokun is a Research Analyst at CCN, where he covers cryptocurrency markets with a focus on on-chain analysis, technical assessments, and emerging trends across decentralized finance (DeFi), real-world assets (RWA), artificial intelligence (AI), decentralized physical infrastructure networks (DePIN), Layer 2s, and meme coins.
Prior to CCN, he served as a Senior On-Chain Analyst at BeInCrypto, producing market reports spanning diverse crypto sectors.
Before that, he conducted technical analysis and market assessments of various altcoins at AMBCrypto, where he also contributed long-form quarterly research papers on DeFi, NFTs, DAOs, and scaling architectures, leveraging on-chain platforms including Messari, Santiment, DefiLlama, and Dune Analytics.
He began his crypto career as a research analyst at SixthSense DAO, developing blockchain forensic tools to trace the history of stolen assets.
Abiodun is a lawyer called to the Nigerian Bar and the founder of Ilé Ijó, a Lagos-based electronic dance music collective.