Ethereum is down nearly 10% in the past month, but on-chain data is showing early signs of a trend reversal.
Long-term holders have been quietly accumulating since February 28, with ETH’s Hodler Net Position Change trending consistently upward.
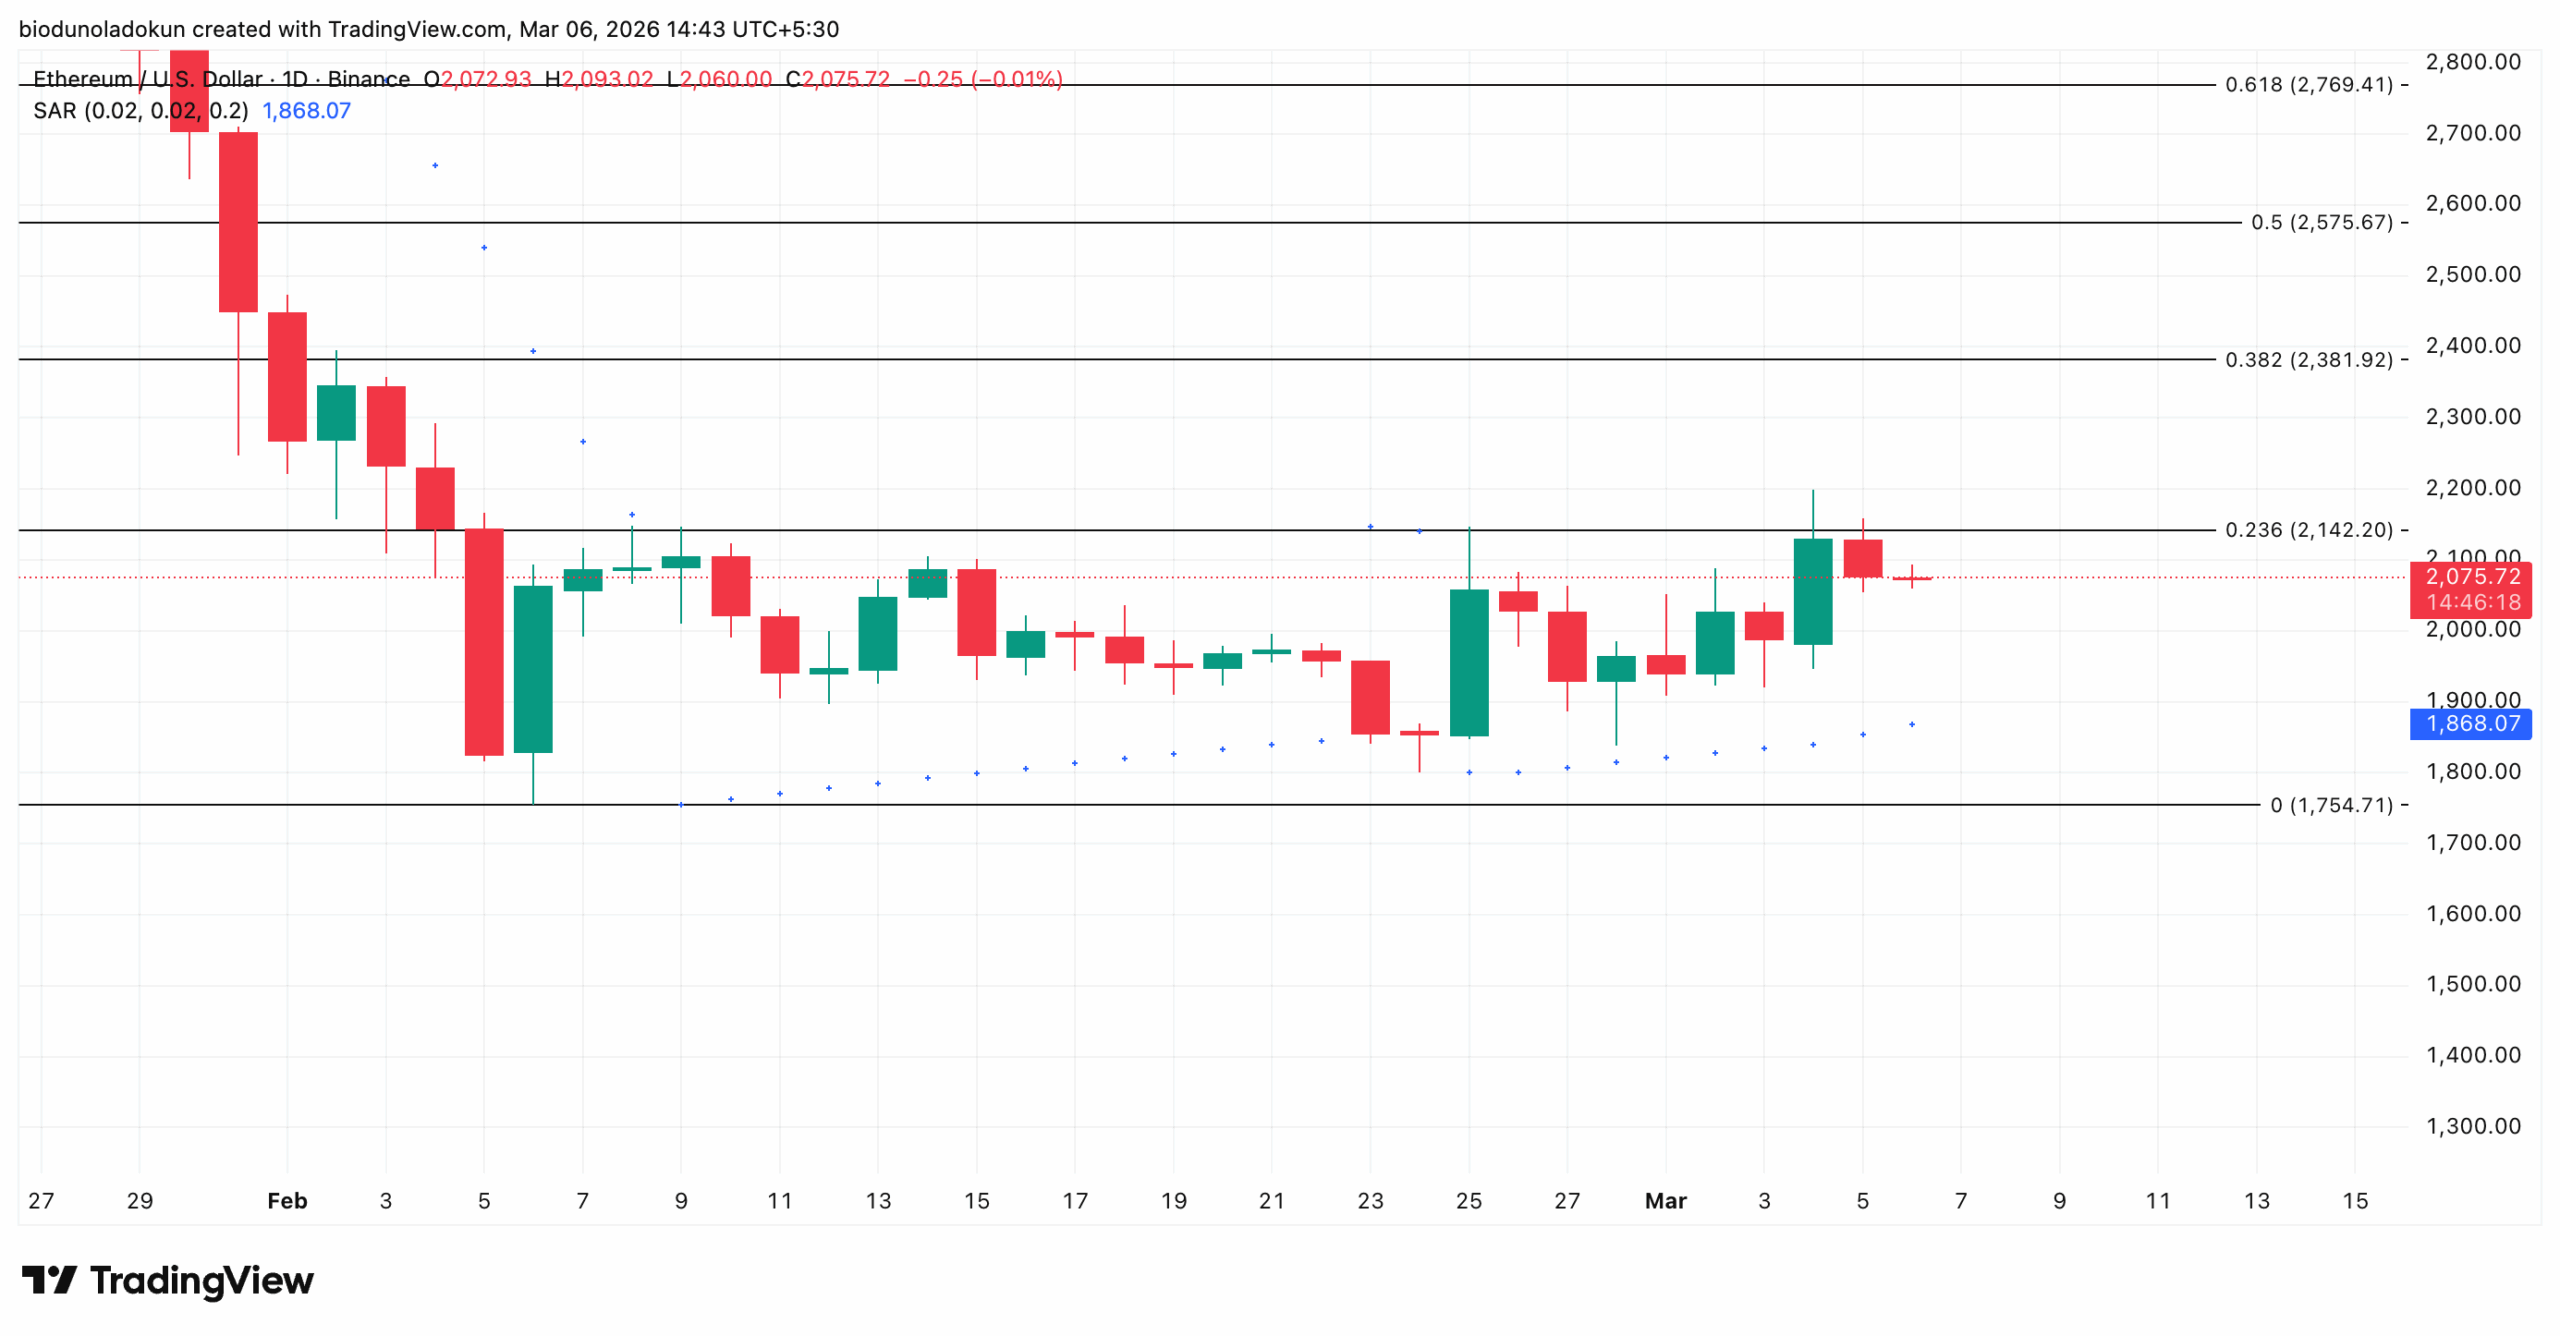
The Parabolic SAR on ETH’s daily chart has flipped bullish, with dots now printing below the price.
Ethereum is down nearly 10% in the past month, and trades at $2,075 at the time of writing.
The second-largest cryptocurrency by market capitalization spent most of January trending downward before settling into a prolonged sideways trend through February.
On-chain data shows that persistent selling pressure defined the 28-day period, leaving the majority of market participants in the red.
However, the trend is improving. As sentiment recovers and distribution pressure eases, ETH holders who have spent weeks transacting at a loss may soon find themselves back in profitable territory. Here is why:
After Weeks of Selling at a Loss, Ethereum Holders Are Changing Their Behavior
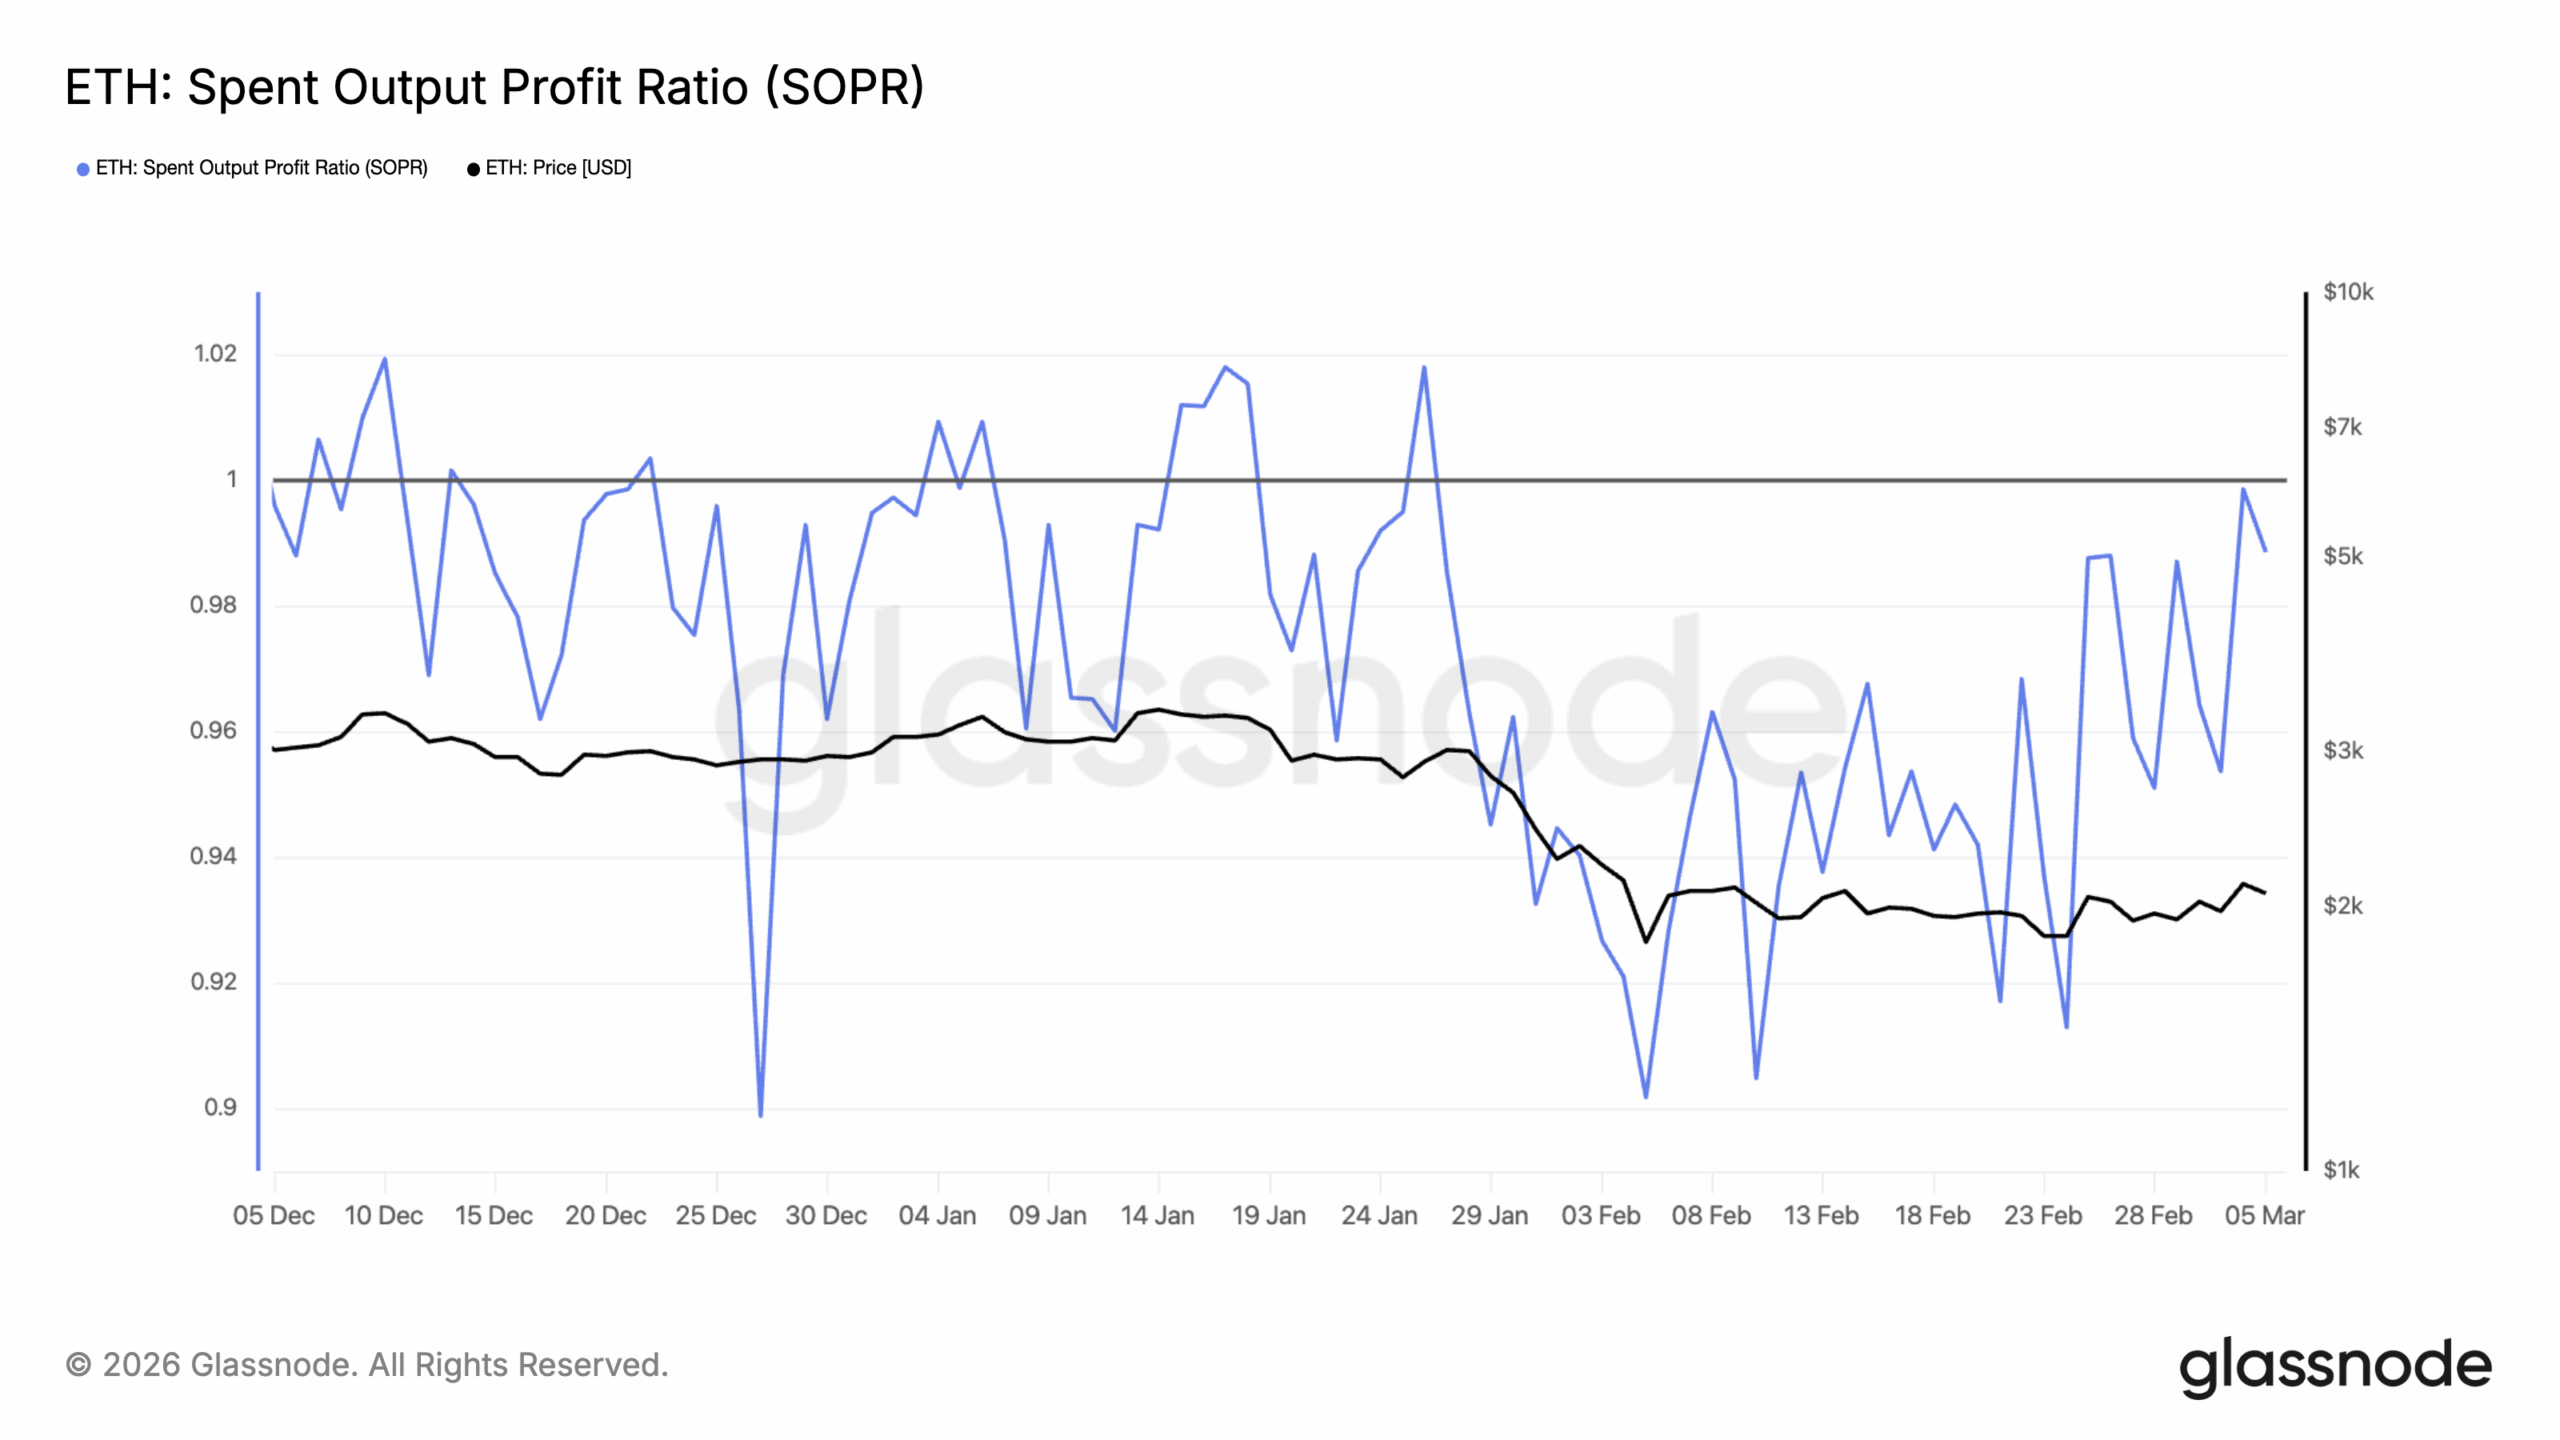
The key metric to consider here is ETH’s Spent Output Profit Ratio (SOPR), which has remained below 1 for the entire period since early February.
SOPR measures whether coins being moved on-chain are transacting at a profit or a loss relative to their acquisition price. A reading below 1 indicates holders are consistently in the red, while a value above 1 suggests on-chain activity has shifted back into profitability.
According to Glassnode data, ETH’s SOPR hit its year-to-date low on February 5, crashing to 0.90. This coincided with peak selling pressure, which pushed the leading altcoin to a 10-month low of $1754 by February 6.
Through mid-to-late February, the metric remained volatile, albeit slowly trending upward. By March 5, ETH’s SOPR climbed to nearly 1 (0.99), its highest reading in the past month, confirming improving sentiments in the market.
For ETH, the approach toward this level suggests that conditions are gradually aligning for a potential recovery.
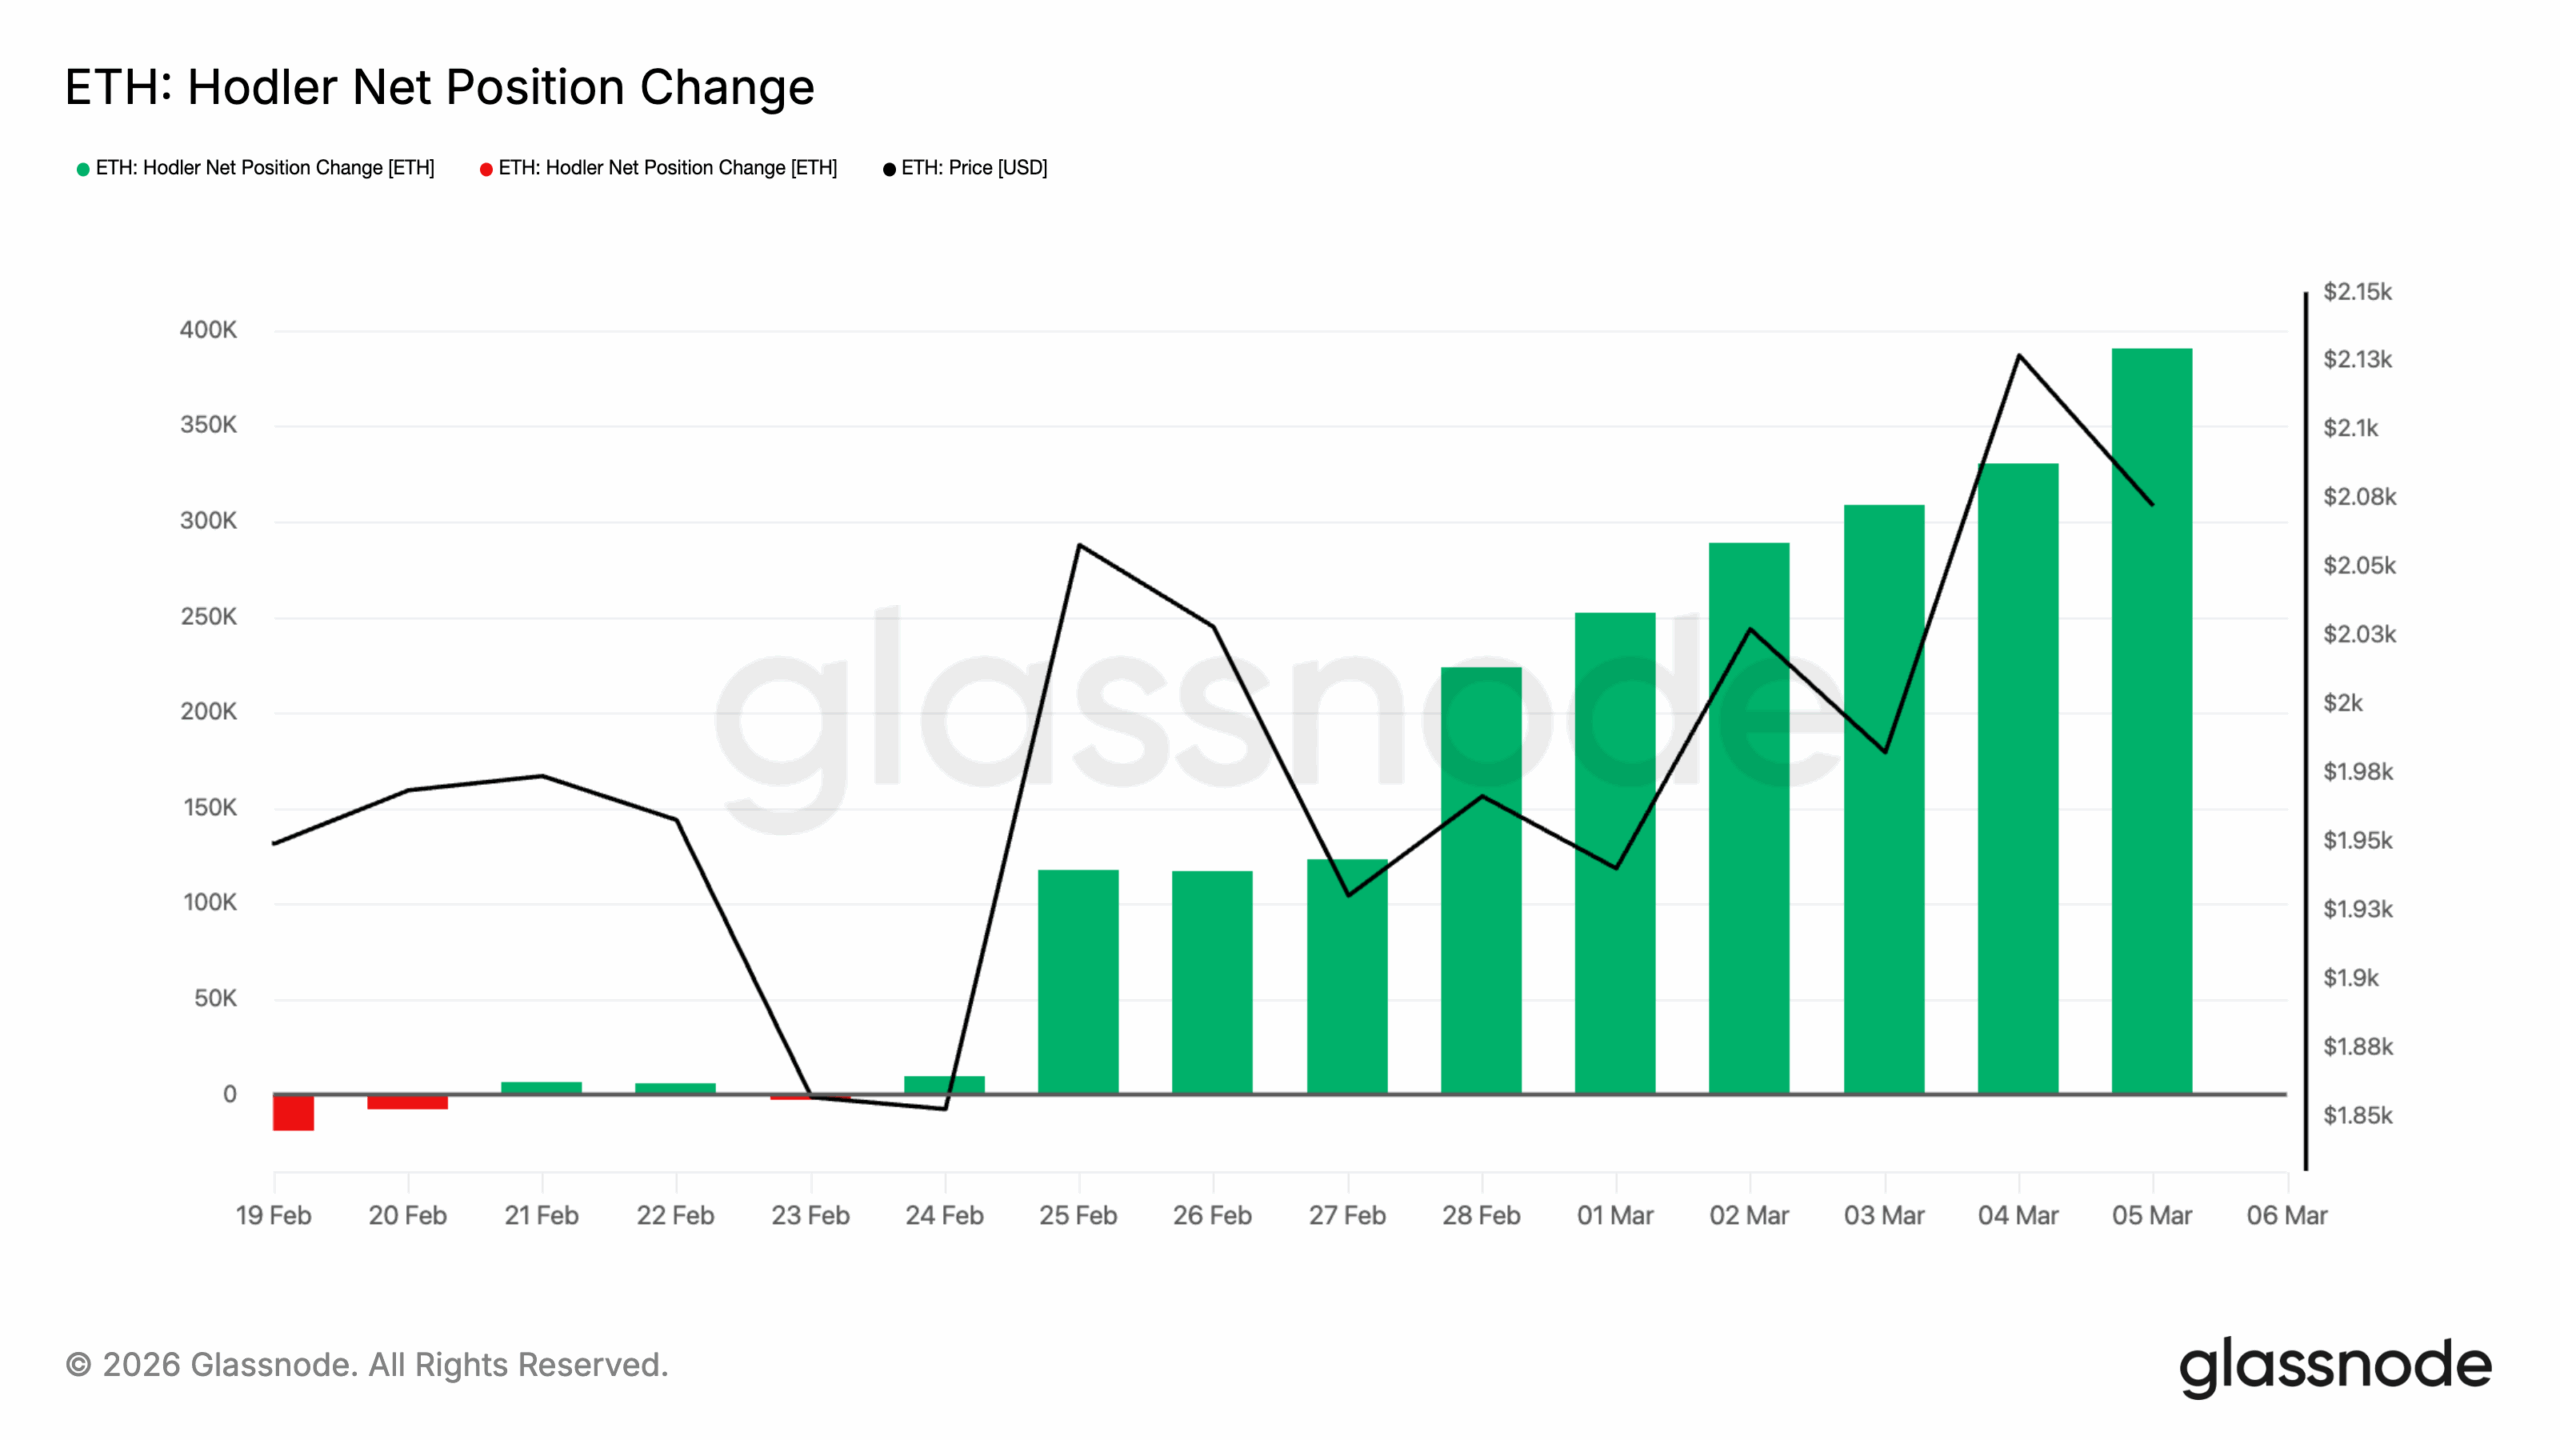
Furthermore, this growing conviction among ETH holders is reflected by its Hodler Net Position Change, which has consistently trended upward since February 28.
ETH Hodler Net Position Change | Credit: Glassnode
This metric tracks the net position of long-term holders over a given period, measuring whether investors are increasing or reducing their exposure.
A negative reading indicates that long-term holders are distributing their assets rather than accumulating. Conversely, when its value rises and is positive, more coins are being transferred into hodler wallets.
If broader market demand picks up as long-term holders continue to absorb ETH off the market, it could trigger a breakout from the coin’s current sideways trend and push prices higher.
This trend, combined with ETH’s improving SOPR, hints at a market slowly transitioning from fear-driven selling to quiet accumulation.
Bulls Take Control of ETH’s Short-Term Trend
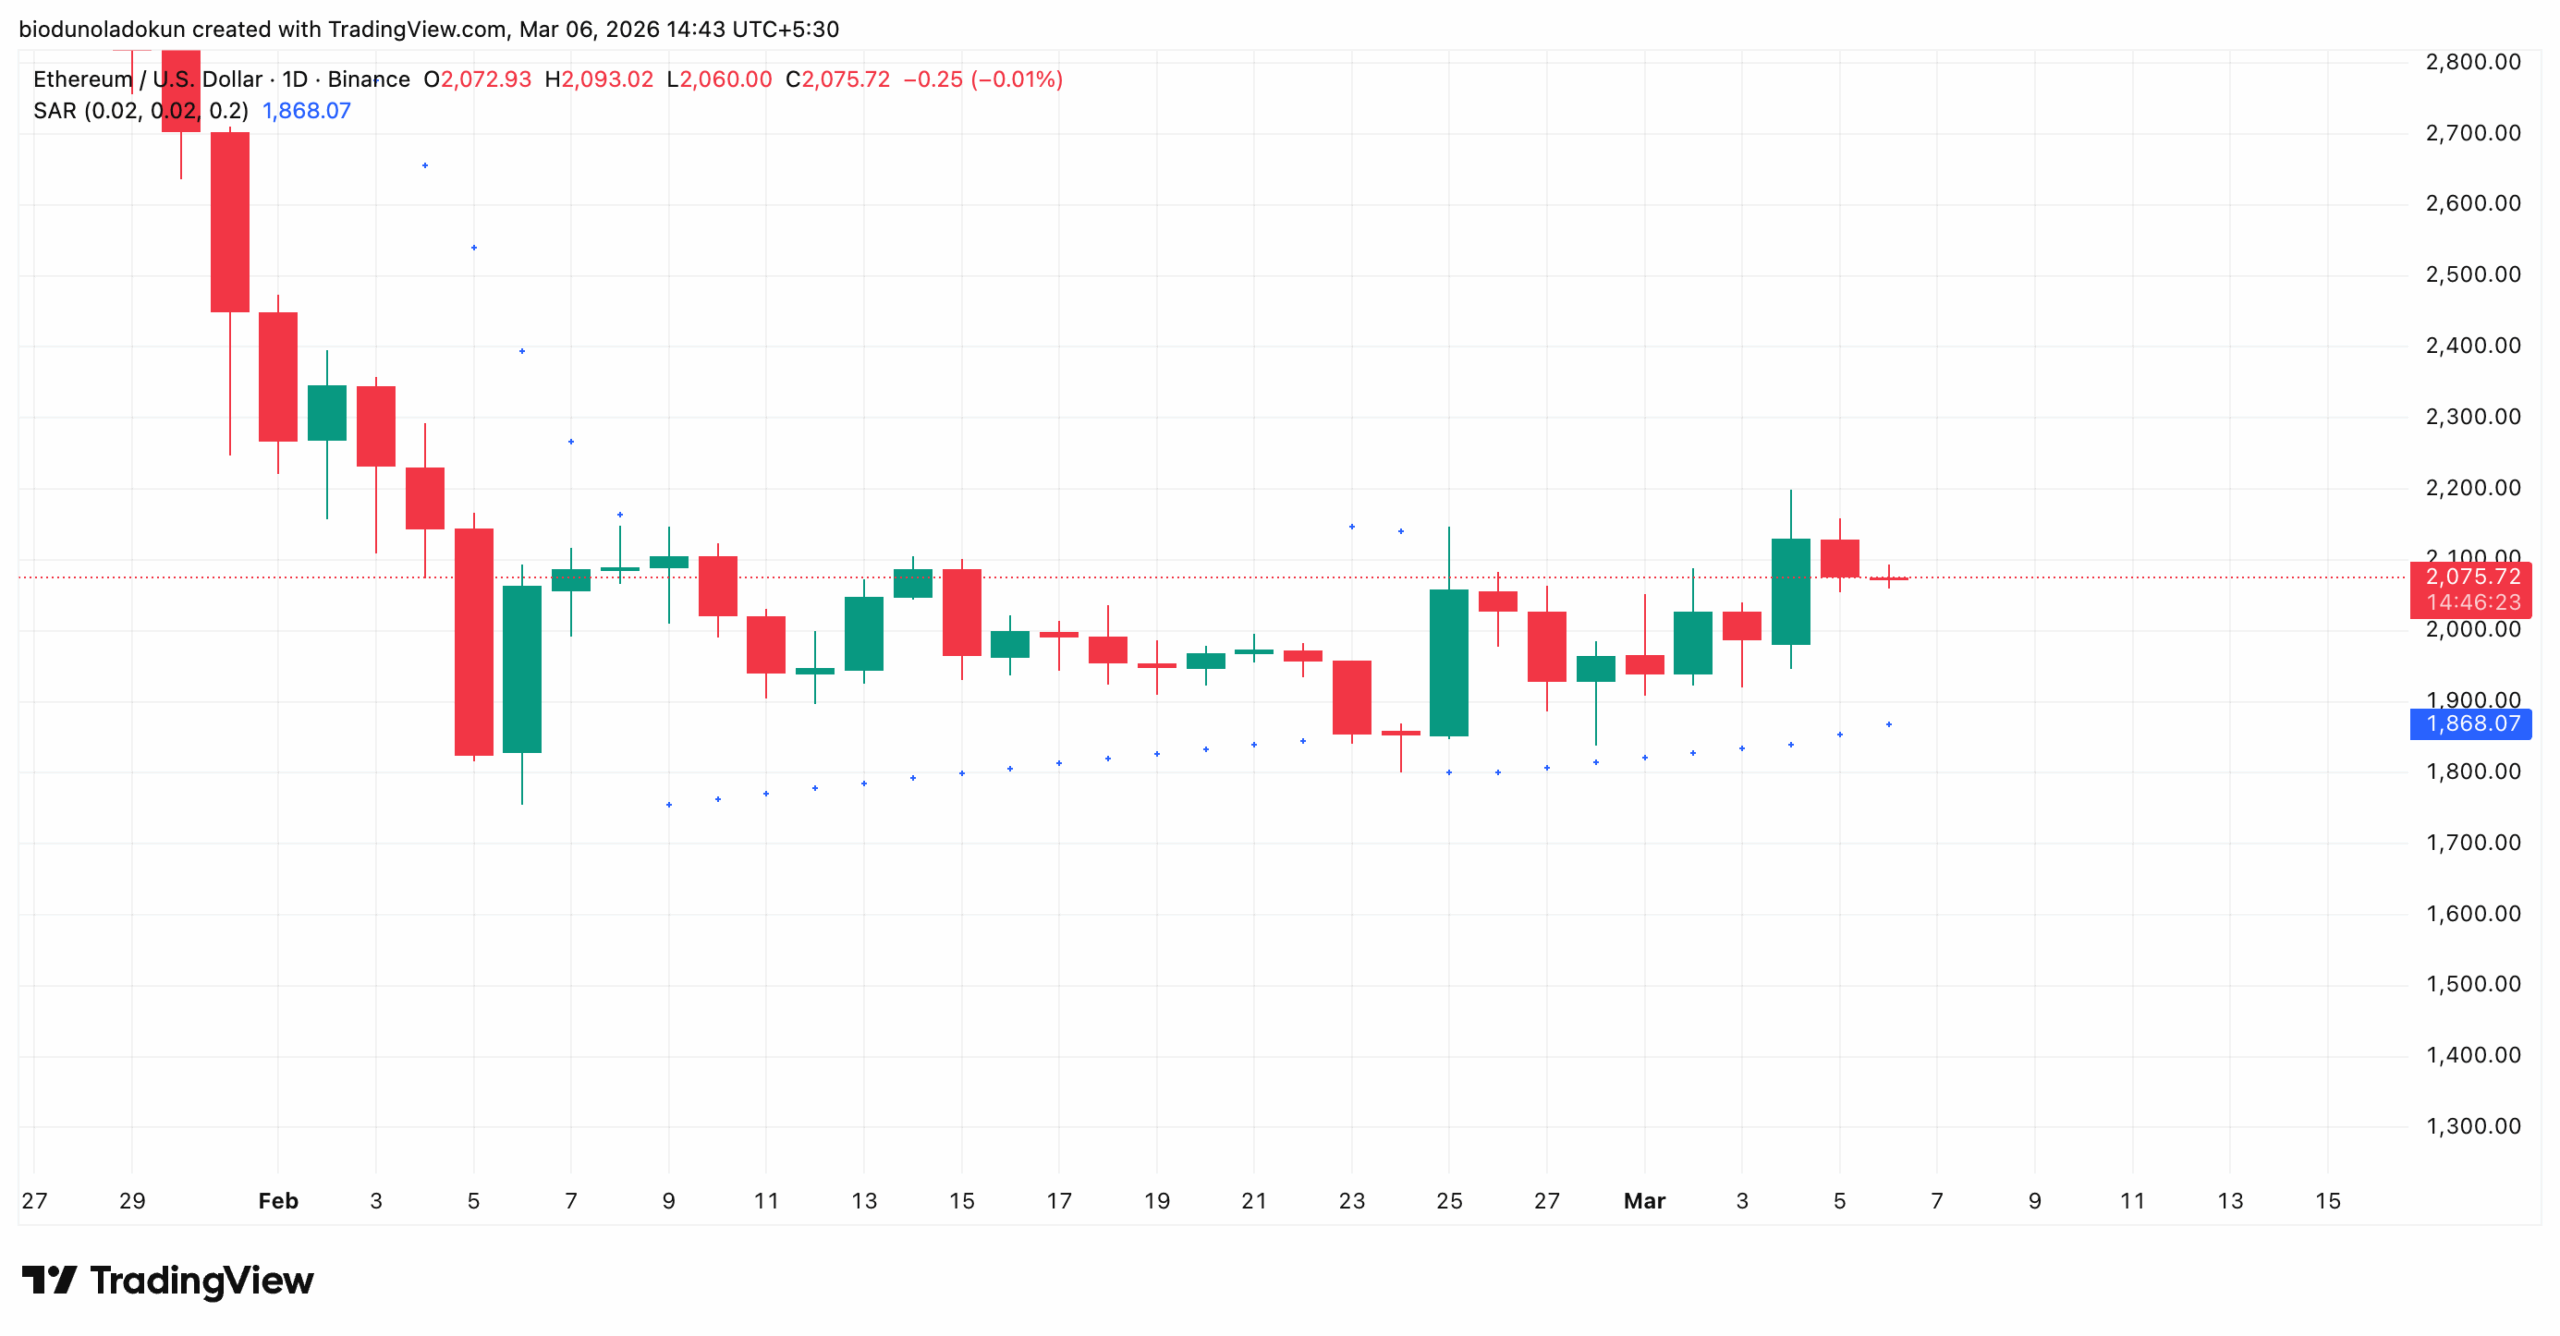
The setup of ETH’s price in relation to its Parabolic SAR indicator on a daily chart supports the possibility of a near-term rally.
As of this writing, the SAR dots are printing below ETH’s price, confirming that the short-term trend is shifting in favor of bulls.
The Parabolic SAR indicator identifies an asset’s potential trend direction and reversals. When its dots are placed below an asset’s price, the market is in a downtrend.
On the other hand, when the price rests above these dots, the asset is in an uptrend, and bullish momentum is in control.
For much of February, the SAR dots were positioned above ETH’s price, reflecting the sustained sell-side dominance that dragged the altcoin to its 10-month low.
With dots now printing below price, the selling phase has run its course, and buyers are beginning to assert control.
If buying continues, ETH could break above the long-term barrier formed at $2,142. A breach of this resistance could push the altcoin’s value to $2,381.
On the other hand, if profit-taking resumes, Ethereum could lose its strength.
It could break below the Parabolic SAR’s dynamic support floor at $1,868, and fall toward $1,754.
[You-may-like]
Disclaimer:
The information provided in this article is for informational purposes only. It is not intended to be, nor should it be construed as, financial advice. We do not make any warranties regarding the completeness, reliability, or accuracy of this information. All investments involve risk, and past performance does not guarantee future results. We recommend consulting a financial advisor before making any investment decisions.
Abiodun Oladokun is a Research Analyst at CCN, where he covers cryptocurrency markets with a focus on on-chain analysis, technical assessments, and emerging trends across decentralized finance (DeFi), real-world assets (RWA), artificial intelligence (AI), decentralized physical infrastructure networks (DePIN), Layer 2s, and meme coins.
Prior to CCN, he served as a Senior On-Chain Analyst at BeInCrypto, producing market reports spanning diverse crypto sectors.
Before that, he conducted technical analysis and market assessments of various altcoins at AMBCrypto, where he also contributed long-form quarterly research papers on DeFi, NFTs, DAOs, and scaling architectures, leveraging on-chain platforms including Messari, Santiment, DefiLlama, and Dune Analytics.
He began his crypto career as a research analyst at SixthSense DAO, developing blockchain forensic tools to trace the history of stolen assets.
Abiodun is a lawyer called to the Nigerian Bar and the founder of Ilé Ijó, a Lagos-based electronic dance music collective.