Bitcoin is approaching a critical technical level that could trigger either a crash to $32,000 or a rally toward $135,000. Here’s what analysts are watching next. | Credit: CCN.com
Share
Key Takeaways
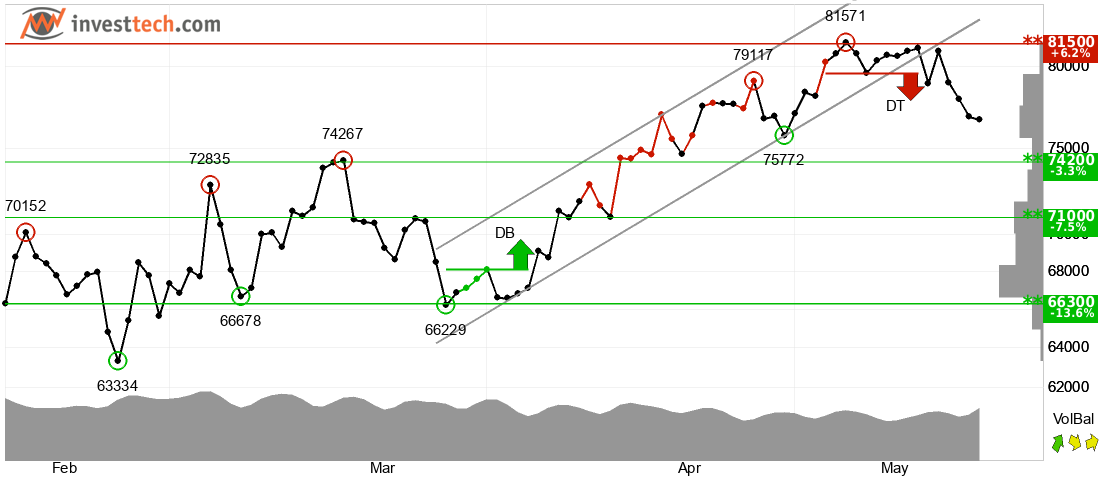
Bitcoin is currently trading in a critical range between $71,000 support and $83,000 resistance, according to analyst Gareth Soloway .
A breakdown below $71,000 could confirm a larger bearish pattern and potentially send BTC toward $49,000-$50,000, with an extreme downside target of $32,000.
If Bitcoin successfully breaks above $83,000, Soloway believes the next major targets become $97,000 and eventually $135,000.
Soloway argues Bitcoin is still behaving more like a risk asset than “digital gold,” largely tracking movements in the Nasdaq.
Bitcoin is once again at a critical crossroads. After rallying sharply alongside US tech stocks, the world’s largest cryptocurrency has entered a period of uncertainty that could define the next major cycle for digital assets.
According to veteran technical analyst Gareth Soloway, Bitcoin’s current chart structure presents two dramatically different outcomes: a breakdown toward $32,000 or a breakout rally that could send prices soaring toward $135,000.
The divergence between those targets may sound extreme, but Soloway argues the technical setup fully supports both possibilities. In a recent market analysis, the Verified Investing chief market strategist explained that Bitcoin is sitting inside a pivotal consolidation zone where the next decisive move could determine whether crypto enters another bullish expansion phase or falls into a painful correction.
At the center of Soloway’s thesis is the idea that Bitcoin remains heavily tied to broader risk markets, particularly the Nasdaq, despite ongoing narratives that portray BTC as “digital gold.”
Bitcoin Price Rally Faces Strong Resistance Near $83K
Bitcoin recently climbed to approximately $83,000 after rebounding strongly from its February lows. Soloway noted that the move unfolded almost exactly as his technical models projected.
He pointed to several bullish technical signals, including:
Bitcoin has already retreated roughly $5,000 from its recent highs, trading just above $78,000 during Soloway’s analysis. While such volatility is common in crypto markets, he believes the current pullback carries broader implications because it coincides with weakness emerging in US equities.
The Nasdaq surged approximately 30% in just six weeks, a move Soloway described as “extended” and potentially unsustainable. As tech stocks started cooling off, Bitcoin also began weakening, reinforcing the idea that crypto still trades primarily as a risk asset rather than a safe-haven hedge.
“Bitcoin hasn’t proven itself as digital gold yet,” Soloway said. “In the near term, it trades like a risk-on asset.”
That correlation may become the key driver for Bitcoin’s next major move.
Bitcoin Bear Flag Pattern Signals Potential Breakdown
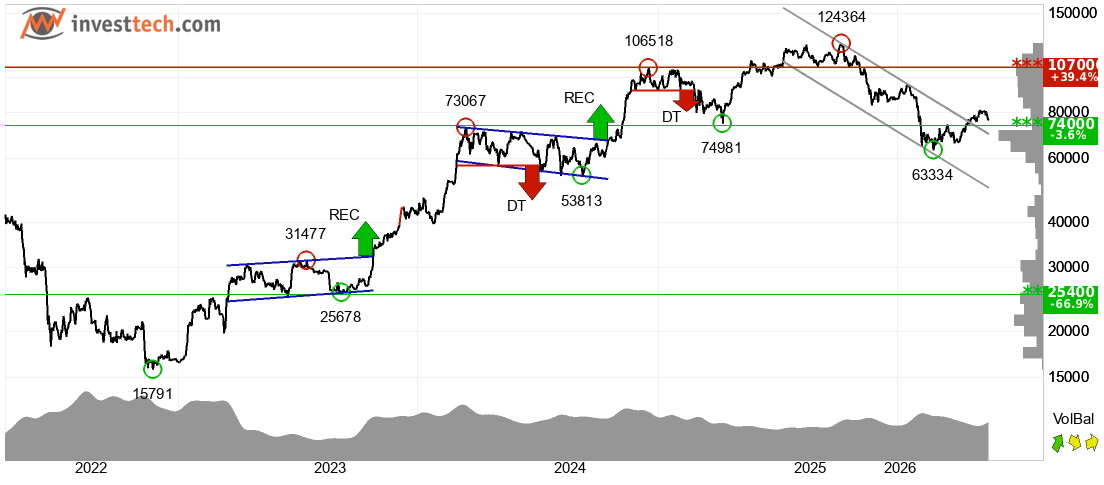
The central concern in Soloway’s analysis is the emergence of what technicians call a “bear flag” pattern.
A bear flag forms when an asset experiences a sharp decline, followed by a period of upward or sideways consolidation before potentially continuing lower. According to Soloway, Bitcoin’s current structure resembles exactly that type of setup on the weekly chart.
Critics often argue that flag consolidations cannot last longer than the original downward move that created them, but Soloway rejects that idea as misinformation. He pointed to historical examples where similar consolidation phases persisted for extended periods before ultimately resolving in the direction of the broader trend.
Bearish breakdown trigger: Decisive drop below $71,000
The $71,000 zone represents the lower boundary of Bitcoin’s current trend channel, a support line that has held multiple times since February. If Bitcoin decisively breaks below it, Soloway believes the larger bearish structure would officially activate.
As long as BTC remains trapped between roughly $71,000 support and $83,000 resistance, the market may simply continue chopping sideways. But consolidation phases rarely last forever.
Eventually, the market chooses a direction.
And if support gives way, Soloway sees substantial downside risk.
Why Bitcoin Could Crash to $32K
Should Bitcoin lose the $71,000 level, Soloway believes the first major downside target would likely emerge around $49,000 to $50,000.
That area represents a historically important support zone where buyers previously stepped in aggressively. However, if macroeconomic conditions deteriorate further and risk assets continue selling off, he warns the correction could deepen significantly.
While that prediction may sound shocking to bullish investors accustomed to long-term upside narratives, Soloway emphasized that technical analysis is about probabilities and chart structures, not emotional attachment to an asset.
“I love Bitcoin,” he explained. “I think it’s a great remedy as digital gold. But in the short term, I’m a technician.”
That distinction matters because many crypto investors often become emotionally committed to bullish outcomes regardless of market conditions. Soloway instead focuses strictly on what the charts are signaling.
From his perspective, Bitcoin’s inability to break convincingly above recent resistance levels while simultaneously tracking Nasdaq weakness increases the probability of downside pressure.
The broader macro backdrop could also amplify risk.
Higher interest rates, slowing economic growth, weakening liquidity conditions, and ongoing uncertainty around Federal Reserve policy have all contributed to a more cautious environment for speculative assets. Since Bitcoin still trades closely alongside tech equities, further deterioration in market sentiment could easily drag crypto lower.
Bitcoin Price Could Surge to $135K if Bulls Regain Control
Despite the bearish risk, Soloway is far from calling for a guaranteed collapse.
In fact, he also outlined a highly bullish scenario that could send Bitcoin toward new all-time highs and eventually as high as $135,000.
For that to happen, Bitcoin first needs to reclaim and break above the upper resistance zone near $83,000. If bulls manage to force a sustained breakout, Soloway believes the next major target becomes approximately $97,000.
Extend toward long-term trend resistance near $135,000
The ultimate upside target of $135,000 comes from a long-term trend line that Soloway has tracked across multiple market cycles. That line connects the 2017 bull market peak with major highs during the 2021 cycle.
Interestingly, Bitcoin has repeatedly failed to break above that trend line in recent years, with price rejecting it several times before pulling back.
As a result, Soloway views the line as a major technical ceiling for the current cycle. If Bitcoin rallies into that region again, it could act as powerful resistance.
Still, he acknowledged that Bitcoin may eventually break through it altogether over the longer term.
“Do I think eventually it goes through this line? I think eventually it does,” he said.
However, he cautioned against making emotionally driven predictions about Bitcoin immediately reaching $200,000 or $500,000 simply because investors want it to happen.
Instead, he stressed the importance of remaining logic-based and chart-driven.
Ethereum Price Analysis and Key Altcoin Levels to Watch
Bitcoin is not the only cryptocurrency approaching a make-or-break moment.
Soloway also highlighted several key levels across major altcoins that could help reveal whether the broader crypto market remains healthy or is preparing for a deeper correction.
Ethereum (ETH)
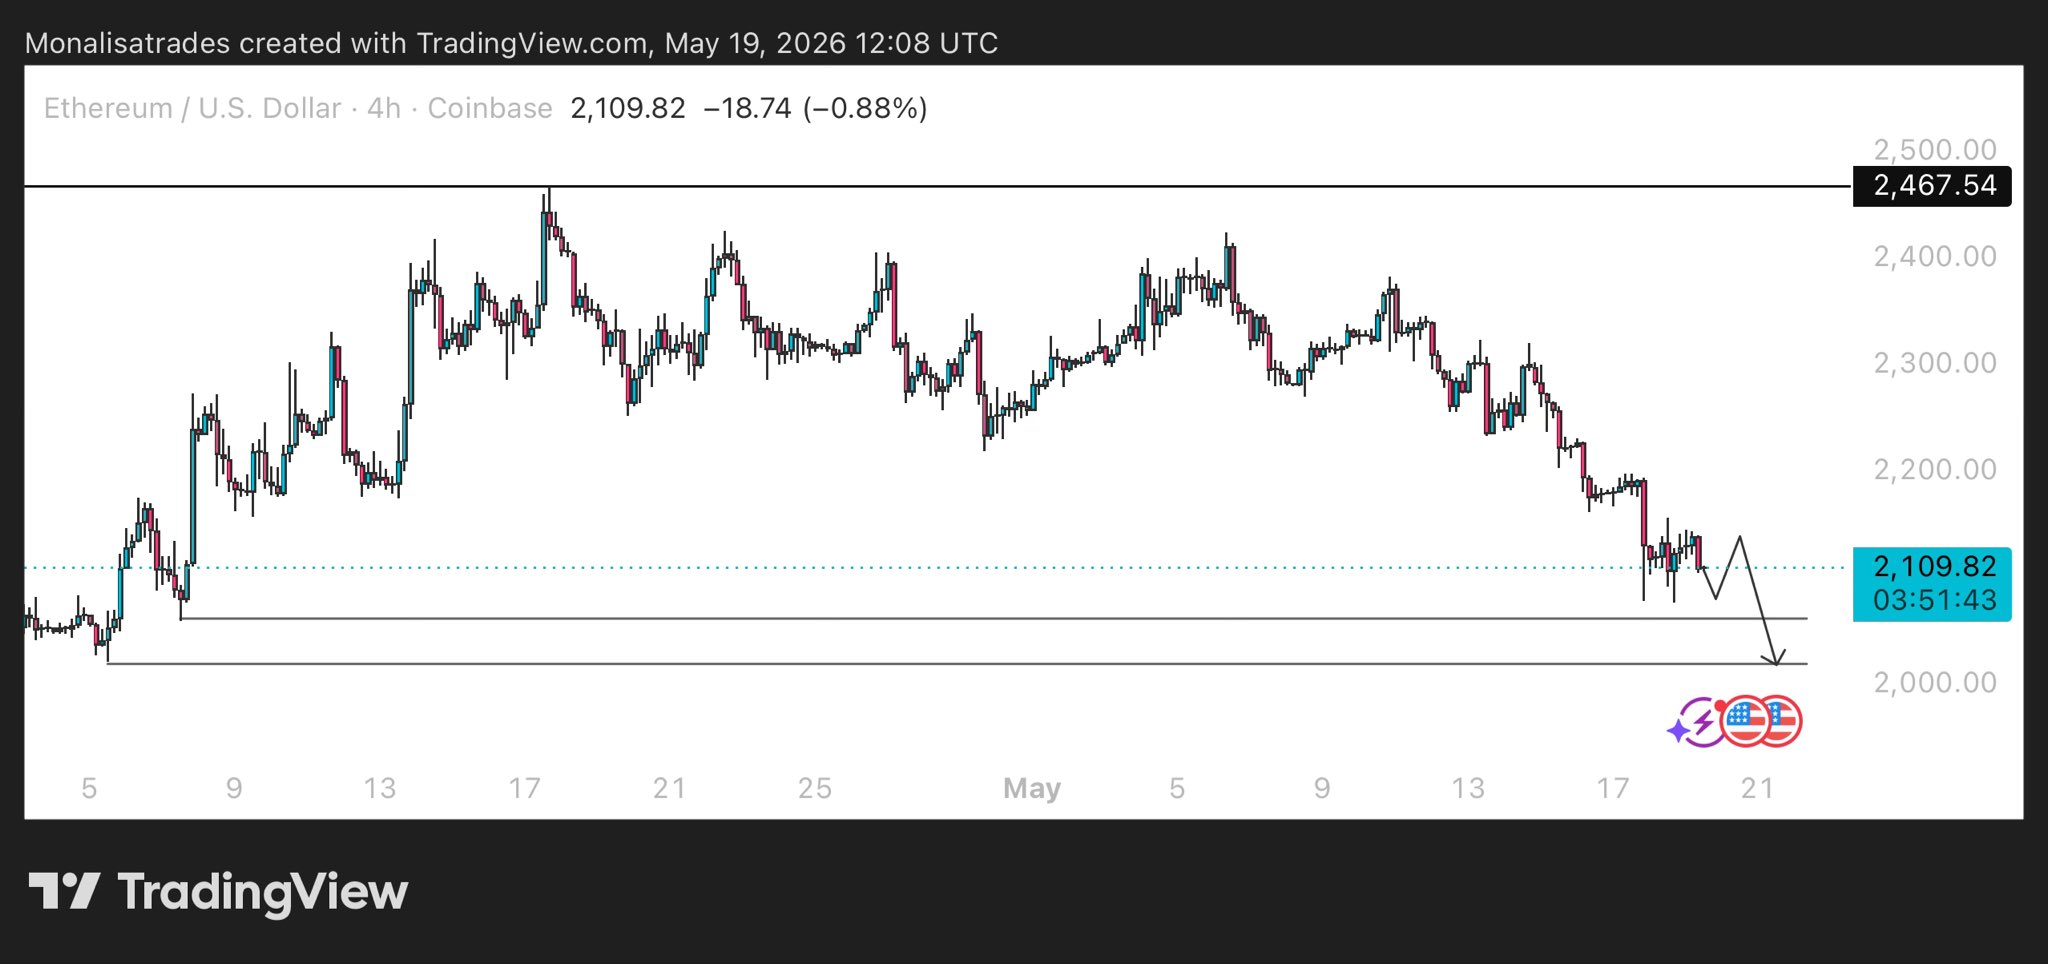
Ethereum is approaching a crucial support zone around $2,100-$2,120. That area has held multiple times previously, making it an important technical floor.
ETH/USD 4-hour chart. | Credit: TradingView
If ETH breaks below it, Soloway sees downside potential toward:
$1,700 initially
$1,680 as secondary support
Potentially $1,400 in a larger sell-off
XRP
XRP recently failed to confirm a breakout after briefly moving higher. Soloway warned that a breakdown below approximately $1.39 could trigger a sharper decline.
$XRP monthly chart is telling a story most people are missing.
Three consecutive rejection candles at the top. Each one pushed into the purple resistance zone. Each one got sent back down.
The resistance is real. The chart confirmed it three times.
Both assets recently experienced breakout attempts before retracing back toward critical support levels. Soloway described these areas as “make or break” zones where traders can define relatively tight risk parameters.
That risk-reward setup is particularly attractive for active traders because it allows small stop losses relative to potentially large upside targets.
Strong support holds could reignite bullish momentum
Interestingly, Soloway suggested some altcoins actually look healthier than Bitcoin at the moment, provided they continue holding support.
Nasdaq and Federal Reserve Policy Could Determine Bitcoin’s Direction
Perhaps the most important takeaway from Soloway’s analysis is that crypto traders should not view Bitcoin in isolation.
Instead, broader financial markets, especially tech stocks, may continue dictating crypto’s direction in the near term.
Historically, Bitcoin often outperformed the Nasdaq during strong bull runs, sometimes delivering returns several times greater than those of tech equities. But Soloway pointed out that this cycle has looked different.
Despite the Nasdaq’s explosive rally, Bitcoin has only kept pace rather than dramatically outperforming it.
That relative weakness may suggest institutional investors still largely treat Bitcoin as another speculative growth asset rather than a true store of value.
If the Nasdaq continues correcting, Bitcoin could struggle to decouple.
On the other hand, renewed strength in equities could quickly reignite bullish momentum across crypto markets.
For now, the charts remain balanced precariously between those two outcomes.
Bitcoin’s next major move may ultimately come down to whether support levels hold, or whether macro pressures overwhelm the market and trigger a broader risk-off event.
Either way, Soloway believes traders should remain disciplined, flexible, and prepared for volatility. Because in today’s crypto market, both $32,000 and $135,000 remain very much on the table.
Why does Gareth Soloway think Bitcoin could fall to $32,000?
Soloway believes Bitcoin could drop to $32,000 if it breaks below the critical $71,000 support level. According to his analysis, a confirmed bear flag breakdown combined with broader weakness in risk assets like the Nasdaq could trigger a deeper correction across crypto markets.
What is the key Bitcoin resistance level right now?
The main resistance level Soloway is watching is around $83,000. A sustained breakout above that zone could signal renewed bullish momentum and potentially open the door for a rally toward $97,000 and beyond.
Why is $71K important for Bitcoin price action?
The $71,000 level represents the lower boundary of Bitcoin’s current trend channel and a major technical support area. If BTC loses that level decisively, Soloway believes the larger bearish pattern would officially activate.
How high could Bitcoin go in a bullish scenario?
If Bitcoin successfully breaks above $83,000 and later clears resistance near $97,000, Soloway believes the cryptocurrency could eventually rally toward $135,000 based on long-term trend line analysis.
Disclaimer:
The information provided in this article is for informational purposes only. It is not intended to be, nor should it be construed as, financial advice. We do not make any warranties regarding the completeness, reliability, or accuracy of this information. All investments involve risk, and past performance does not guarantee future results. We recommend consulting a financial advisor before making any investment decisions.
Giuseppe Ciccomascolo began his career as an investigative journalist in Italy, where he contributed to both local and national newspapers, focusing on various financial sectors.
Upon relocating to London, he worked as an analyst for Fitch's CapitalStructure and later as a Senior Reporter for Alliance News. In 2017, Giuseppe transitioned to covering cryptocurrency-related news, producing documentaries and articles on Bitcoin and other emerging digital currencies. He also played a pivotal role in establishing the academy for a cryptocurrency exchange website. Crypto remained his primary area of interest throughout his tenure as a writer for ThirdFloor.


 Easy
Easy