


Bitcoin (BTC) has crossed a line that the market spent years treating as untouchable.
After a relentless week of selling, BTC’s price has broken below its 2021 all-time high at $69,420, a level long viewed as the ultimate structural support for the post-ETF cycle.
With price now oscillating between $62,500 and $65,500, Bitcoin is officially in a bear market.
Notably, the cryptocurrency is down roughly 50% from the October 2025 peak near $126,200.
So, is this the time to buy BTC or is more pain ahead? Let’s find out.
Bitcoin printed something the market has never seen before over the last 24 hours. Specifically, the coin’s price fell by more than $10,000 in a single day.
Not even the record $19.5 billion liquidation event on Oct. 10 produced a move of this magnitude.
Since that Oct. 10 crash, the crypto market is now down roughly 50%, erasing an estimated $2.2 trillion in total market capitalization.
Bitcoin has completely wiped out its post-election rally and is now down about 10% since Trump’s election
What’s confusing investors is that, on the surface, the fundamentals haven’t collapsed.
Over the last 60 days, there hasn’t been deterioration in adoption or long-term narratives. Yet, the BTC price has imploded.
To understand why this is happening, you have to go back to Oct. 10. After the record liquidation that day, Bitcoin’s price never truly recovered its internal market health.
Between Nov.15 and Jan. 15, the price was mostly rangebound. But the behavior inside that range was telling. Rallies and selloffs increasingly came with sharp liquidation “gaps” in both directions,
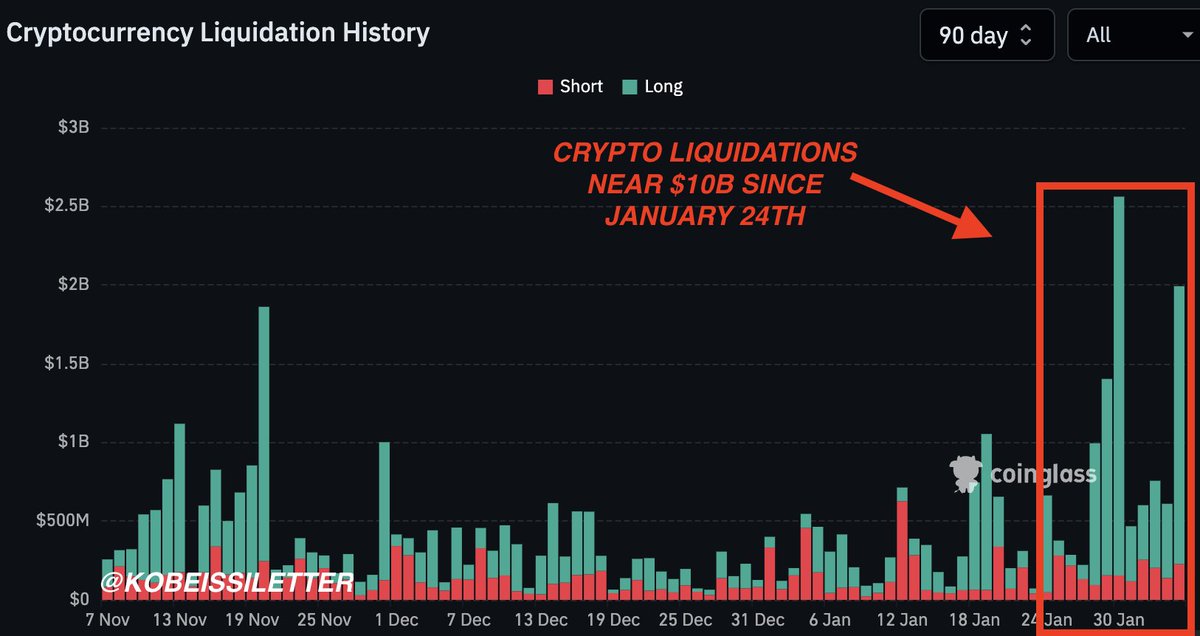
Besides that, institutional behavior confirms the shift. U.S. spot Bitcoin ETFs saw $545 million in net outflows on Feb. 4 alone.
At the same time, wallets linked to the Royal Government of Bhutan reportedly moved 284 BTC ($22 million) to exchanges.
This reinforced the sense that even ultra-long-term holders are de-risking amid rising post-halving mining costs.
That was the quiet warning. The range finally broke to the downside on Jan. 16.
Once that happened, sentiment began to unravel fast.
In fact, the true market top wasn’t the January high; it was Oct. 6, just four days before the record liquidation event. Everything since then has been distribution and decay, not accumulation.
With $69,000 now flipped into heavy overhead resistance, attention has moved lower, to the $60,000 zone.
Around $58,000 sits the 61.8% Fibonacci retracement of the entire 2022 to 2026 advance. Lose that level, and the bear case stops being theoretical.
Below it, the next gravitational pull is Bitcoin’s realized price near $55,325, where the average on-chain holder moves back toward breakeven.
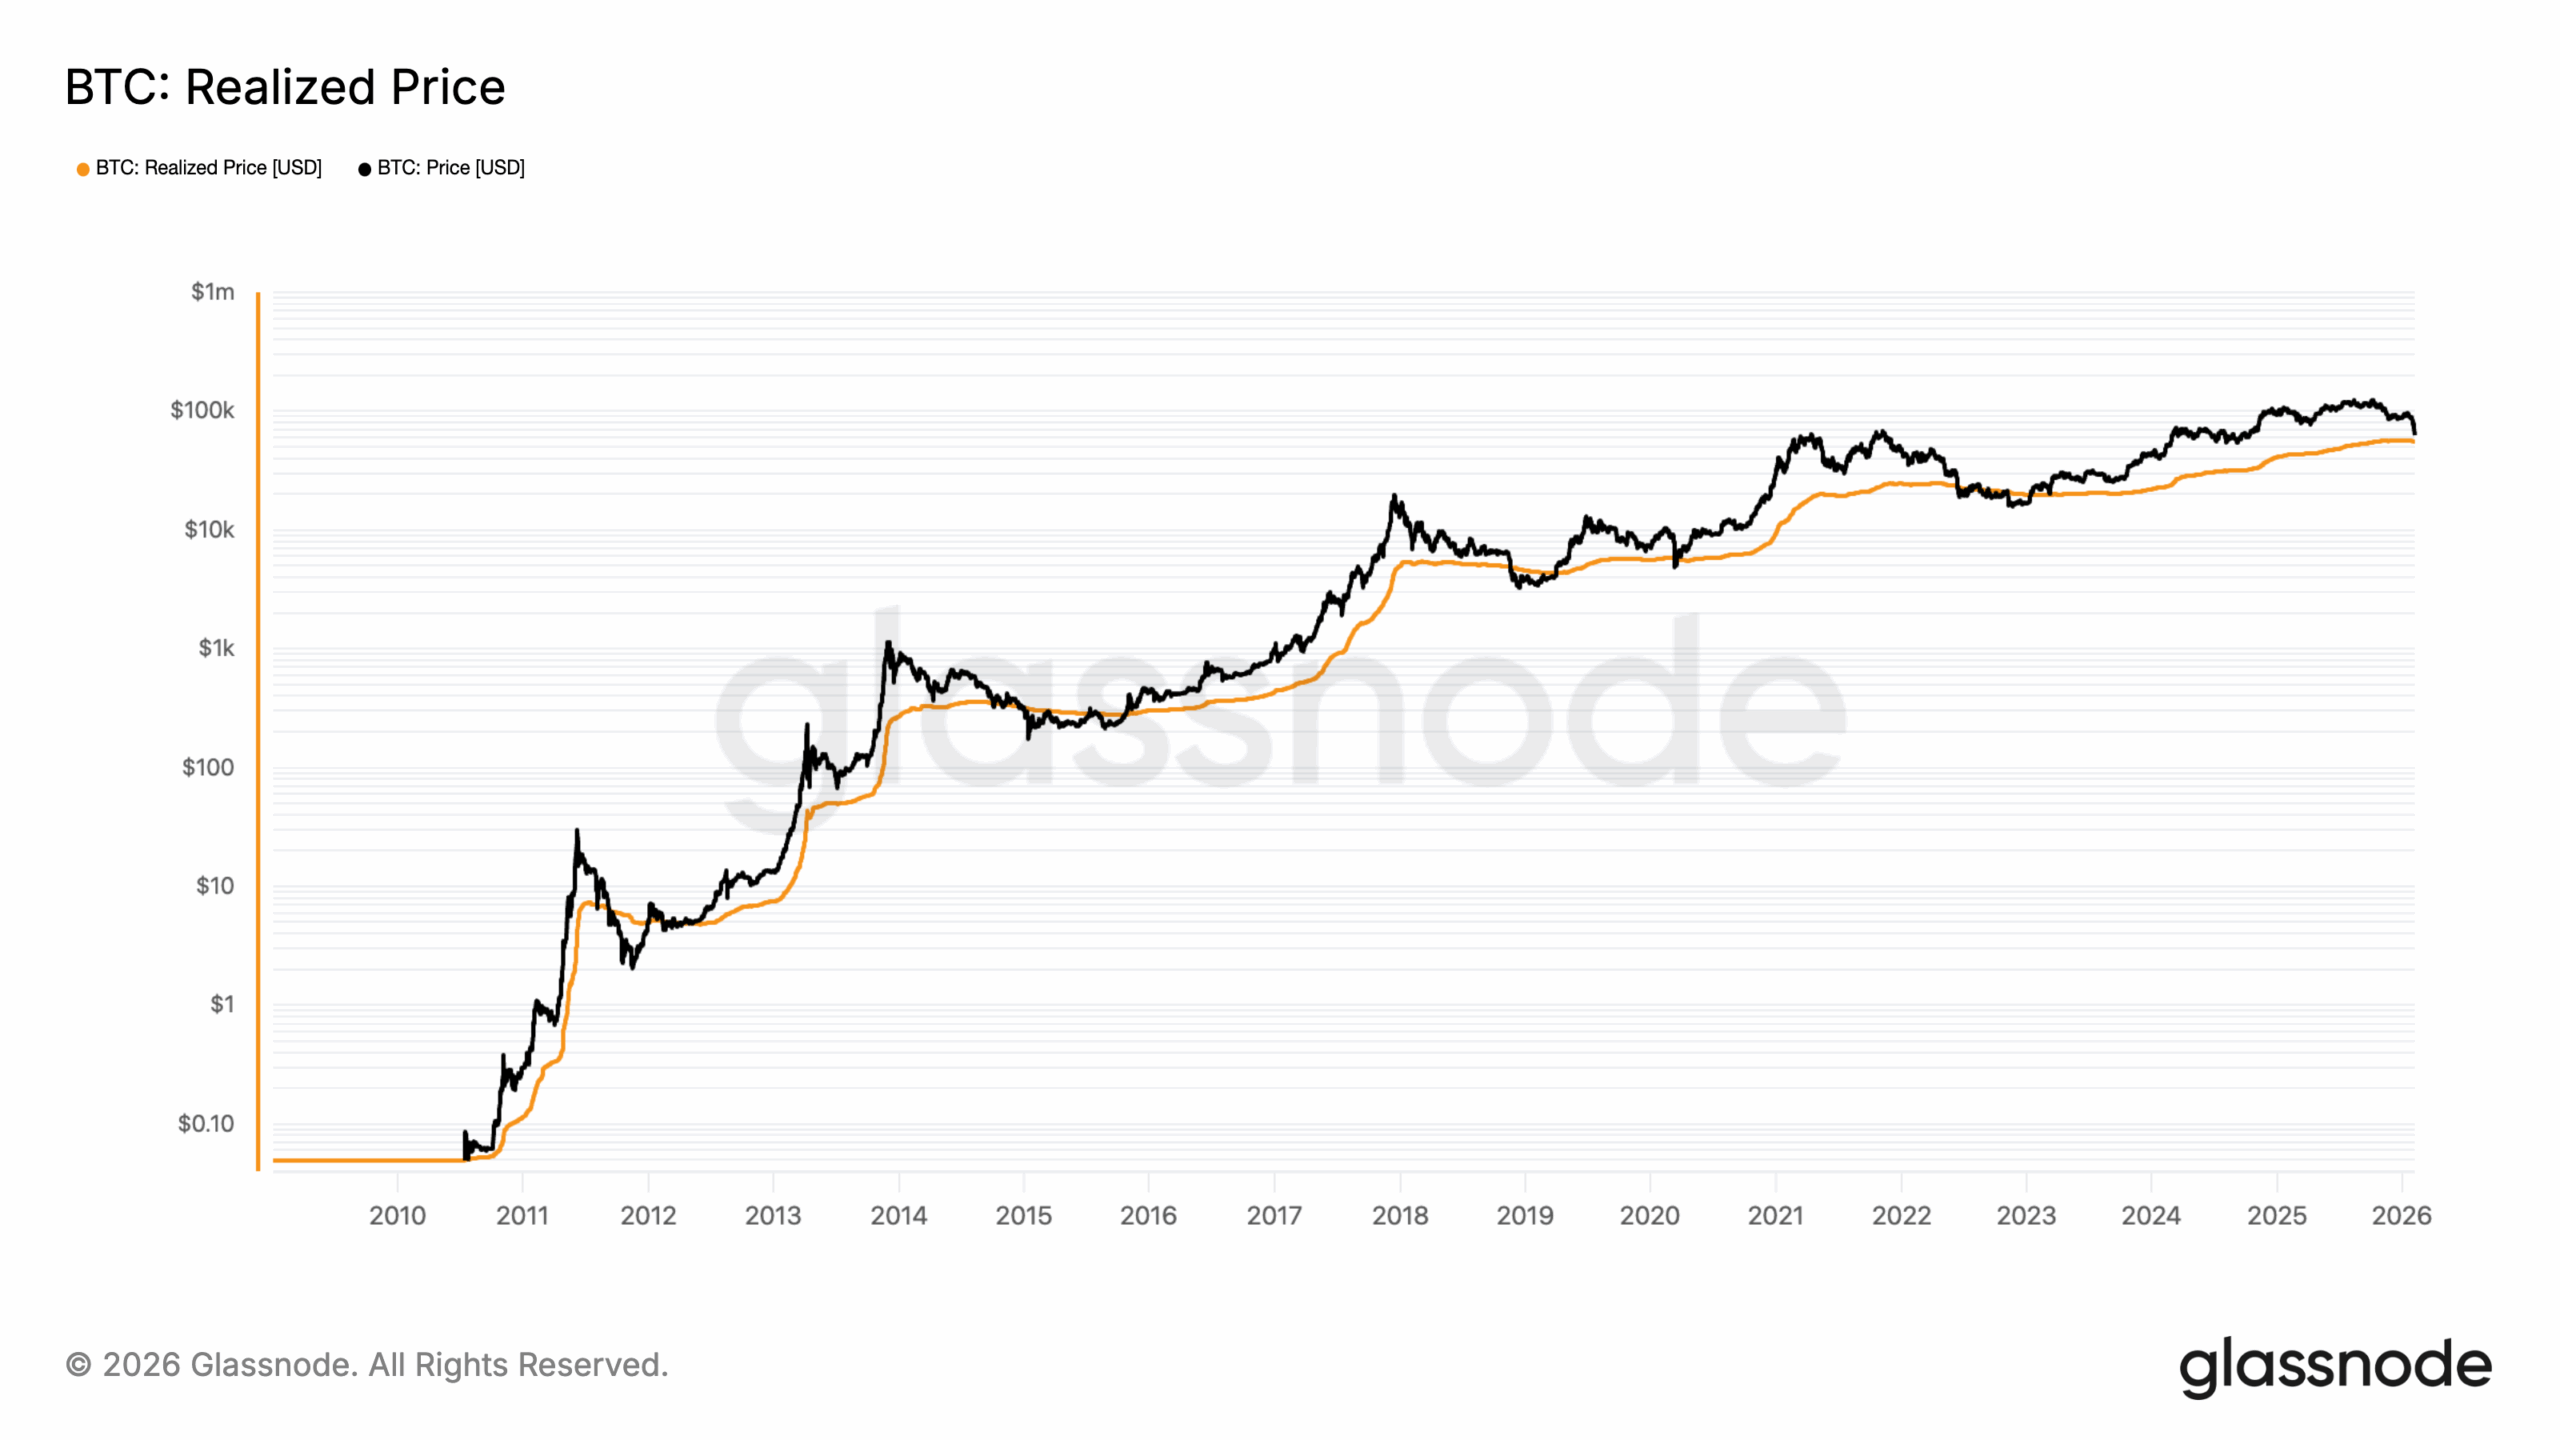
Historically, sustained bull markets occur when the spot price remains above the realized price. However, prolonged bear markets are defined by extended periods below the market’s lows.
In this cycle, BTC has pulled back toward the realized price. However, it has not broken below it. Yet, it risks retesting that point.
However, in an exclusive conversation with CCN, Lacie Zhang, Research Analyst at Bitget Wallet, noted that it might not be time to write Bitcoin off.
According to Zhang, the recent collapse might not mark the start of a prolonged bear cycle, and a rebound could be next.
“The deeply depressed Fear & Greed Index points to extreme caution, but derivatives data suggests we may be closer to a sentiment washout than the start of a prolonged collapse: short-dated implied volatility is elevated, put options are richly priced, and bearish positioning looks crowded. In past cycles, similar conditions have often preceded sharp, technically driven rebounds rather than sustained free-falls,” Zhang added.
Comparatively, during the 2022 bear market, Bitcoin’s price lost its realized price and spent months trading below it, forcing widespread capitulation and resetting market structure.
Today’s setup is different. If price holds above the metric, it would reinforce the view that this drawdown is corrective.
A sustained breakdown below the realized price, however, would signal rising stress and open the door to a deeper, 2022-style risk-off phase.
Furthermore, the pressure is already rippling outward. MicroStrategy, often treated as a proxy for Bitcoin conviction, is trading at 52-week lows after reporting a $12 billion paper loss on its BTC holdings in Q4.
While forced liquidation remains structurally unlikely, the narrative risk rises if BTC drifts toward $60,000.
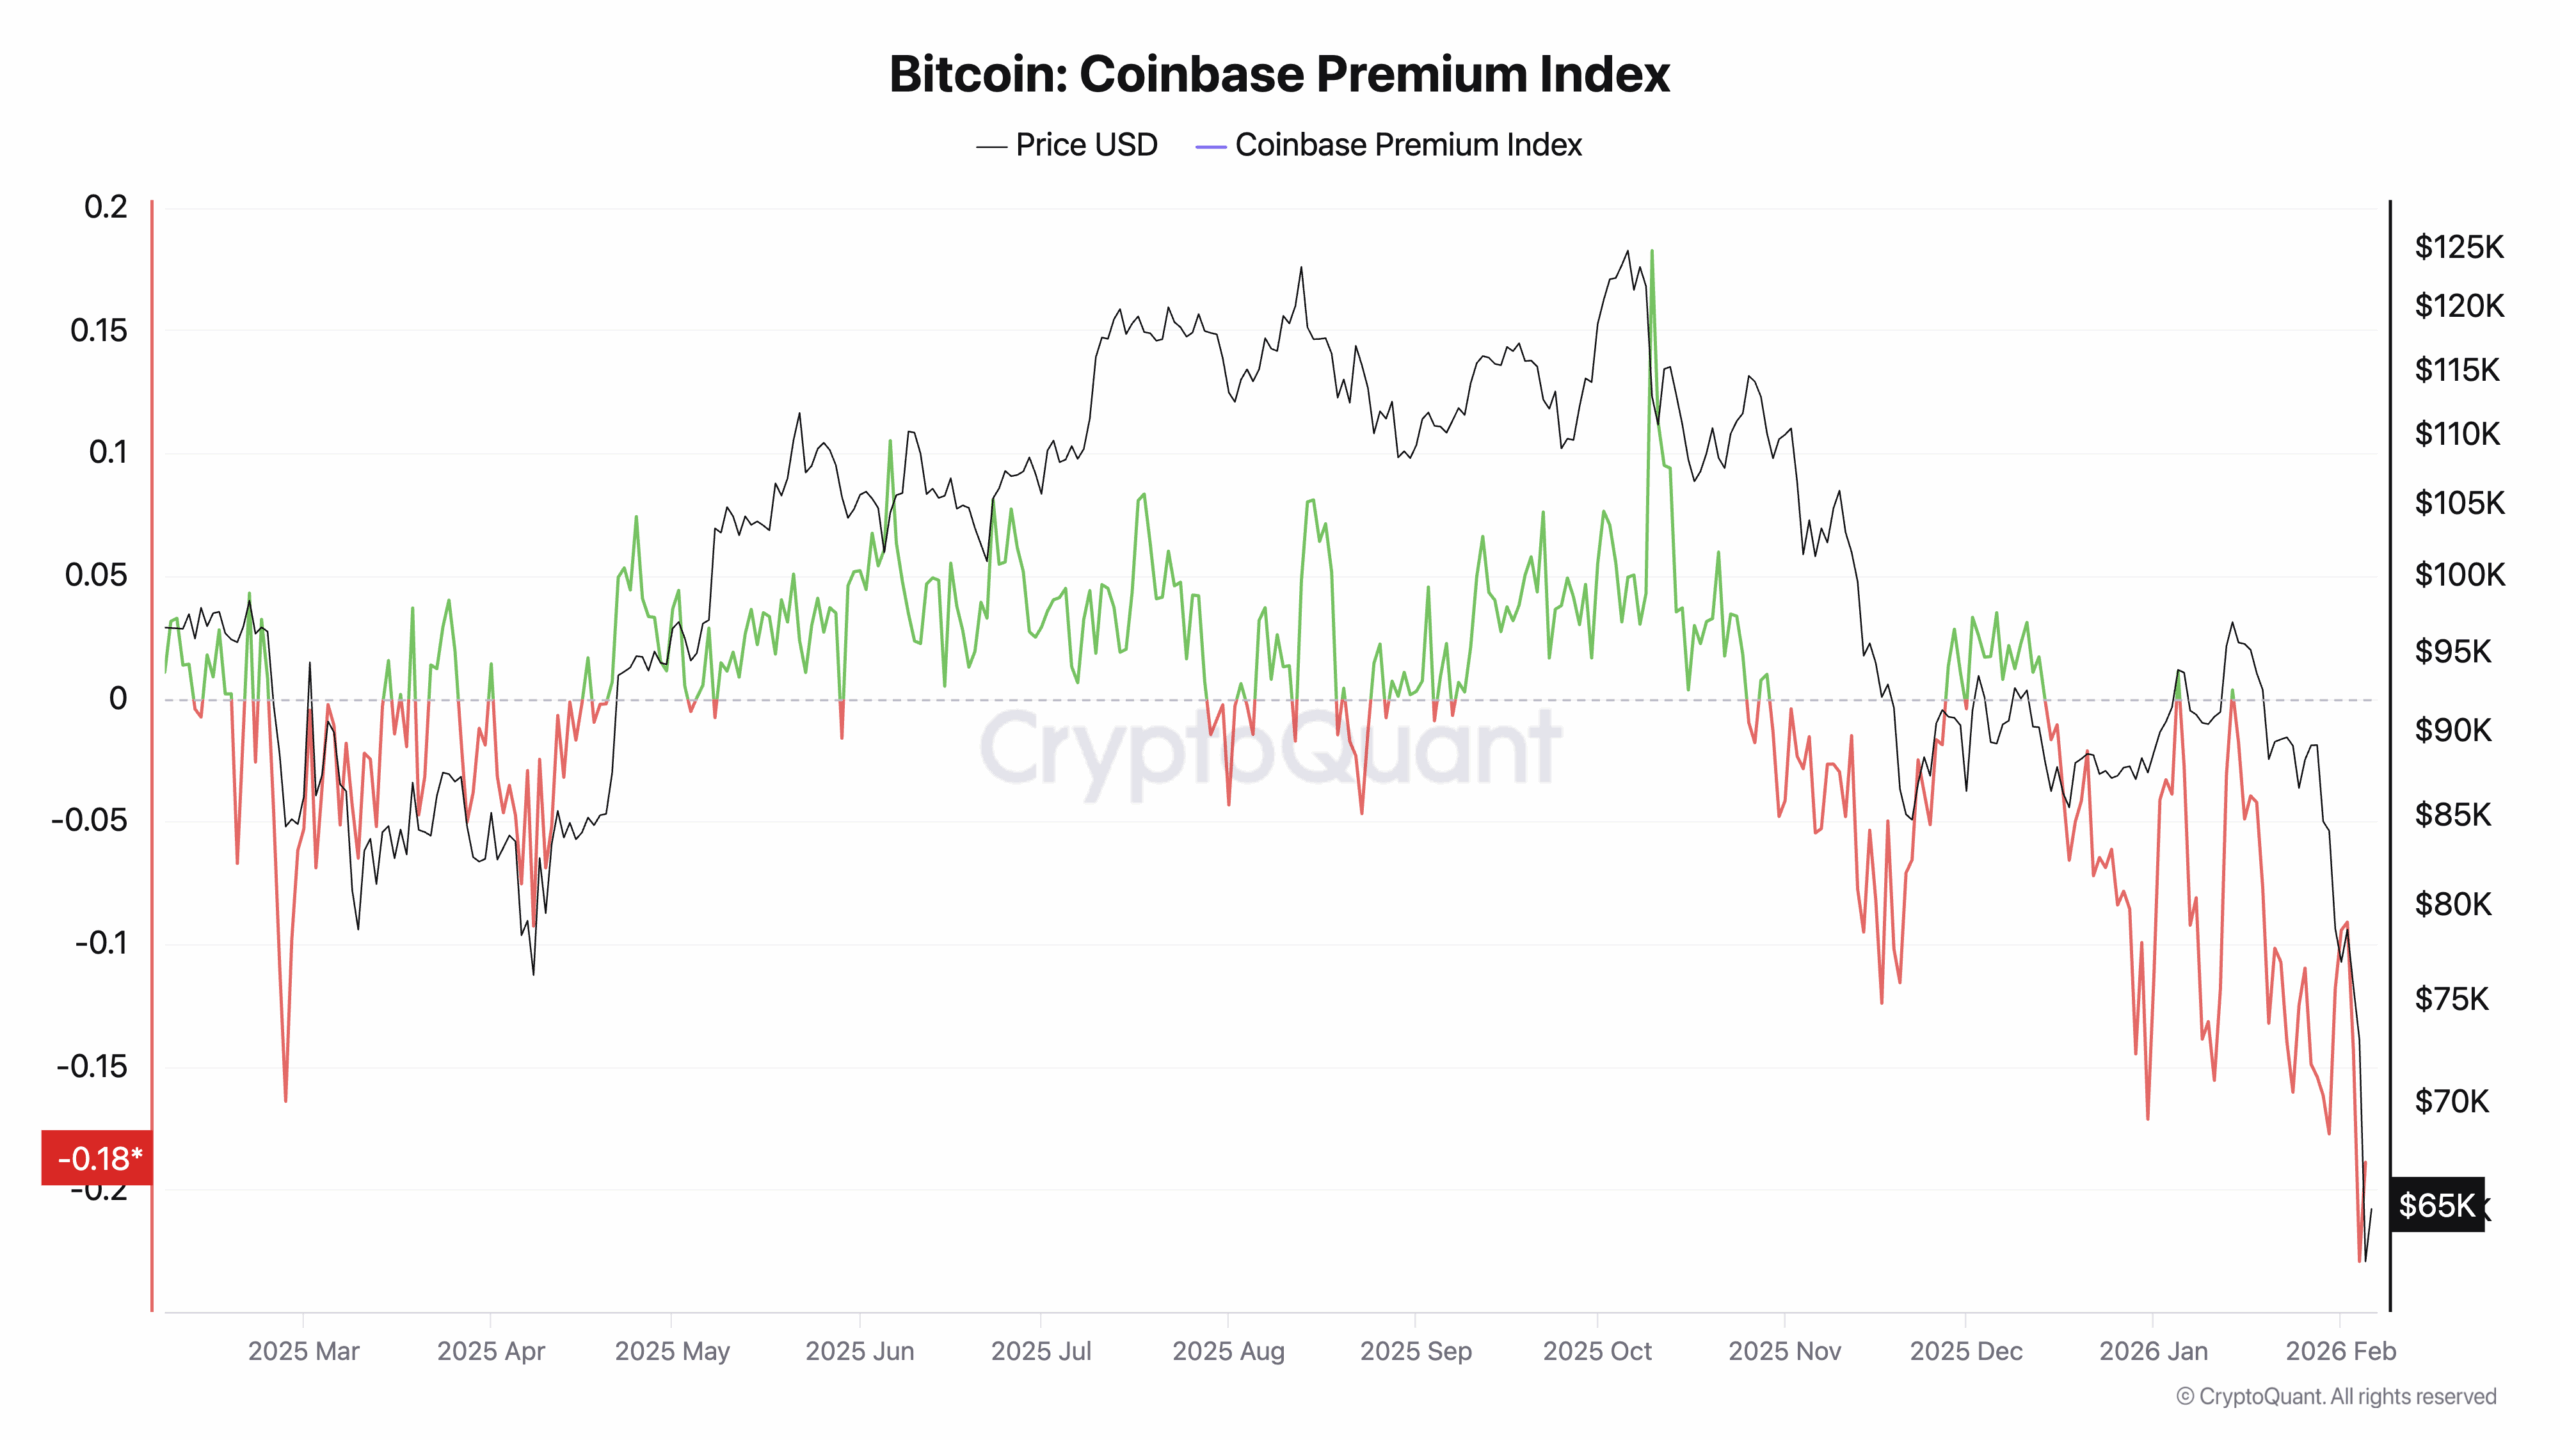
Meanwhile, the Coinbase premium has turned negative, signaling that U.S. institutional desks, not panicked retail, are also driving the selloff.
Besides Zhang, CCN also sought the opinion of Shawn Young, Chief Analyst, MEXC Research.
In Young’s opinion, the recent drawdown is a healthy correction for bull markets. Yet, he noted that Bitcoin’s price rally to its all-time high remains unlikely in the next few months.
“Despite the varying opinions, Bitcoin is still within the bounds of a healthy recovery in a typical bull market. With the price down over 35% from its ATH, I believe BTC has exhausted its selloff options, as shown by multiple metrics,” Young told CCN.
Meanwhile, the drawdown doesn’t look like it’s near resolution yet.
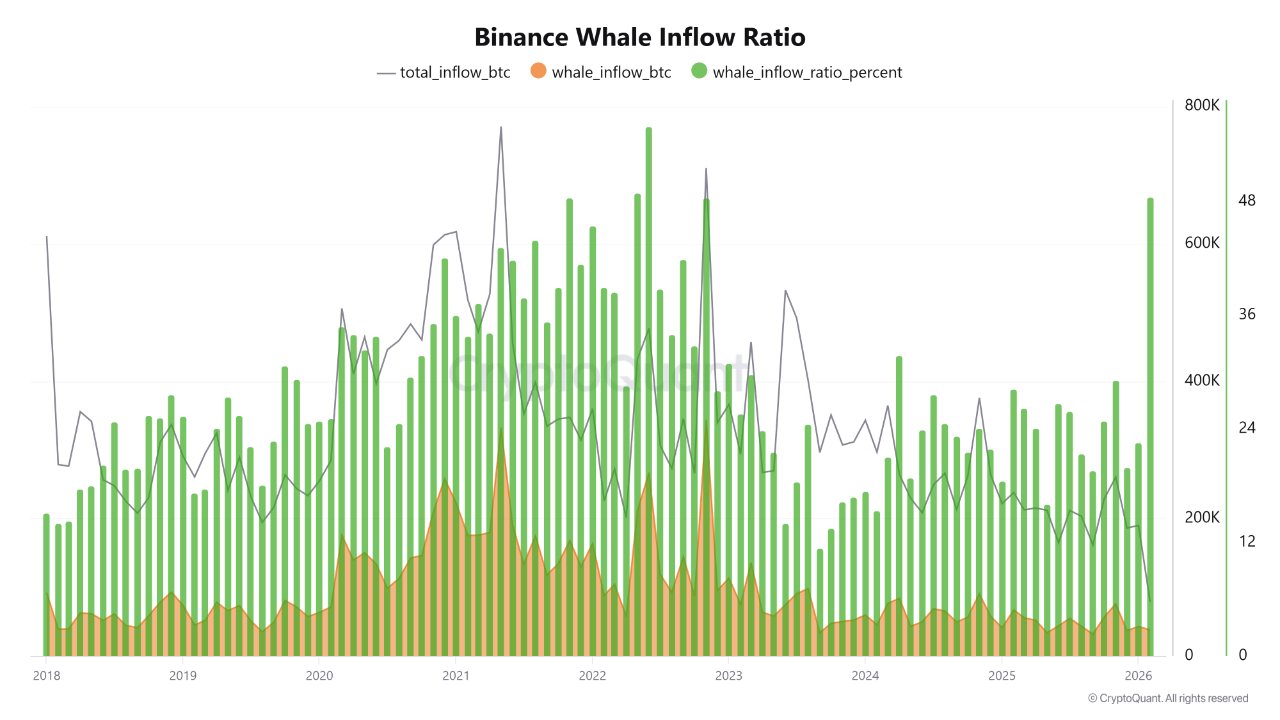
Early February Binance metrics show a sharp shift in large-wallet behavior, with the whale inflow ratio jumping to its highest level since 2022.
While inflows don’t guarantee selling, that kind of spike typically signals intent: big wallets don’t move size onto exchanges to admire it. If even a portion of that supply hits the market, the path of least resistance tilts lower.
Therefore, a break toward sub-$60,000 becomes increasingly possible.
Santiment’s ownership data adds the second leg of the story. According to the on-chain analytic platform, whales are reducing exposure while retail keeps leaning in.
Wallets holding 10–10K BTC have seen their share of supply fall to a 9-month low (68.04%). Specifically, the -81,068 BTC net reduction over just eight days reads like distribution into liquidity windows.
At the same time, “shrimp” wallets — those holding <0.01 BTC—are climbing to a 20-month high share. The number itself is small, but the behavior is loud.
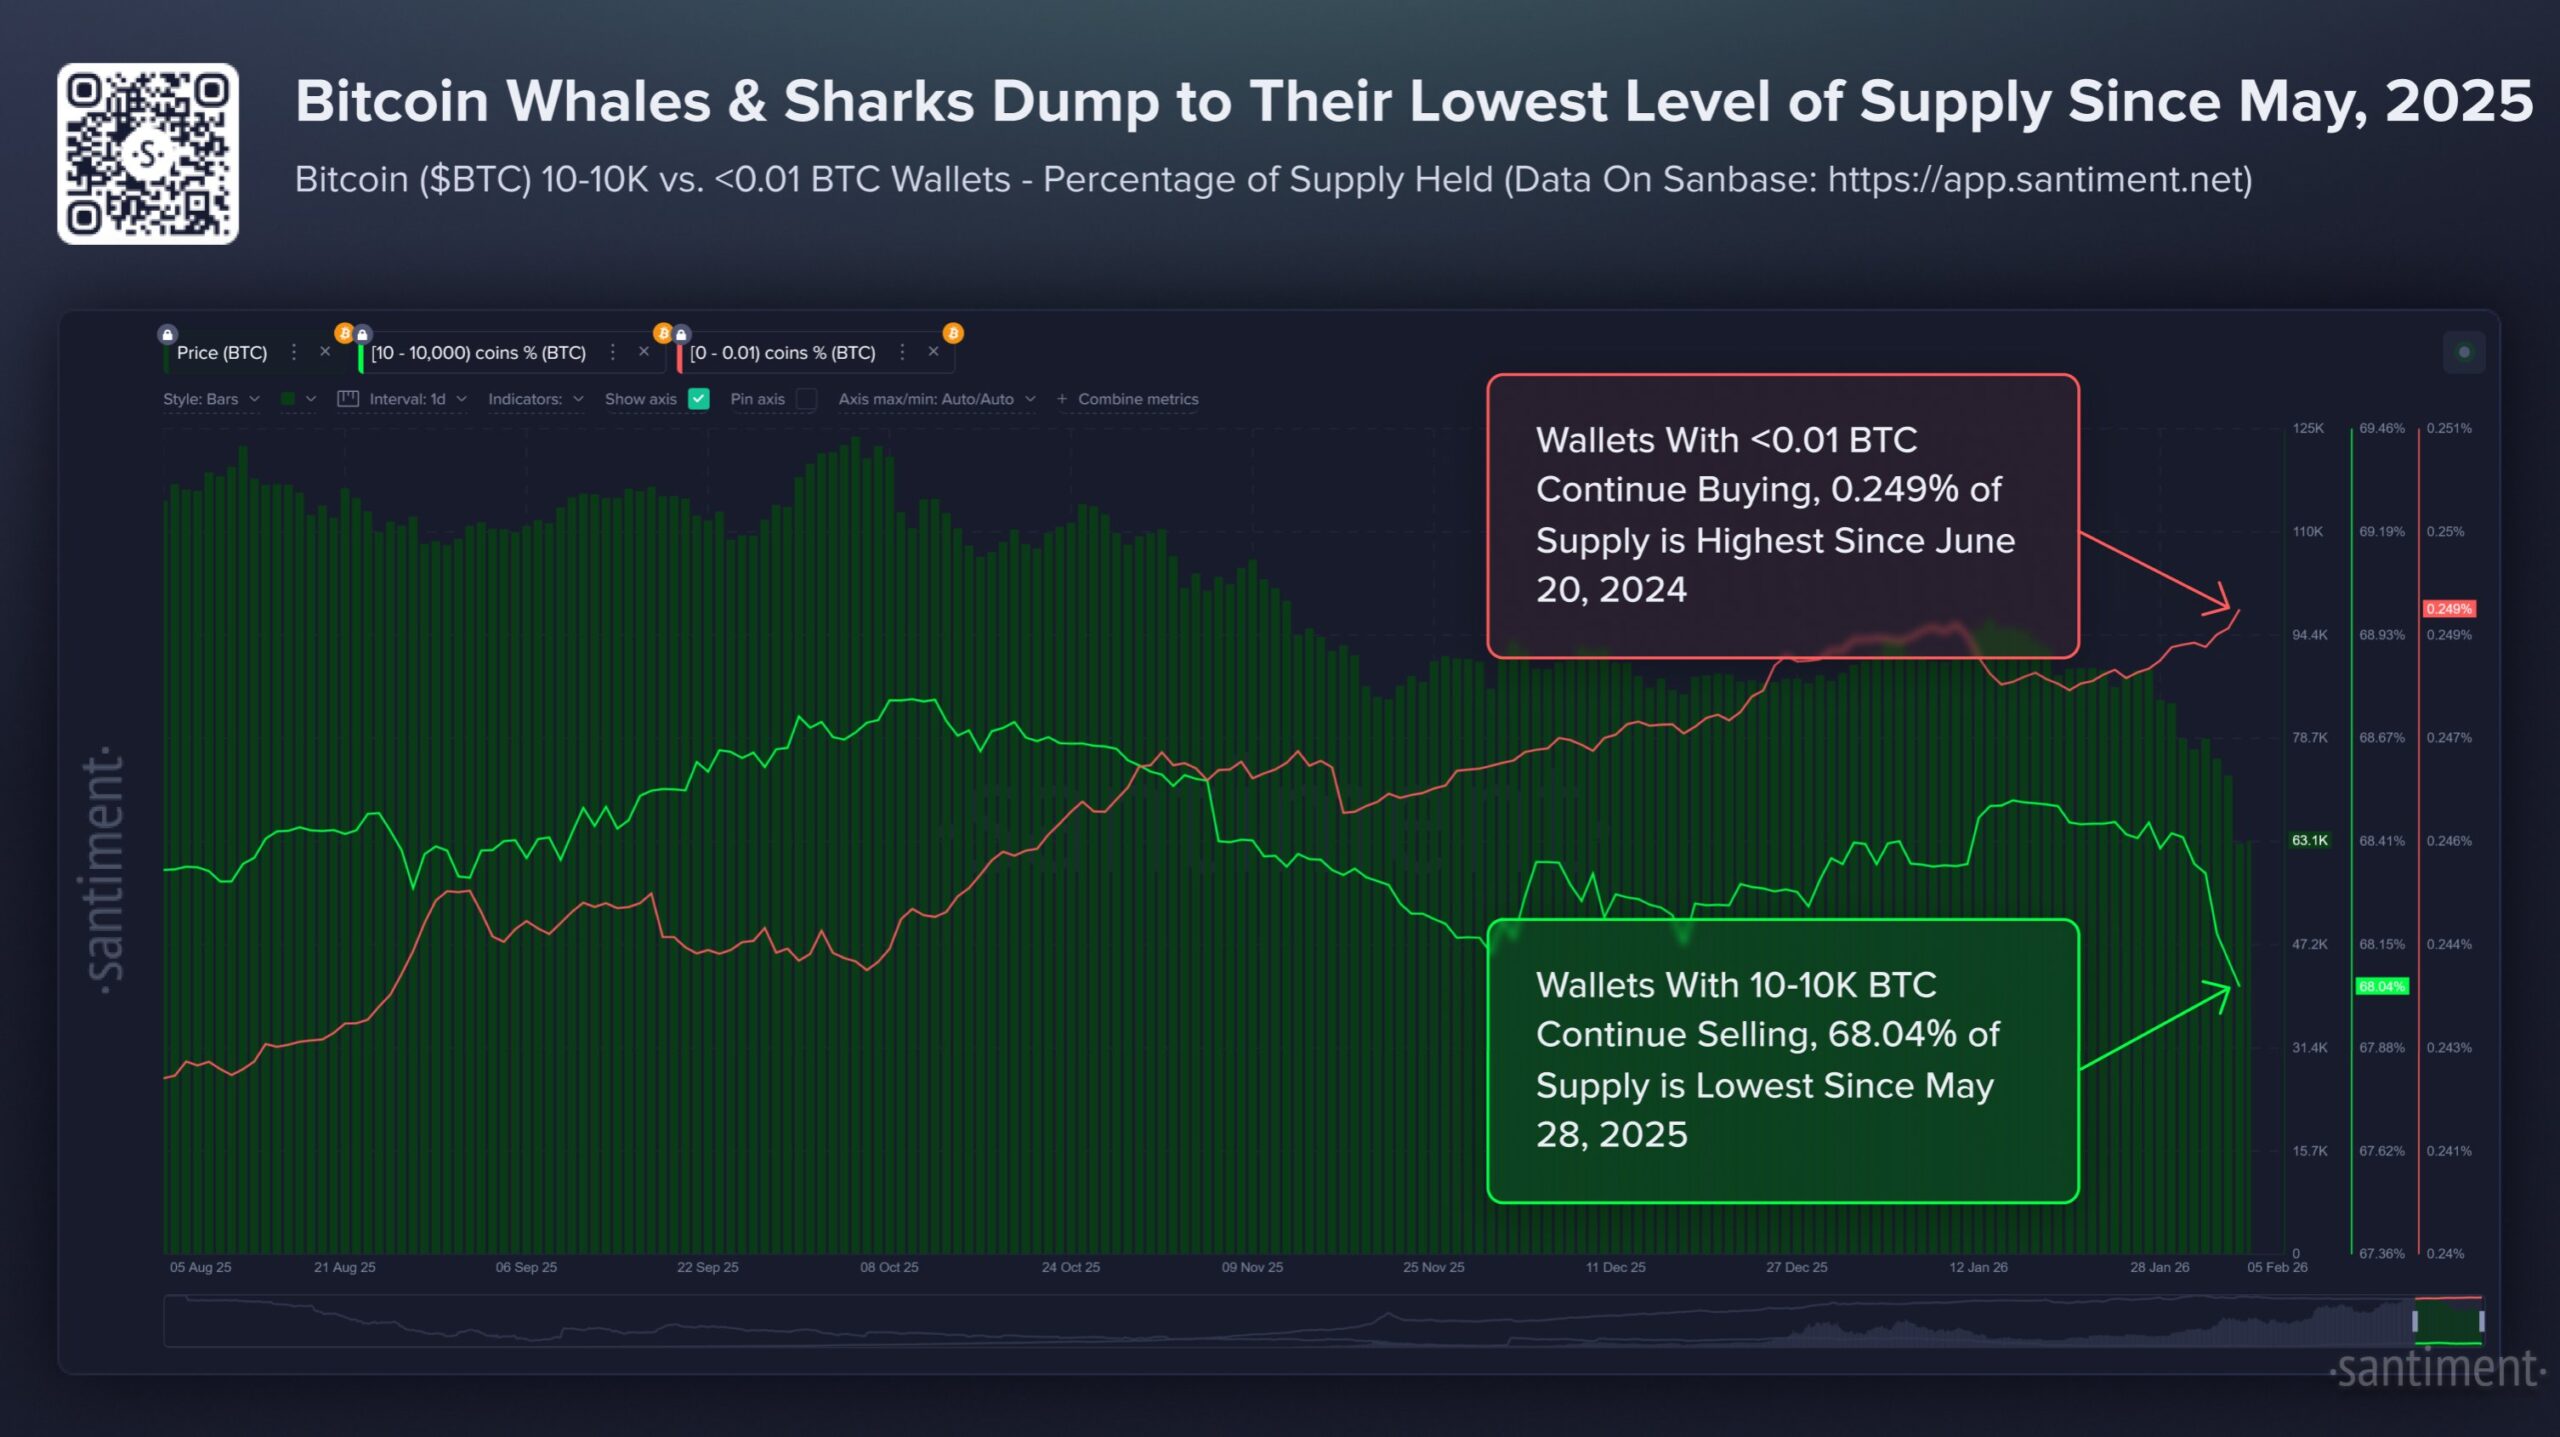
Retail still sees every dip as an entry, not a warning. That’s exactly the mix that tends to extend bear phases; smart money sells time, while the crowd buys hope.
However, while retail’s bid can slow margin declines, it usually can’t absorb sustained whale distribution.
Therefore, as it stands, Bitcoin’s price will likely continue declining in the short term.
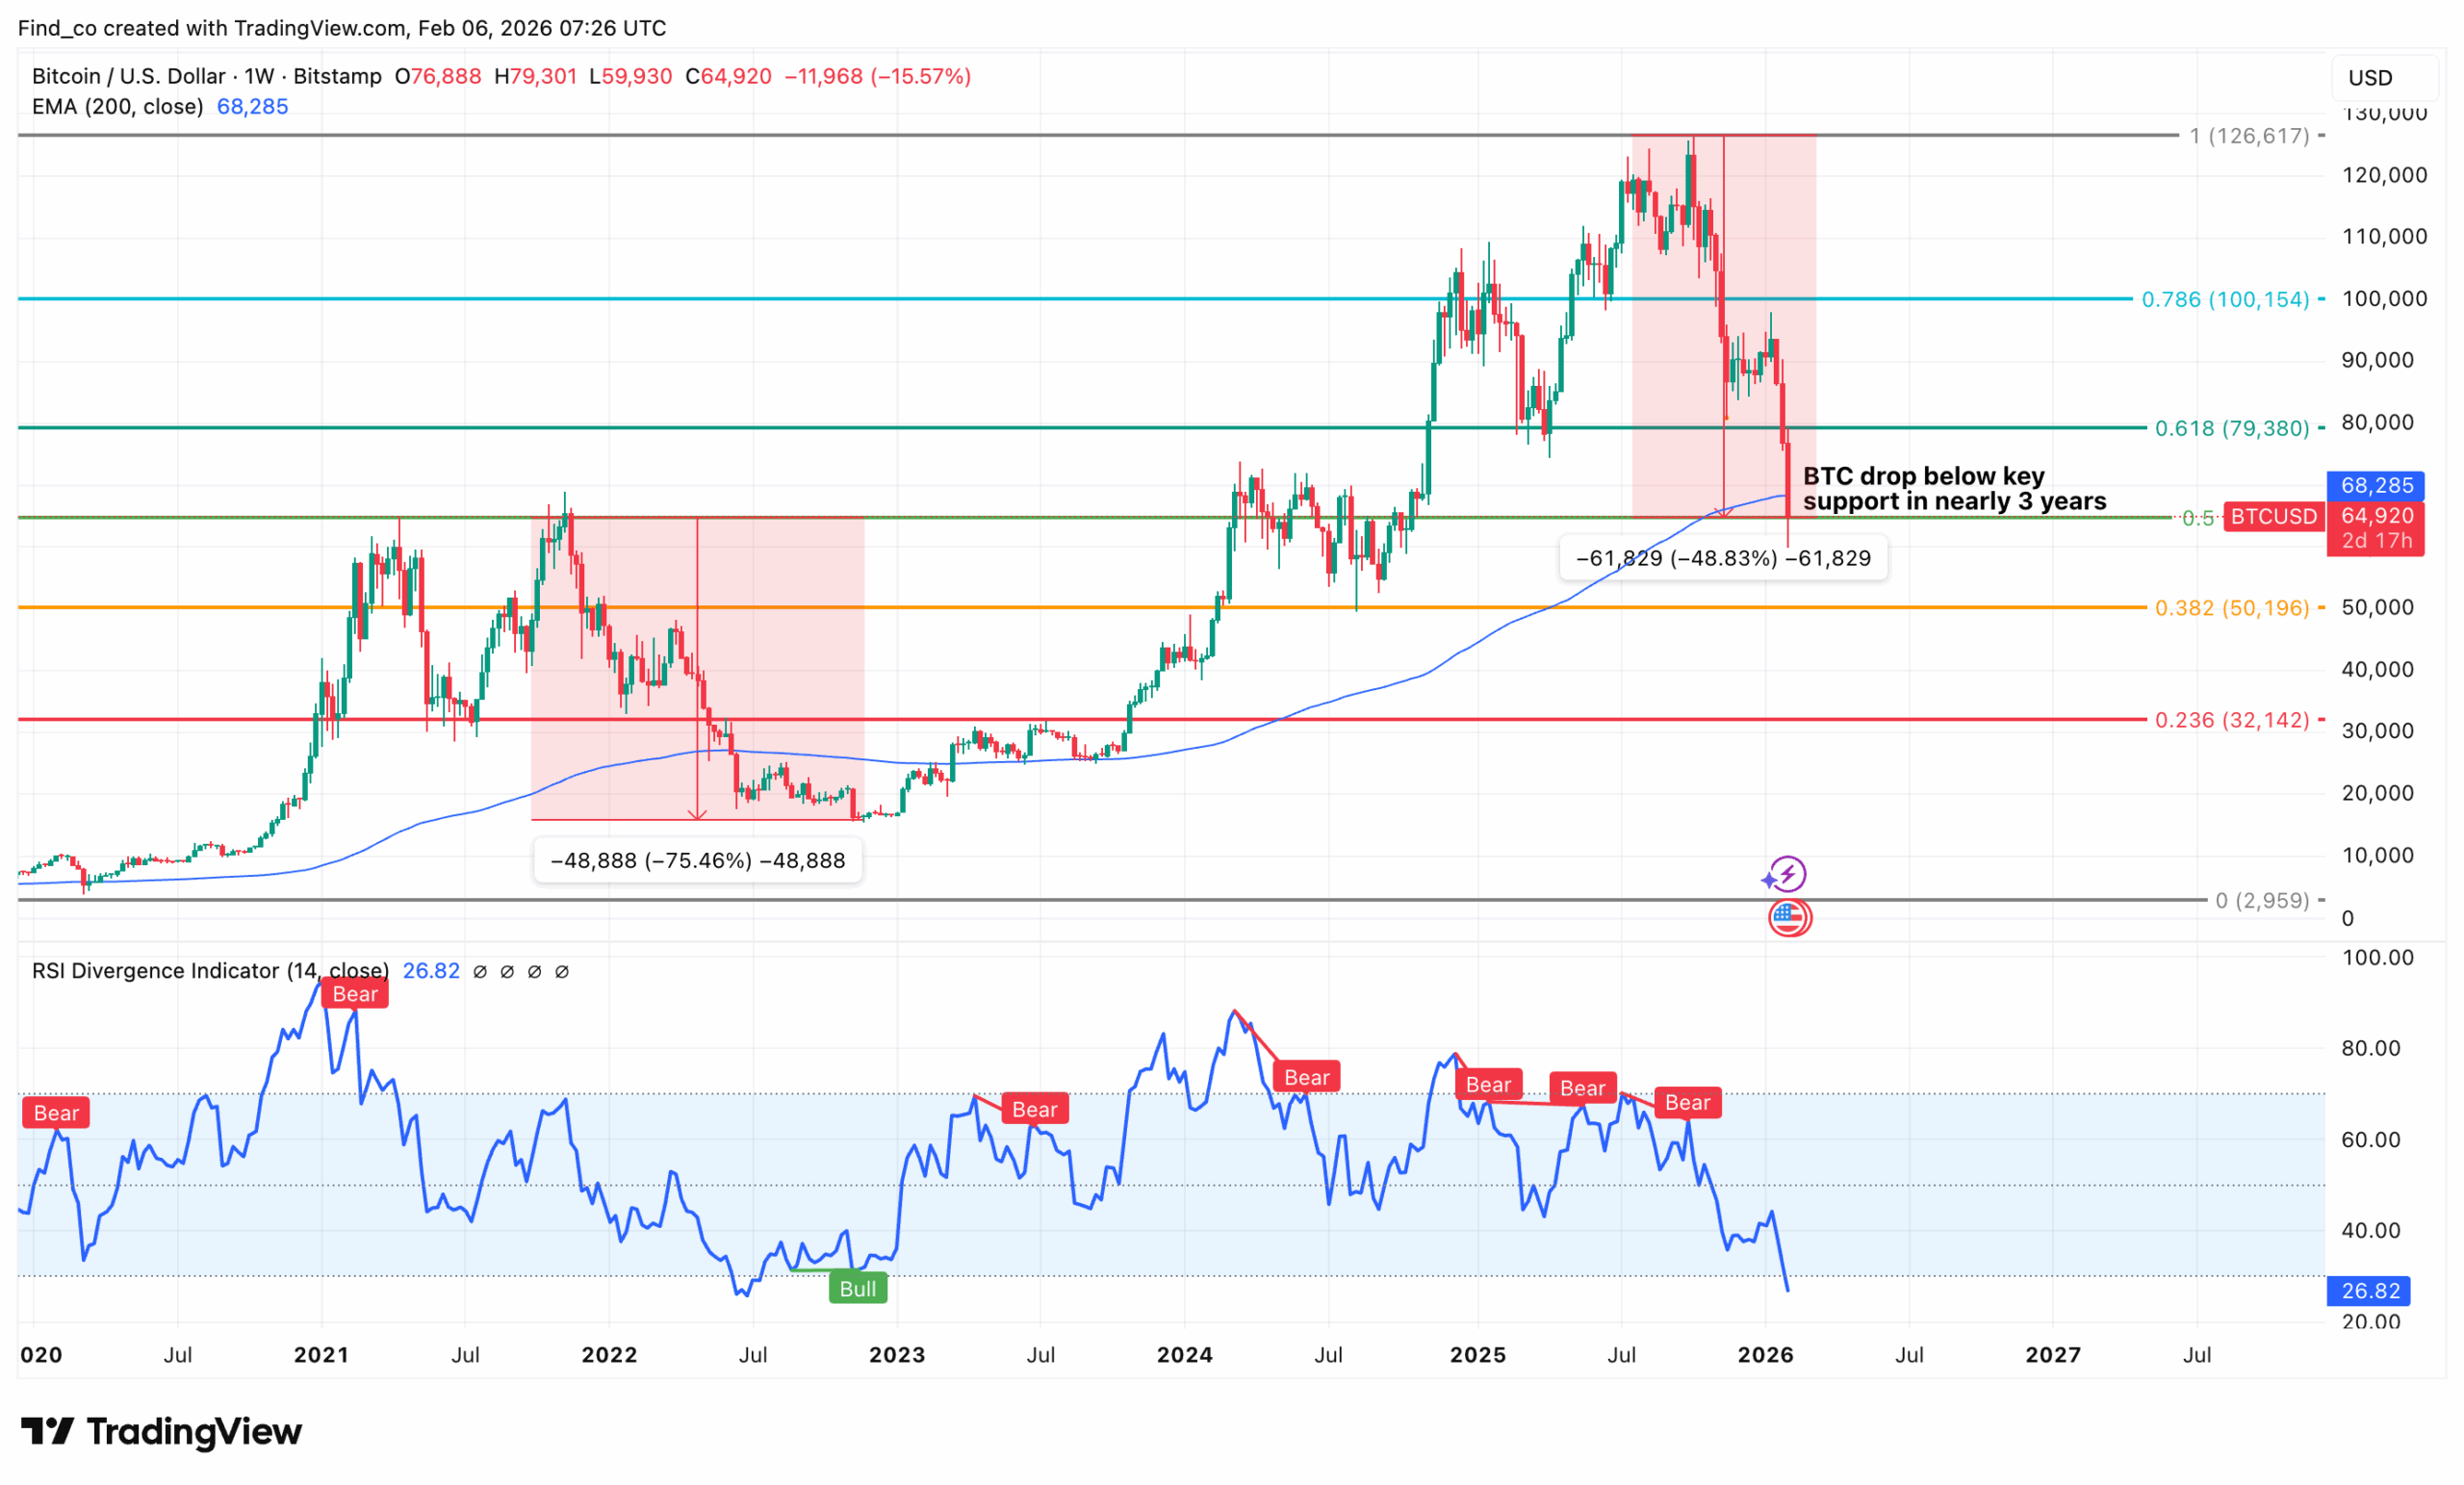
From a technical perspective, Bitcoin’s price has now broken below a key long-term support level that had held for nearly three years.
On the weekly chart, price has fallen below the mid-range support zone around the 0.5 Fibonacci level and slipped below the rising 200-week moving average.
Historically, this moving average has acted as a critical bull–bear boundary. Losing it often signals that downside risk is no longer just a short-term correction.
When compared to the 2022 bear market, there are striking similarities. In 2022, BTC also lost major Fibonacci supports, followed by a sharp drawdown of roughly 70–75% from the cycle high.
The current decline, while not yet as deep in percentage terms, is unfolding in a similar pattern. The highlighted move on the chart shows a drawdown approaching 50%, which historically has been a midpoint rather than a final low in deep bear phases.
However, analyst Benjamin Cowen opined that BTC could experience a notable rebound in March. But he added that the possible rally might not last, based on historical data.
“One common pattern in midterm years for #BTC is that we see a lot of weakness going into early February, followed by strength into March. Then weakness again going into April/May,” Cowenstated.
In addition, the Weekly Relative Strength Index (RSI) has dropped into deeply oversold territory. The last time this happened was November 2018.
During that period, Bitcoin’s price traded around $5,404 (a 36% drawdown for the month).
Looking ahead, if Bitcoin continues to behave as it did in 2022, the next critical test lies significantly lower, around the 0.382 Fibonacci region and potentially closer to the prior cycle’s long-term cost basis zones.
Should this be the case, BTC risks falling to $50,196.
However, one key difference this time is that on-chain fundamentals and realized price are much higher than in 2022, which could limit downside compared to the last bear market.
The bigger question now is duration, not direction. Analysts are increasingly framing the market as moving from distribution into despair, a familiar late-cycle transition.
Historically, Bitcoin bear markets carve out 75% to 85% peak-to-trough drawdowns. By that measure, the current 50% decline is mild. But the speed is what’s different.
Roughly $500 billion in crypto market value was erased in a single week, a pace that typically leads not to V-shaped recoveries, but to long, grinding accumulation phases.
Interestingly, Cowen noted in another post that Bitcoin might not reach the bottom until October 2026.
“Bear markets suck. They don’t last forever though. Better times will come. Still think October 2026 is a good candidate for a major market low, but open minded to sooner if the meltdown accelerates,” He added.
Whether history repeats exactly or not, one thing is clear. For now, Bitcoin’s price has fallen to a level that defines the post-2021 recovery narrative.
Until it reclaims $69,000, rallies are likely to be treated as counter-trend moves. What comes next looks less like a bounce and more like the opening chapter of a crypto winter defined by patience, balance-sheet repair, and selective survival.
Victor Olanrewaju is a crypto analyst and reporter at CCN with deep roots in on-chain research and technical analysis. His crypto journey began in 2017, but it was the 2020 Uniswap airdrop that sparked a full-time pivot into the space.
With a foundation in copywriting, Victor honed his craft creating high-converting content for leading crypto brokers — most notably an XRP price prediction that ranked #1 on Google during the 2021 bull run.
He later joined AMBCrypto in 2022, where he combined storytelling with technical and on-chain analysis to cover key market narratives.
In 2024, he expanded his expertise at BeInCrypto, collaborating with analysts and using tools like Glassnode, Santiment, and IntoTheBlock to break down Bitcoin and altcoin trends.
At CCN, Victor covers the top cryptocurrencies, memecoins, macro shifts, blending real-time insights with deep-dive metrics.
He holds a Bachelor’s degree in Physics from the University of Ibadan, equipping him to simplify complex data for a wide audience. Follow his work or connect on LinkedIn or X.