Bitcoin’s correlation with tech stocks may be misleading. Explore how BTC is being mispriced and what it means for the future. | Credit: CCN.
Share
Key Takeaways
Bitcoin is trading like a tech stock due to institutional portfolio behavior, not fundamentals.
The correlation with software equities is driven by liquidity cycles and risk management, where funds buy and sell both together.
Bitcoin’s core properties remain unchanged: fixed supply, no earnings exposure, no AI disruption risk.
This creates a potential mispricing, where BTC is valued using the wrong framework.
On April 29, 2026, 10x Research published a report with a pointed thesis.
Bitcoin’s correlation with high-growth software stocks is not a signal about what Bitcoin is.
It is a signal about who currently owns it.
Sponsored
Disclosure
We sometimes use affiliate links in our content, when clicking on those we might receive a commission at no extra cost to you. By using this website you agree to our terms and conditions and privacy policy.
10x Research: “One Of The Most Important Mispricings Of This Cycle”
The report, titled ‘Bitcoin Is Not a Tech Stock: Why the Software Correlation Is a Mispricing, Not a Signal,’ framed the current price action as one of the most important mispricings of this cycle, one produced by market structure rather than by any change in Bitcoin’s underlying properties.
Bitcoin Is Not a Tech Stock: Why the Software Correlation Is a Mispricing, Not a Signal
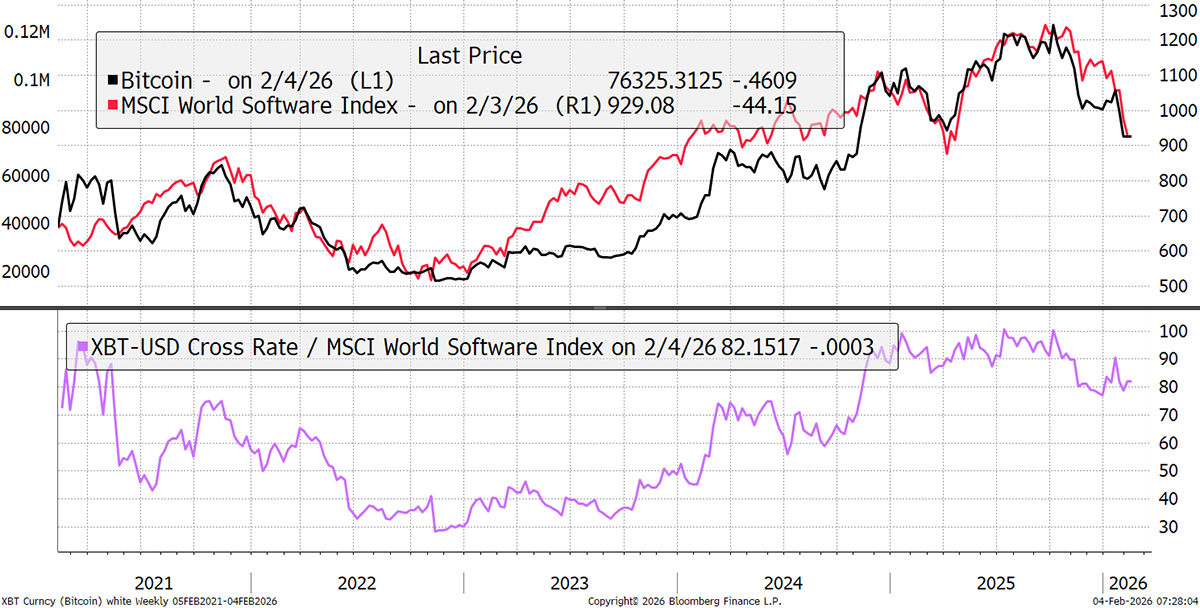
Bitcoin has spent the past several years trading in near-perfect lockstep with high-growth software stocks, rising and falling with the Nasdaq as if it were just another tech bet.
Bitcoin has spent the past several years trading in near-perfect lockstep with high-growth software stocks, rising and falling with the Nasdaq as if it were just another tech bet.
When AI began threatening SaaS business models in late 2025, Bitcoin followed the IGV Software ETF lower, almost tick-for-tick.
To many investors, the message seemed clear: Bitcoin is a tech asset, and tech is under pressure.
The case that Bitcoin belongs in the same asset bucket as software stocks is not just intuition.
By early 2026, it had become a measurable reality.
On a 30-day rolling basis, Bitcoin’s correlation with the iShares Expanded Tech Software ETF (IGV) had risen to 0.73, according to ByteTree Research.
The IGV was down roughly 20% year-to-date, while Bitcoin had fallen 16%.
To many investors, that parallel descent closed the argument: Bitcoin is a high-beta software name, and software is under pressure from AI disruption.
The 6-month correlation between Bitcoin and the Nasdaq reached 92% by September 2025.
By April 2026, Reuters reported that the Bitcoin-to-stocks correlation had hit a record 0.96, up from an average of just 0.4 before recent geopolitical tensions.
This meant that roughly 92% of Bitcoin’s price variance could be explained by equity market movements.
But correlation is not causation. And the mechanism driving these numbers tells a completely different story from the one the price action implies.
Correlation Did Not Always Exist and That Matters
The most important fact about Bitcoin’s current correlation with equities is that it is historically new, not structurally permanent.
Examining daily returns from January 2014 to April 2025, the correlation between Bitcoin and major equity indices was 0.2.
When parsed into smaller three-year periods, correlations remained non-correlated in the initial two periods.
In 2020, the correlations jumped into a positive relationship and generally sustained higher levels over the last five years.
Prior to 2020, rolling correlations were primarily between -0.2 and 0.2. In early 2020, the correlation experienced a positive jump to about 0.5.
This is not a subtle shift. For the first decade of Bitcoin’s existence as a tradeable asset, it had essentially no relationship with stock market movements.
The correlation is a product of the 2020s, not of the asset itself.
Whatever is driving it emerged during a specific period and under specific conditions, which means it can reverse under different conditions.
Research identifies key institutional milestones as pivotal events driving increased correlation.
The introduction of Bitcoin ETFs and the inclusion of Strategy in the Nasdaq 100 caused correlations to peak at 0.87 in 2024.
In other words, the correlation largely tracks when Wall Street began participating, not when Bitcoin was created or what it is designed to do.
Spot ETF Approval Was a Structural Catalyst, Not a Fundamental Revelation
Immediately following January 2024, the correlation coefficient shifted to a sharp upward trend.
This reversal suggests that the approval of the Bitcoin Spot ETF acted as a catalyst, transforming Bitcoin from an isolated asset into one that moves in tandem with traditional equities.
Institutional investors increasingly began treating Bitcoin as a ‘risk-on’ asset similar to technology stocks, rather than a diversified hedge.
That is a precise and important finding. What changed in January 2024 was not Bitcoin’s protocol, its supply schedule, or its use case. What changed was the dominant buyer.
13F filings show institutional investors held $21.2 billion in Bitcoin ETF holdings at the end of Q1 2025, representing a 22.9% share of total US Bitcoin ETF AUM.
Bitcoin previously attracted the same speculative capital that flowed into high-growth tech stocks.
Both assets benefit from loose monetary policy and suffer when the Federal Reserve tightens.
But ‘benefit from loose policy’ describes hundreds of asset classes. It does not make them identical.
BlackRock’s IBIT reached approximately $50 billion AUM in less than one year, representing the most successful crypto ETF launch in history.
When the world’s largest asset manager is the primary buyer of an asset, that asset begins reflecting the behavioral patterns of institutional portfolios, not its own fundamentals.
The tail is wagging the dog.
Correlation Spikes During Stress, Then Fades
The higher positive correlations are frequently evident during stressed market environments.
For example, February to March 2020 when COVID-19 started, in 2022 when the Ukraine war started and the Federal Reserve increased interest rates, from July to October 2023, and January to early April 2025.
This implies an asymmetrical correlation relationship, meaning the positive correlation frequently increases when the market environment tends to be stressed or when uncertainty increases.
This asymmetric pattern is not what you would observe if the two assets were structurally the same.
You would expect consistent co-movement across regimes.
Instead, the data shows correlation spiking during liquidation events and retreating during calmer periods.
That is the fingerprint of a shared holder base selling the same book simultaneously, not a shared fundamental relationship between the assets.
Correlation between Bitcoin and IGV collapsed from near 1.0 in early February to 0.13 after the conflict began, before partially recovering to around 0.7.
Bitcoin rose more than 5% and traded back above $69,000. IGV, in contrast, fell more than 2% since the conflict began.
A correlation that can drop from 1.0 to 0.13 in a matter of weeks is not structural. It is a market regime artifact.
Bitcoin Has No Software Business Model and Cannot Be Disrupted by AI
The core driver of the Bitcoin-software correlation is a severe, earnings-led correction in the software sector.
The iShares Expanded Tech-Software Sector ETF (IGV) has fallen 15% in February alone, marking its worst monthly performance since the Great Financial Crisis.
The catalyst is clear: fears of AI disruption are toppling traditional software economics.
Now examine whether any of that logic applies to Bitcoin.
Software companies derive value from recurring subscription revenue, gross margin expansion, and customer lock-in.
When AI compresses the cost of building software by an order of magnitude, the pricing power of existing SaaS platforms deteriorates.
Enterprise customers can now build internally what they previously had to license. That disrupts a specific cash flow structure.
Bitcoin has no cash flows. It has no customers who might switch providers. No venture-backed startup can raise capital and ship a competing version that undermines Bitcoin’s network effects in the way a newer SaaS platform can undercut an incumbent on pricing.
Bitcoin’s ‘product,’ if you must call it that, is the scarcity and security of the network itself, both of which are maintained by mining hardware that has had no meaningful relationship to the software industry since 2013.
Bitcoin’s correlation with the software sector has surged to 0.73. This is a strong positive relationship, meaning Bitcoin’s price now moves in lockstep with software stocks roughly 73% of the time.
Software companies operate with flexible capital structures.
They can dilute shareholders through secondary offerings, employee stock compensation plans, and acquisition-related share issuances.
The equity float of any major SaaS company can expand materially based on management discretion.
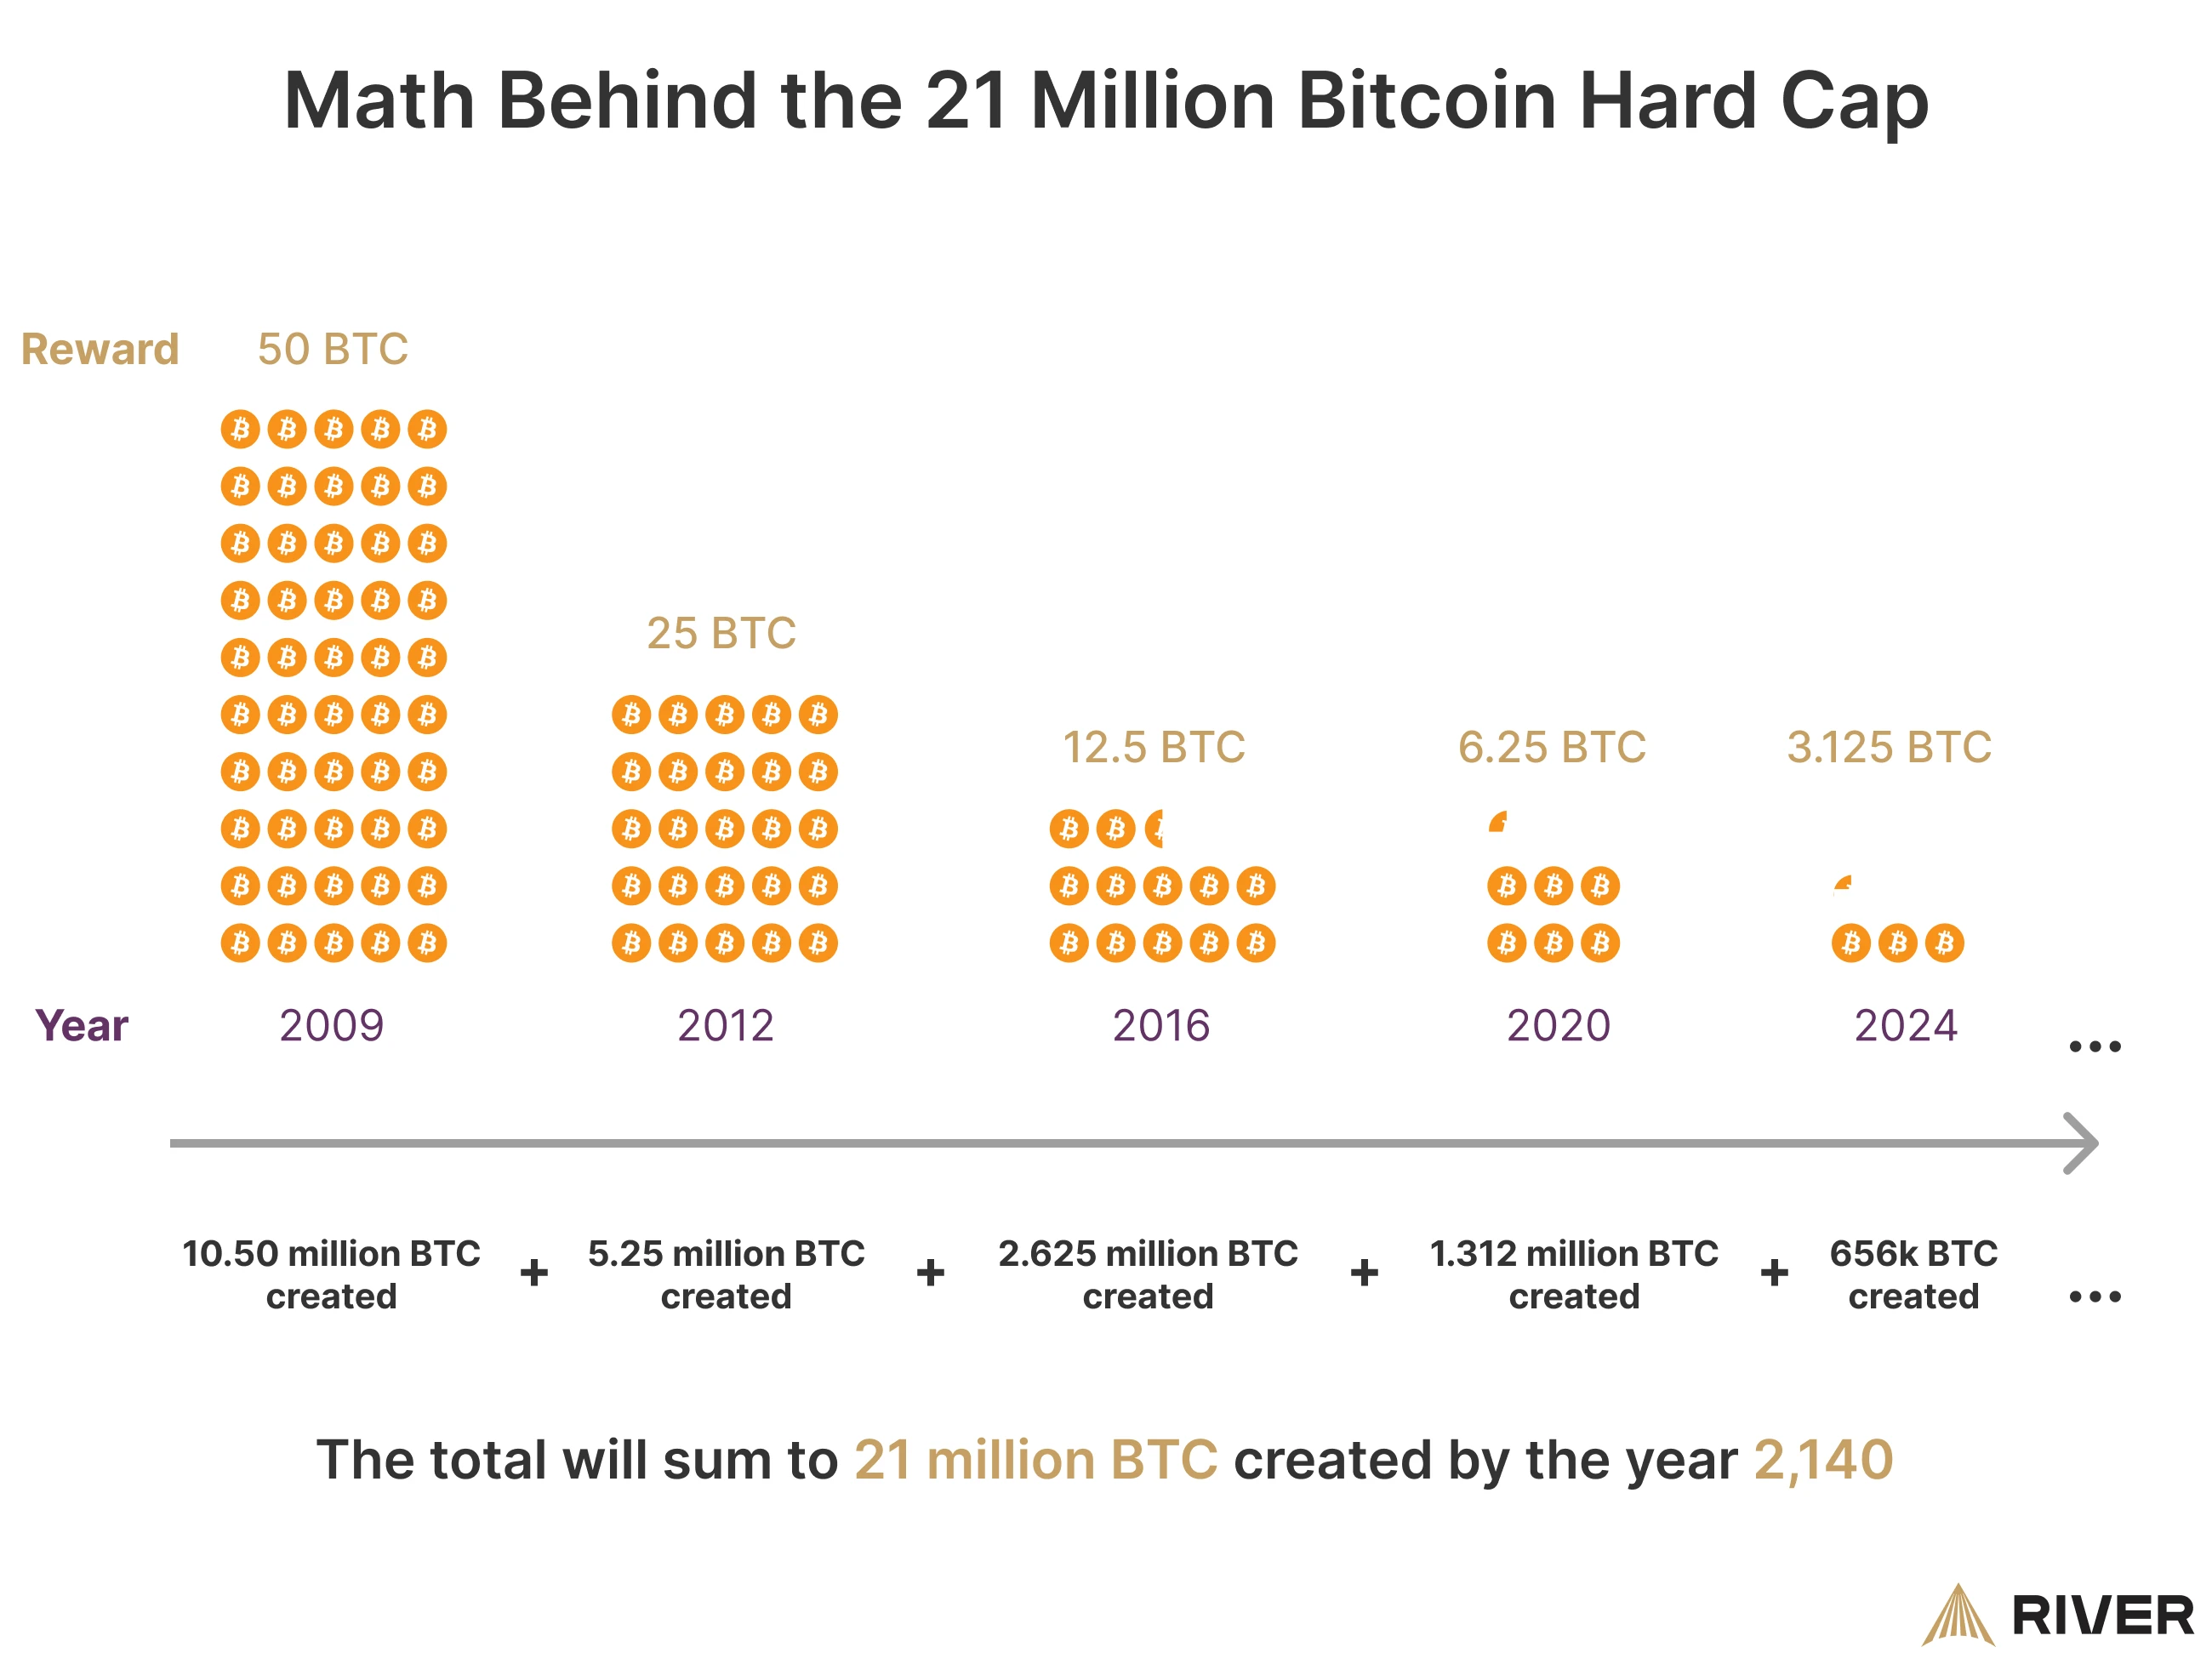
Bitcoin’s supply schedule is encoded in the protocol and requires majority consensus across thousands of globally distributed nodes to modify.
The total supply is capped at 21 million coins.
The April 2024 halving reduced block rewards from 6.25 BTC to 3.125 BTC per block.
The next halving in approximately 2028 will reduce that to 1.5625 BTC.
New supply entering the market becomes arithmetically smaller every four years, with no governing body capable of reversing the schedule.
Bitcoin’s hard cap is set at 21 million BTC. | Source: River Financial
This difference is not cosmetic.
In a world of expanding money supplies and government deficits, the asymmetry between a fixed-supply asset and a dilutable equity is the core of the monetary argument for Bitcoin.
That argument has not changed because IGV dropped 35% from its peak.
Strategy’s Nasdaq Inclusion Created a Feedback Loop, Not a Fundamental Link
The inclusion of Strategy in the Nasdaq 100 in December 2024 is likely to increase the correlation between Bitcoin and QQQ due to MSTR’s significant Bitcoin holdings.
As a proxy for Bitcoin exposure, MSTR’s addition embeds Bitcoin-related volatility into QQQ, particularly during periods of sharp BTC price movements.
This development could strengthen BTC-QQQ correlations during risk-on phases when both equities and Bitcoin rally, as well as during risk-off events when Bitcoin and MSTR experience drawdowns.
Strategy now holds more than 815,000 BTC after a $2.54 billion purchase, passing BlackRock’s iShares Bitcoin Trust to become the world’s largest institutional Bitcoin holder.
What this means mechanically is that a large-cap index tracking software and technology companies now contains a company whose balance sheet is almost entirely Bitcoin.
When passive index funds rebalance, they are buying and selling a software ETF that has embedded Bitcoin exposure.
The correlation this creates between Bitcoin and the Nasdaq is a plumbing artifact of index construction, not evidence that Bitcoin belongs in the same analytical category as Oracle or Salesforce.
When the Narrative Changes, the Correlation Breaks Sharply
The clearest evidence that the Bitcoin-software correlation is regime-dependent rather than structural comes from looking at periods when the dominant investor narrative shifted.
The crypto market, heavily laden with leveraged long positions, experienced a cascade of forced liquidations that sent Bitcoin tumbling while the Nasdaq barely flinched.
This event exposed a fundamental difference: Bitcoin’s decentralized, globally liquid market structure meant it reacted violently to crypto-specific dynamics that had zero impact on traditional equities.
Bitcoin remains down 27% from its October peak while the Nasdaq 100 sits just 2% below record highs, underscoring a sharp divergence that has historically preceded Bitcoin recoveries.
This is now the fourth time in the past five years that the two assets have moved into negative territory on a 20-day correlation coefficient, which currently sits at -0.43.
The pattern also resembles the negative correlation periods seen in summer 2021 and August 2024, both of which coincided with meaningful Bitcoin lows.
The previous negative correlation instance unfolded during the yen carry trade unwind, which pushed Bitcoin down to roughly $49,000, a move that ultimately marked a local bottom.
History shows that when Bitcoin stops behaving like tech, it tends to be at a turning point, not a breakdown.
Silicon Valley Bank Moment Showed What Bitcoin Can Actually Do
In March 2023, Silicon Valley Bank collapsed. The event was a direct banking system stress test involving depositor flight, regulatory failure, and fears of contagion.
During the regional banking crisis triggered by the collapse of Silicon Valley Bank in 2023, Bitcoin and gold exhibited a strong positive correlation, both rising due to safe-haven demand.
In that episode, Bitcoin did not behave like a software stock.
It behaved like a monetary hedge against institutional counterparty risk.
Software stocks had no particular reason to rally when a bank collapsed.
Bitcoin had a specific and coherent reason: it carries no counterparty risk because it settles on-chain without requiring a trusted intermediary.
Institutional ownership has not erased that behavior—it has simply obscured it.
Over Five Years, Bitcoin Has Outperformed IGV on Its Own Terms
Strip away the short-term co-movement and the longer track record is instructive.
Over five years, Bitcoin has gained 18% compared with 10% for IGV. That outperformance cannot be explained by software sector exposure.
If Bitcoin were truly just a high-beta version of IGV, the returns would directionally mirror each other with magnification.
The divergence in compound performance over a multi-year horizon reflects the fact that Bitcoin has its own fundamental drivers operating beneath the surface-level correlation.
BTC vs IGV: High-beta software proxy analysis. | Source: TradingView
Bitcoin’s Software Stock Correlation Is a Structural Mispricing, Not a Fundamental Reality
The data confirms that Bitcoin trades like a software stock.
The correlation is not caused by one asset impacting the movement of the other, but possibly a third variable related to both assets, also known in statistics as a confounding variable.
That third variable is institutional portfolio behavior, liquidity regimes, and the risk management practices of funds that hold both.
The correlation is a consequence of ownership structure, ETF mechanics, index inclusion of Strategy, and the behavioral patterns of institutional risk managers, reducing exposure across correlated books during stress.
When risk appetite contracts, Bitcoin becomes a source of liquidity, not a destination.
None of that changes what Bitcoin is.
It has a fixed supply of 21 million coins and follows a halving schedule that is mathematically enforced and transparent to all market participants.
Unlike traditional assets, it has no management team that can dilute shareholders, no customers who can switch to a cheaper AI-driven alternative, and no cash flow stream that AI disruption can erode.
The market is mispricing Bitcoin because investors are applying an analytical framework designed for a different asset class.
The investors who identified that gap between price behavior and fundamental reality in previous cycles tended to be the ones who acted before the consensus narrative caught up.
Because large funds hold both and adjust exposure based on risk, causing synchronized moves.
Is Bitcoin actually a tech stock?
No. It’s a monetary asset with fixed supply, not a company with revenue or earnings.
What is causing the mispricing?
Institutional flows and portfolio models treating BTC like a high-growth risk asset.
Could Bitcoin decouple from tech stocks?
Yes, especially if macro conditions or narratives shift toward its role as digital gold.
Disclaimer:
The information provided in this article is for informational purposes only. It is not intended to be, nor should it be construed as, financial advice. We do not make any warranties regarding the completeness, reliability, or accuracy of this information. All investments involve risk, and past performance does not guarantee future results. We recommend consulting a financial advisor before making any investment decisions.
Onkar Singh has three years of experience as a digital finance content creator. Throughout his career, he has collaborated with various DeFi projects and crypto media outlets. In his leisure time, he enjoys fitness activities at the gym and watching movies across different genres. Balancing his professional and personal interests, Onkar continues to contribute to the digital finance landscape while pursuing his hobbies.


 Easy
Easy