Bitcoin Traders Divided: Is $71K the Bottom or Is a Deeper Drop Coming?
Share
Key Takeaways
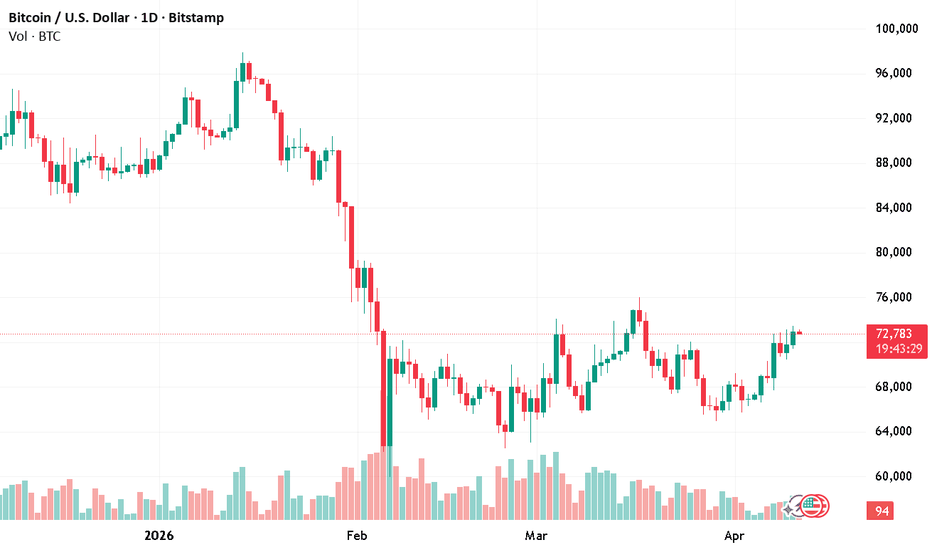
As of April 13, 2026, Bitcoin is trading near $71,800, following numerous tests of the $71,000 level.
Some traders view $71K as a possible bottom, while others caution against a leverage-driven rise prone to further declines.
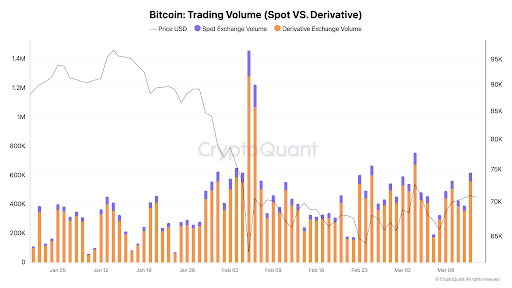
The amount of derivatives trading is around 9x compared to spot trading, resulting in thin liquidity that worsens swings due to macro shocks.
Failed cease-fire talks and threats to blockade the Strait of Hormuz lately caused fast drops below $71K, followed by partial recovery.
After fluctuating between around $70,500 and $73,500 during recent weeks, Bitcoin is currently trading at about $71,800 as of April 13, 2026. What was the cause of this? The answer lies in escalating tensions between the United States and Iran, including failed ceasefire talks in Pakistan and threats to blockade the Strait of Hormuz, spooked risk assets, and temporarily pushed Bitcoin below $71,000 before recovering partially.
Whether a deeper decline is imminent or if $71K represents the bottom is up for debate among traders. This article delves into the recent technical levels, the role of leverage, the impact of geopolitics, and what the data actually reveals, so that you could form your own view on BTC and where it goes next.
Bitcoin / US dollar Trade chart | Credit: TradingView
Why Traders Are Divided on the $71K Level
One camp believes $71K is the lowest low. After a five-month slide from its 2025 peak, Bernstein analysts recently stated that Bitcoin “looks bottomed,” reiterating a long-term objective far above current values. What’s more, with over $1 billion in weekly inflows reported in early April, recent spot Bitcoin ETF inflows, led by funds like IBIT, add credence to this stance.
The opposite team warns about fragility. The latest recovery, according to on-chain and market data, is mostly dependent on leveraged derivatives rather than new spot acquisitions. In recent months, the volume of derivatives has been around 9x that of spot, and in February, combined exchange volumes hit multi-month lows.
Bitcoin will very likely remain in a bear market, despite short-term countertrend rallies.
The hardest part of midterm years is just not believing in every single rally.
Why the split? Bulls are focused on institutional accumulation and ETF flows. Bears point out the weak underlying demand and the prospect that a new shock could set off a chain reaction of liquidations.
Both sides work with the same charts, but reach opposite conclusions.
Spot vs derivatives BTC trading volume | Credit: CryptoQuant
Leverage Factor that Traders Can Miss
This is where the story takes an educational turn. The majority of daily Bitcoin trading currently takes place in futures and options, rather than via direct crypto purchases. Small price swings can compel significant position closures, also known as liquidations, when leverage prevails, thereby accelerating the decline or increase. Although the price movement is still volatile, exchange reserves have dropped to multi-year lows, indicating that holders are removing coins off platforms. This discrepancy can indicate that short-term changes are more influenced by synthetic (paper) exposure than by actual ownership.
What does it mean in easy language? Like a seesaw, a slight push produces large swings. This is the current Bitcoin market. If leverage unwinds fast, a deeper decline below $71K could test $67,000-$68,000, while a clear break above $71K-$74K might relieve pressure and pave the way for higher levels.
Macro Forces at Work and Bitcoin Price Volatility
Geopolitics fuelled the latest flare. Risk assets, including Bitcoin, dropped quickly as US-Iran negotiations dropped, and oil prices soared due to concerns about a blockade. As energy prices increased, inflation data also deteriorated, putting pressure on speculative holdings.
Bitcoin, however, has proven to be resilient. After the initial shock, it recovered its $71K and held close to it even as the news got worse. This behaviour is reminiscent of previous cycles during which external shocks caused temporary anxiety but, after the dust settled, did not disrupt longer-term patterns.
Lower oil prices from any long-term ease would typically promote riskier assets, according to traders observing macro signals. Prolonged blockade threats, on the other hand, could weigh on sentiment and put the $71K floor under additional pressure.
The Supply Wall and the Sell Pressure
The data on the sheer volume of supply entering the order books shows that when BTC approaches $71,500, a supply wall of around $20 million per hour enters the market. It takes effort to break through the ceiling created by this steady stream of sell orders.
Here is where the supply is coming from:
Miner selling: To pay for rising operating expenses, some mining operations may be selling rewards.
Profit taking: At this psychological $71,000 level, investors who invested between $50,000 and $60,000 are likely making gains.
Institutional rebalancing: Scheduled sell-offs may result from large exchange-traded funds (ETFs) and hedge funds rebalancing their portfolios on a quarterly basis.
This $20 million hourly barrier might keep the market steady in the absence of a significant rise in institutional “buy” pressure, eventually wearing out the bulls and triggering a retracement.
What This Means For Bitcoin Traders Moving Forward
One question is at the heart of the $71K controversy: Is the market pricing in sustainable demand or short-term relief? The data suggest a mix of positive ETF flows and low exchange reserves on the one hand, and dominant derivatives volume and headline sensitivity on the other.
Nobody can accurately predict the next step. Markets are probabilistic. Bulls would benefit from a convincing weekly close over $71K, which would lower the possibility of liquidation. Failure to hold $70,000 could lead to lower supports.
The $71K threshold is more than simply a figure; it is a stress test for Bitcoin’s growing market system.
Many traders treat $71K as both psychological support and technical resistance that must be broken for a clear bullish trend.
Why do derivatives matter for BTC?
Derivatives volume currently runs about nine times spot volume, making the market more sensitive to sudden liquidations.
Could Bitcoin decline due to geopolitics?
Yes, prolonged tensions between the United States and Iran or a blockade of Hormuz might raise volatility and test lower supports between $67K and $68K.
What would confirm a sustainable rally?
The bullish case would be strengthened with a weekly closing over $71K, increased spot ETF inflows, and stable on-chain measures.
Disclaimer:
The information provided in this article is for informational purposes only. It is not intended to be, nor should it be construed as, financial advice. We do not make any warranties regarding the completeness, reliability, or accuracy of this information. All investments involve risk, and past performance does not guarantee future results. We recommend consulting a financial advisor before making any investment decisions.
Curious about how technology and crypto reshape global finance, Elizaveta Savenko explores blockchain, AI, decentralized systems, their applications, and regulatory requirements. She contributes to research, educational initiatives, and industry collaborations, examining trends in digital assets and fintech innovation, increasing awareness of the crypto space and its impact on financial systems.


 Intermediate