Bitcoin Down 14% in a Week and 28% So Far This Year — How Much Worse Can It Get?
Share
Key Takeaways
Bitcoin trades near $63,255, down about 28% in 2026 and 49% below its October 2021 record of $124,774, marking the deepest drawdown since the 2022 collapse.
Volatility sits near its 12-month average despite the slide, signaling an orderly repricing rather than panic capitulation, with 20 of the last 30 sessions closing lower.
Key support clusters just below the current price, the 200-week moving average near $61,810, and the 61.8% Fibonacci level near $57,392, while a deeper break points toward the $43,000 zone.
History skews mildly positive into Q3 and Q4 with an RSI near 15 flagging stretched selling, but the last cycle took 846 days to reclaim its peak, so a fast recovery is not the base case.
Bitcoin has spent 2026 handing back the gains that made last year a record run. As of June 8, the price sits near $63,255, down roughly 14% over the past week and about 28% since the start of the year.
That leaves it about 49% below the all-time high of $124,774 set on October 7, 2025.
Anyone who bought the top has watched more than $61,000 drain from every coin. The question echoing across trading desks and group chats is blunt: how much worse can it get?
The data offers a more nuanced answer than the panic suggests.
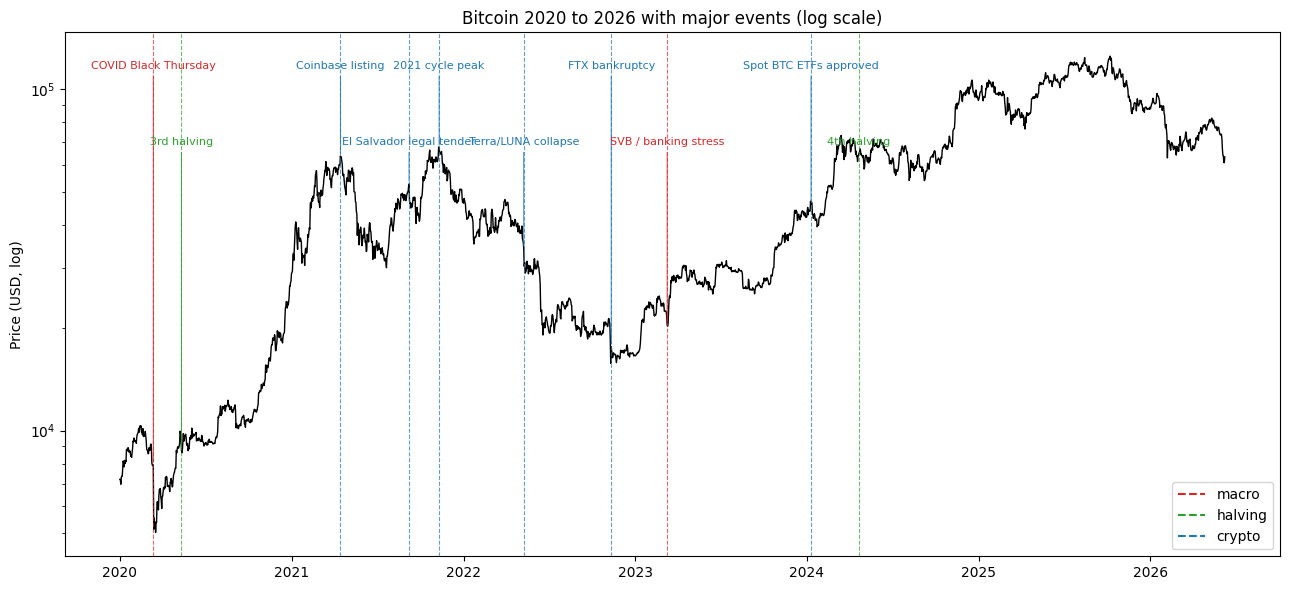
Bitcoin price 2020-2026 with major events, log scale. | Credit: Dr. Guneet Kaur (created via Python)
Bitcoin’s Deepest Drawdown Since 2022 Continues to Unfold
Strip away the noise, and the scale of the move is clear. Bitcoin is down about 14% over the past 7 days, 21% over the past month, and roughly 40% from a year ago.
Measured from the October peak, the drawdown reaches 49.3%, the deepest hole since the 2022 collapse. In dollar terms, the market has erased around $61,519 of value per coin in 244 days.
The recent week ranks among the harsher stretches Bitcoin has seen since 2020, though the worst weekly drops still belong to the March 2020 pandemic crash. This selloff is severe but not historic. What stands out is its steady, grinding nature. This is not a single violent night of liquidations, but a prolonged phase of attrition.
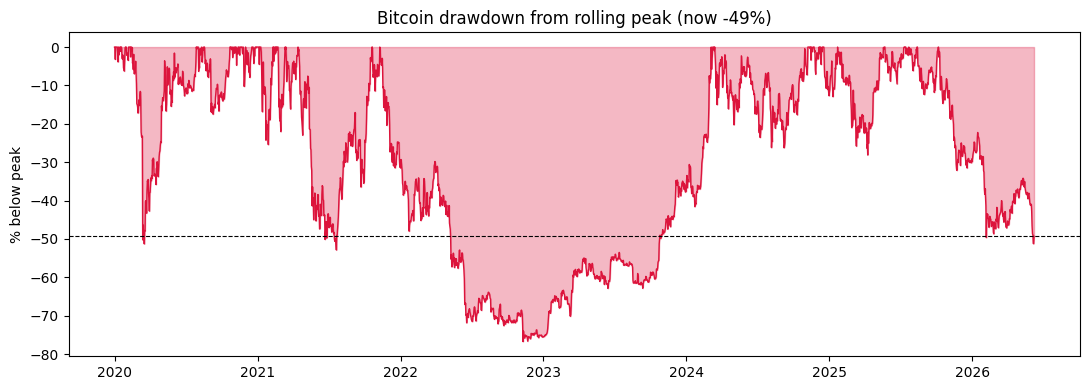
Bitcoin drawdown from rolling peak. | Credit: Dr. Guneet Kaur (created via Python)
Bitcoin Is Falling, but Not Capitulating
Here is the detail most coverage misses.
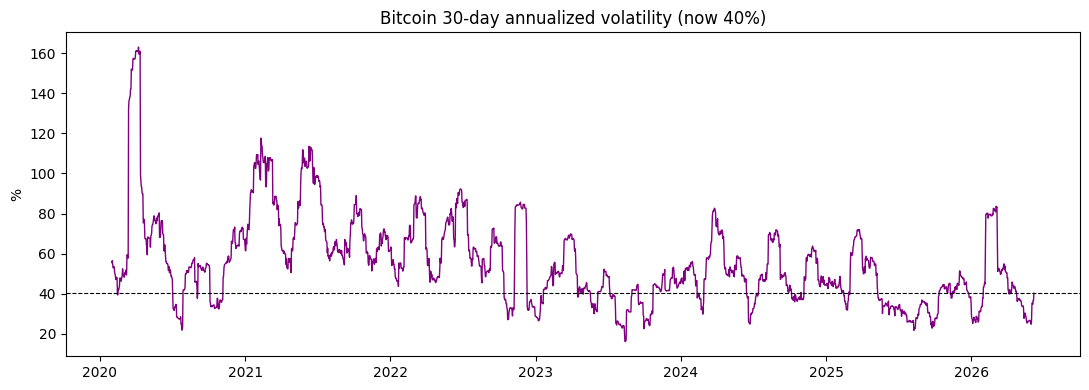
Given the depth of the decline, Bitcoin is remarkably calm. Thirty-day annualized volatility sits near 40%, which is almost exactly its average over the past twelve months.
A near-halving of price, with volatility stuck at the mean, is unusual and suggests the market is repricing rather than capitulating. Twenty of the last 30 sessions closed lower, yet the worst single-day decline was only about 6.6%.
Zoom out, and the calm fits a longer pattern.
Bitcoin volatility has compressed cycle after cycle, from an average above 60% in 2020, with spikes past 160%, to the low 40s across 2025 and 2026. Each bear market arrives quieter than the last.
That maturation is a double-edged story. Smaller drawdowns are easier to stomach, but the explosive upside that defined early Bitcoin is fading with it.
Bitcoin 30-day annualized volatility. | Credit: Dr. Guneet Kaur (created via Python)
Death Cross Persists as Bitcoin Enters Oversold Territory
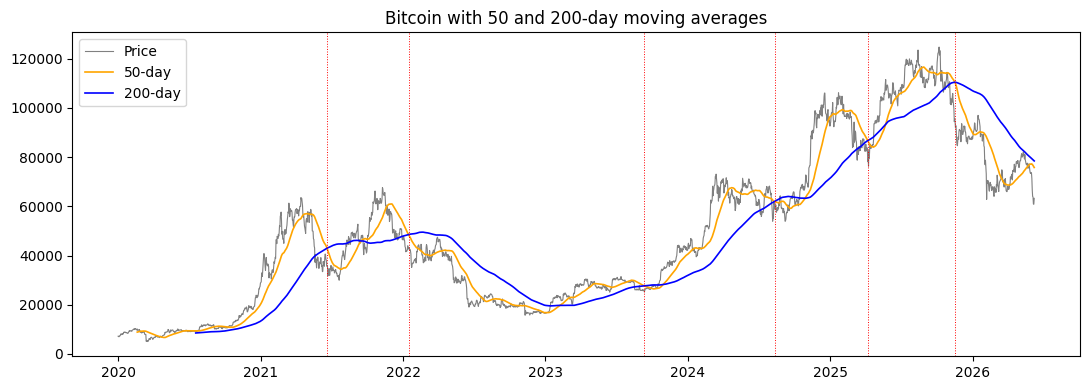
Momentum traders have plenty to point at. Bitcoin has been in a death cross since November 17, 2025, with the 50-day moving average below the 200-day moving average.
Price now trades roughly 17% below its 50-day average and about 19% below its 200-day average, a posture that historically signals weak phases rather than bottoms.
Counterbalancing that, the 14-day Relative Strength Index has plunged to about 15, one of the most oversold readings in the dataset. Levels under 30 flag oversold conditions, and readings under 20 are rare.
Oversold does not mean a bottom is in, but it does mean the selling is stretched and short-term relief bounces become statistically more likely from here.
Bitcoin price with 50 and 200-day moving averages. | Credit: Dr. Guneet Kaur (created via Python)
Key Support Levels and Downside Scenarios for Bitcoin
If buyers want a line in the sand, several converge close to the current price. The 200-week moving average, a level that has marked cycle bottoms before, sits near $61,810, only about 2.3% below where Bitcoin trades today.
Lose that, and the next widely watched support is the 61.8% Fibonacci retracement of the entire 2022 low to 2025 high move, around $57,392, roughly 9% lower. Below that, the 78.6% retracement near $39,075 is in play.
Scenario math frames the tail risk.
A drawdown deepening to 55% from the peak implies about $56,148. Sixty percent points to roughly $49,909. A drop matching the 70% mark lands near $37,432, and a repeat of the 2022 bear, which bottomed 77% below its peak, would imply something close to $28,698.
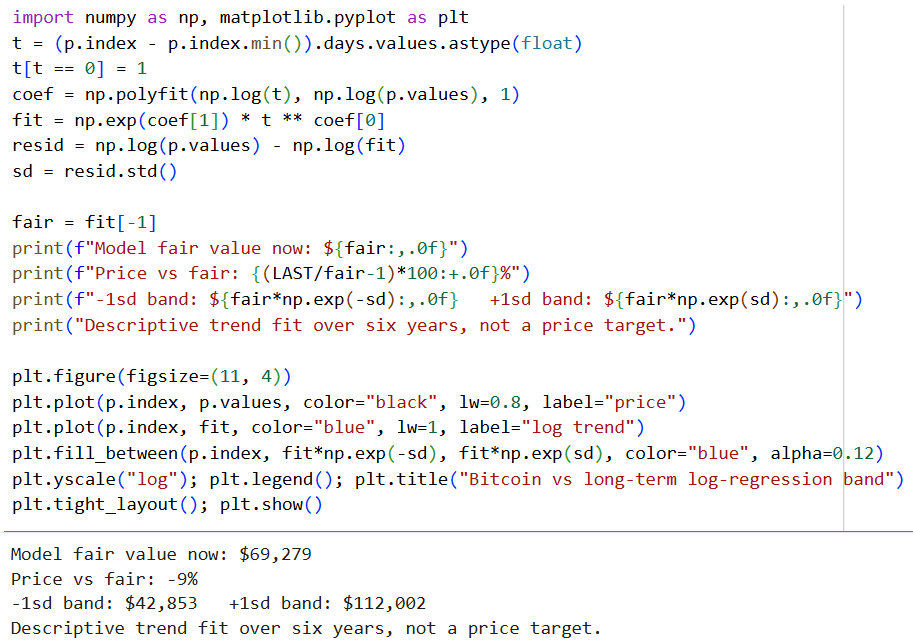
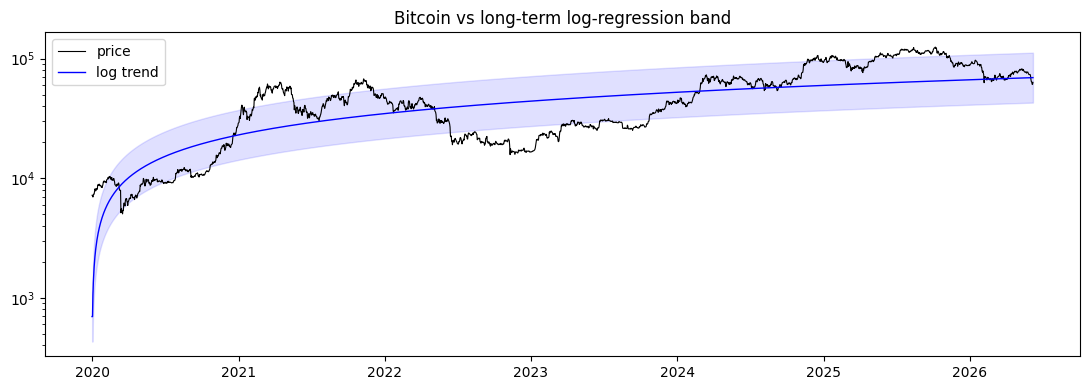
Bitcoin versus its six-year log-regression trend band, with price about 9% below the $69,279 fair value line and bracketed by bands at roughly $42,853 and $112,002. | Credit: Dr. Guneet Kaur (created via Python)
A six-year logarithmic trend model puts a longer-term fair value near $70,000 and a lower band around $43,000, which brackets the realistic range without pretending to predict it.
Bitcoin support levels and log-regression fair value band. | Credit: Dr. Guneet Kaur (created via Python)
How Today’s Selloff Compares With the 2022 Collapse
Comparing the current decline day for day against the 2021 to 2022 collapse is reassuring, at least relative to that nightmare. At every checkpoint, this selloff is shallower.
Two hundred and forty-four days after its peak, Bitcoin is down 49% today, versus down 70% at the same stage in 2022. The last great bear eventually bottomed 77% below its high, at $15,742, after 366 brutal days.
Recovery timelines are the sobering part. The November 2021 peak took 846 days, nearly two and a half years, before Bitcoin reclaimed it. Holders hoping for a quick return to $124,774 should weigh that history carefully.
Current selloff versus 2021-22 drawdown path. | Credit: Dr. Guneet Kaur (created via Python)
Seasonality and Conditional History Point to a Mixed Outlook
Calendar patterns add a near-term headwind. Since 2020, June has produced a median monthly return of about negative 5%, and August around negative 7%, making summer the softest stretch of the Bitcoin year.
October, by contrast, has been the strongest, with a median near 18%, which suggests the back half of the year tends to treat holders better than the middle.
Conditional history offers a two-sided read. On days when Bitcoin traded below its 200-day average, as it does now, the median return over the following 90 days was around positive 5%, with outcomes ranging from roughly negative 59% to positive 107%.
The central tendency leans mildly positive, but the tails are violent. That is the honest answer to the headline. Near term, the odds favor a bounce; the deeper structural floor likely sits between $57,000 and $43,000, and a full 2022-style washout, while not the base case, cannot be ruled out.
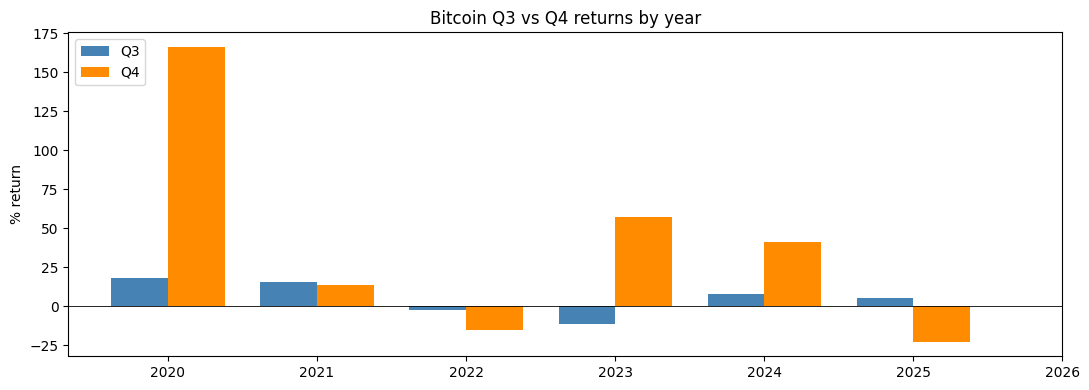
Outlook for Q3 and Q4
History gives the back half of the year a mild tailwind, but with wide error bars. Since 2020, Bitcoin’s third quarter has posted a median gain near 7%, ranging from a 12% loss in 2023 to an 18% gain in 2020. Applied to the current price, that frames a plausible Q3 band of roughly $55,900 on the weak end to about $74,600 on the strong end, with a midpoint near $67,500.
Notice how cleanly those edges map onto the chart levels already in play. The bear case lands right on the 200-week moving average and the 61.8% Fibonacci support near $57,000, while the bull case stalls into the 50-day moving average resistance around $75,800.
Fourth-quarter history looks far more bullish on paper, with a median return above 27%, but that figure masks enormous volatility.
October has historically been Bitcoin’s best month, and 2020 delivered a 166% quarter that boosted the average. Yet the most recent data point cuts the other way.
Bitcoin outlook for Q3 and Q4. | Credit: Dr. Guneet Kaur (created via Python)
Q4 of 2025 fell about 23%, the very decline that opened this bear market, proving the seasonal pattern is a tendency and not a rule. If the median seasonal path repeated from here, Bitcoin would end Q3 near $67,500 and the year somewhere around $85,900, still well below the October record.
The honest read is a skew, not a forecast. Near-term momentum is oversold, and seasonality leans positive into autumn, which supports a recovery attempt from the $57,000 to $62,000 support zone.
A clean break below that band shifts focus toward the $43,000 region flagged by the long-term trend model. Both paths remain in play, the sample size is only six years deep, and none of this is investment advice.
Methodology
This analysis draws on daily Bitcoin closing prices in US dollars pulled from the CoinGecko Pro API, specifically the coins market chart range endpoint, covering January 1, 2020 through June 8, 2026, totaling roughly 2,351 daily observations. Returns are simple percentage changes between closes. Drawdown is measured against the running maximum price. Annualized volatility is the 30-day standard deviation of daily returns scaled by the square root of 365. Moving averages use 50-, 200-, and 1,400-day (200-week) simple moving averages.
The Relative Strength Index uses the standard 14-day calculation. Fibonacci levels are drawn from the 2022 cycle low to the 2025 all-time high. The fair value band is derived from a log-log regression of price over time, shown with a one-standard-deviation envelope.
Several limits apply. The dataset is price-only, so it cannot speak to trading volume, onchain flows, or exchange reserves. Base rates rest on roughly two completed market cycles, which is a small sample, so they describe history rather than forecast it. Technical levels such as Fibonacci retracements and moving averages are widely watched and partly self-fulfilling, not predictive. None of the above is investment advice.
As of June 8, Bitcoin trades near $63,255, down about 28% year to date and roughly 49% below its all time high of $124,774 set on October 7, 2025. That works out to more than $61,000 erased from every coin in 244 days, the deepest drawdown since the 2022 bear market.
What are the key support levels for Bitcoin right now?
The first major support is the 200 week moving average near $61,810, just below current price and a level that has marked cycle bottoms before. Beneath that sits the 61.8% Fibonacci retracement around $57,392, and a deeper break opens the way toward the $43,000 region flagged by the long term trend model.
Is Bitcoin going to recover in Q3 and Q4 of 2026?
History leans mildly positive, with a median Q3 gain near 7% and a Q4 median above 27% since 2020, while an RSI near 15 signals the selling is stretched. That said, the variance is enormous, Q4 of 2025 actually fell 23%, and the last cycle took 846 days to reclaim its peak, so a fast recovery is far from guaranteed.
How does this selloff compare with the 2022 crash?
This decline is shallower at every stage. At 244 days past the peak, Bitcoin is down 49% today versus 70% at the same point in 2022, a bear that eventually bottomed 77% below its high at $15,742. Volatility is also far calmer this time, sitting near its twelve month average rather than spiking.
Disclaimer:
The information provided in this article is for informational purposes only. It is not intended to be, nor should it be construed as, financial advice. We do not make any warranties regarding the completeness, reliability, or accuracy of this information. All investments involve risk, and past performance does not guarantee future results. We recommend consulting a financial advisor before making any investment decisions.
Dr. Guneet Kaur is a senior editor at CCN.com and a Science Fellow at Exponential Science. She is a fintech and blockchain expert with extensive experience in digital finance education, blockchain ecosystems, and cryptocurrency markets. She has worked with global media such as Cointelegraph, as well as education and blockchain platforms, to design and lead strategic content and learning initiatives. As an educator and assessor for top-tier executive programs, she bridges real-world fintech trends with academic insight.
Dr. Kaur is also a published researcher and peer reviewer across fintech and data science journals, including Financial Innovation Journal and International Journal of Big Data Intelligence and Applications. Her work spans data-driven analysis, Web3 innovation, and technical content development. With a strong foundation in both industry and academia, she translates complex financial technologies into practical applications, empowering learners, professionals, and institutions across the rapidly evolving digital finance landscape.


 Easy
Easy 
![current selloff versus 2021-22 drawdown path]](https://www.ccn.com/wp-content/uploads/2026/06/current-selloff-versus-2021-22-drawdown-path.png)