Bitcoin climbed back above $60,000 as Strategy and Strive surged over 10%, fueled by easing Fed concerns despite ongoing ETF outflows. | Credit: CCN.com
Share
Key Takeaways
Bitcoin briefly broke below the 200-week SMA at $61,800, a level linked to past forced selling, while the ongoing death cross has now lasted 204 days.
Fidelity data shows the MVRV Z-Score moving toward undervalued territory as price nears the realized cost basis around $53,600, though it has not yet hit prior cycle-bottom levels.
Despite Extreme Fear sentiment, Bitcoin has not broken February lows, with short-term signals bearish but longer-term valuation metrics beginning to improve.
Bitcoin is sitting at one of its most technically precarious positions since 2022, and Fidelity Digital Assets is now saying the quiet part out loud.
The world’s third-largest asset manager published three charts on June 7 using Glassnode data that together tell a story the market has been nervously constructing for weeks.
Bitcoin briefly broke below the 200-week simple moving average at approximately $61,800 on June 5 and 6.
The death cross, where the 50-day SMA crosses below the 200-day SMA, has now been in place for 204 consecutive days. And the MVRV Z-Score is sliding toward the green undervalued zone that has historically marked cycle bottoms.
Each data point, taken in isolation, is concerning. Together they form a pattern that demands attention.
What the Fidelity Charts Show
The Bitcoin Indicators chart makes the death cross duration the standout signal. Previous death cross episodes in 2018, 2022, and the brief 2020 episode each resolved with significant further downside before a recovery took hold.
The current 204-day reading exceeds the duration seen before some of Bitcoin’s sharpest capitulation phases.
Bitcoin has been in a death cross for 204 days. | Source: @DigitalAssets
The 50-day SMA declining below the 200-day SMA on the three-day chart, as analyst Ali Martinez flagged in February 2026, has historically preceded the final leg down of each bear cycle, with additional declines of 46% to 52% following the signal in 2014, 2017, and 2022.
Since 2014, the death cross between the 50 and 200 simple moving averages on the 3-day chart has consistently preceded the final leg down of a Bitcoin $BTC bear market. https://t.co/9vGw5OdDVYpic.twitter.com/lSM8BRrxSw
The MVRV Z-Score chart adds a more constructive long-term signal. The score is falling toward historically undervalued territory as Bitcoin’s market price approaches its realized price of approximately $53,600, the aggregate price at which the entire network last moved coins. That level represents genuine cost-basis support.
Fidelity notes the MVRV has now fallen below February’s low, possibly signaling deeper positioning resets beneath the surface.
MVRV is moving toward historically undervalued territory as price approaches realized price. | Source: @DigitalAssets
The Fear and Greed Index chart delivers the most interesting tension of the three. Sentiment has re-entered Extreme Fear, matching the readings seen during Bitcoin’s worst weeks of the current cycle.
But Bitcoin’s price has not yet broken February’s lows. This divergence between sentiment and price is either a bottoming signal or a warning that price has not yet caught up to where fear already is.
Sentiment is currently weak, but valuation is more compressed. | Source: @DigitalAssets
Fidelity’s summary: short-term signals lean bearish, longer-term indicators are starting to shift. For investors trying to time the next move, that split verdict is the most honest assessment the data currently supports.
ChatGPT Offers More Measured Take on Fidelity’s Bearish Bitcoin Charts
Not everyone reads the same data the same way. When the three Fidelity charts were put to ChatGPT for an independent assessment, the response was notably more measured than the bearish framing the charts have generated on social media.
Fidelity’s Bearish Bitcoin charts get a reality check from ChatGPT.
On the 200-week SMA break, ChatGPT’s verdict was clear: meaningful warning sign, but not confirmation of a macro regime change. A brief dip below the level is not the same as a sustained break, and mid-cycle corrections have produced short-lived deviations from that line before without triggering collapse.
On the death cross, ChatGPT pushed back on the framing more directly. A death cross is a lagging indicator that frequently occurs after the major downside has already happened. The 204-day duration reflects sideways consolidation after a decline rather than being a reliable predictor of what comes next. Death crosses have historically persisted well into recovery phases without signaling further breakdown.
On the MVRV Z-Score, ChatGPT agreed this is the strongest constructive signal in the dataset, but flagged the critical nuance the bullish interpretation glosses over: approaching undervalued territory is not the same as being there, and Bitcoin can remain cheap on this metric for extended periods in entrenched downtrends before any price recovery materializes.
The Fear and Greed divergence drew the most balanced response. Extreme Fear while price holds above prior lows has historically resolved both ways, as a bottoming process where sentiment leads price lower before a reversal, and as a lagging breakdown where price eventually catches up to where fear already was.
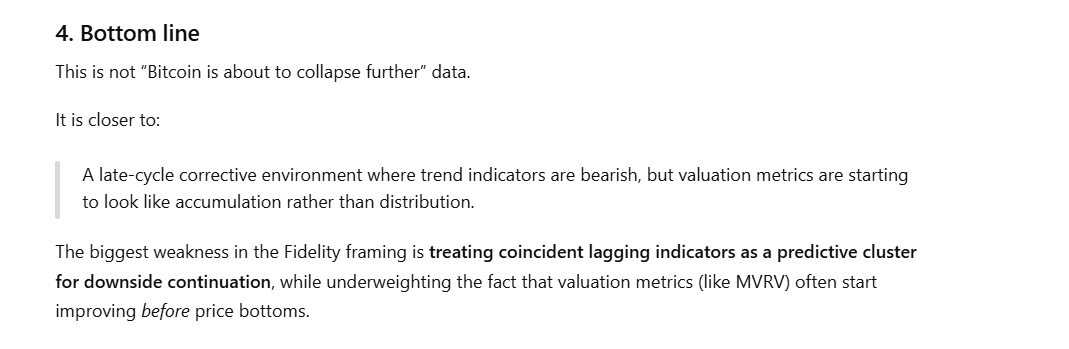
ChatGPT’s overall read stripped of narrative: the indicators collectively describe a late-stage corrective or transitional phase, not an imminent major crash. Trend structure is weak, and momentum is bearish in the short term, but valuation metrics are moving toward accumulation territory rather than distribution.
The biggest analytical risk in the Fidelity framing, according to ChatGPT, is treating coincident lagging indicators as a predictive signal of further downside while underweighting the fact that metrics like MVRV typically start improving before price bottoms.
What Bitcoin Investors Should Watch
The realized price near $53,600 is the line that matters most. A sustained break below it would shift the MVRV into genuine capitulation territory for the first time this cycle. The June 10 CPI print and June 17 FOMC dot plot are the two macro triggers closest on the calendar.
A second consecutive hot inflation reading removes the remaining odds of a 2026 rate cut and tests every support level simultaneously. Strategy’s preferred dividend obligations and a potential Bank of Japan rate hike to 1% add two more pressure points that technical charts alone cannot price.
Disclaimer:
The information provided in this article is for informational purposes only. It is not intended to be, nor should it be construed as, financial advice. We do not make any warranties regarding the completeness, reliability, or accuracy of this information. All investments involve risk, and past performance does not guarantee future results. We recommend consulting a financial advisor before making any investment decisions.
Dr. Guneet Kaur is a senior editor at CCN.com and a Science Fellow at Exponential Science. She is a fintech and blockchain expert with extensive experience in digital finance education, blockchain ecosystems, and cryptocurrency markets. She has worked with global media such as Cointelegraph, as well as education and blockchain platforms, to design and lead strategic content and learning initiatives. As an educator and assessor for top-tier executive programs, she bridges real-world fintech trends with academic insight.
Dr. Kaur is also a published researcher and peer reviewer across fintech and data science journals, including Financial Innovation Journal and International Journal of Big Data Intelligence and Applications. Her work spans data-driven analysis, Web3 innovation, and technical content development. With a strong foundation in both industry and academia, she translates complex financial technologies into practical applications, empowering learners, professionals, and institutions across the rapidly evolving digital finance landscape.