Bitcoin Price Chaos Ahead? ChatGPT and Claude Predict Wild Swing Scenarios
Share
Key Takeaways
With Bitcoin down 51% from its October 2025 peak and trading near $62,000, AI models identify June CPI and the June FOMC meeting as key catalysts for the next major move.
ChatGPT sees a volatile upward trend as the most likely outcome, followed by a correction-and-recovery scenario, while assigning a smaller chance to a breakout rally.
Arkham Intelligence data shows a Bitcoin whale who shorted $100 million in BTC at an average of $69,420 has just broken even after holding through an $18 million unrealized loss.
Bitcoin price is trading near $63,000 (at the time of writing) with the Fear and Greed Index pinned at 15, a level that historically marks either capitulation or the beginning of one. Spot ETF outflows have topped $1.7 billion in a single week.
Strategy broke its four-year no-sell streak with a 32 BTC disposal earlier this month, only to follow it on June 8 with a 1,550 BTC purchase for $101 million, bringing its total reserve to 845,256 BTC and restoring its USD cash reserve to $1 billion.
Strategy has acquired 1,550 BTC for $101 million to increase our $BTC Reserve to ₿845,256. We have also increased our USD Reserve by $100 million to $1.0 billion. $MSTR$STRChttps://t.co/1Zf1AVsP1H
The whiplash is a near-perfect summary of where the market stands: bearish signals colliding with institutional accumulation in the same week, on the same balance sheet. The macro calendar is about to get loud.
CCN asked two AI models to map what comes next. Their answers are worth reading together.
ChatGPT Assigns 60% Odds to a Bullish Bitcoin Market Despite Volatility
ChatGPT structured its outlook across four scenarios. Its base case, assigned a 60% probability, is a volatile but upward-trending market driven by continued ETF inflows, eventual rate cuts, and expanding corporate treasury adoption.
A deep correction before recovery came in at 25%, triggered by sticky inflation, regulatory shocks, or recession fears pushing Bitcoin back into the $60,000 to $90,000 support zone, depending on where any decline begins.
The remaining 10% went to an explosive bull run far above the current consensus, and a residual 5% to black swan events in either direction, including a sovereign nation formally adding Bitcoin to reserves or a severe market structure failure destroying liquidity.
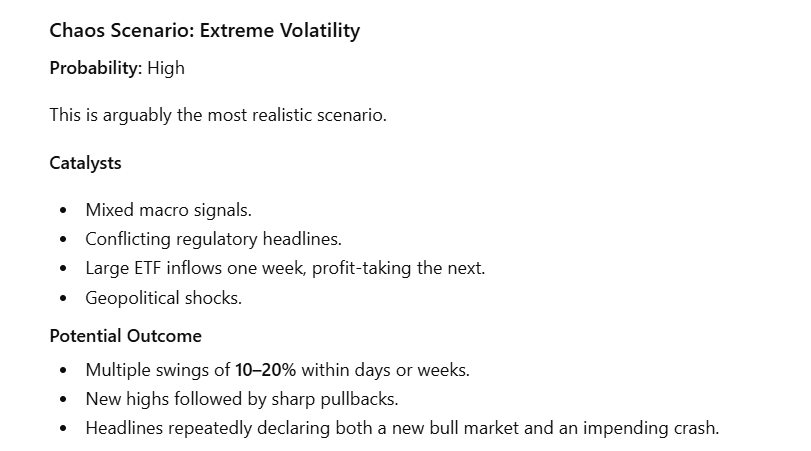
ChatGPT’s single most likely scenario was what it called the chaos case: multiple swings of 10% to 20% within days or weeks, headlines alternating between new bull-market declarations and crash warnings, and no clear directional trend for months.
“The most likely outcome isn’t a straight-line rally or a devastating crash,” it concluded. “It’s turbulence. Bitcoin’s next chapter could be defined by violent swings as institutional adoption collides with macroeconomic uncertainty.”
Bitcoin Could Rally to $75,000 or Fall to $55,000, Says Claude
Claude’s framework was more macro-specific. With roughly $1.1 billion in longs liquidated after Bitcoin broke below $64,000 and April CPI already printing at 3.8%, it identified May CPI on June 10 and the FOMC dot plot on June 17 as the critical decision points and built three conditional scenarios around them.
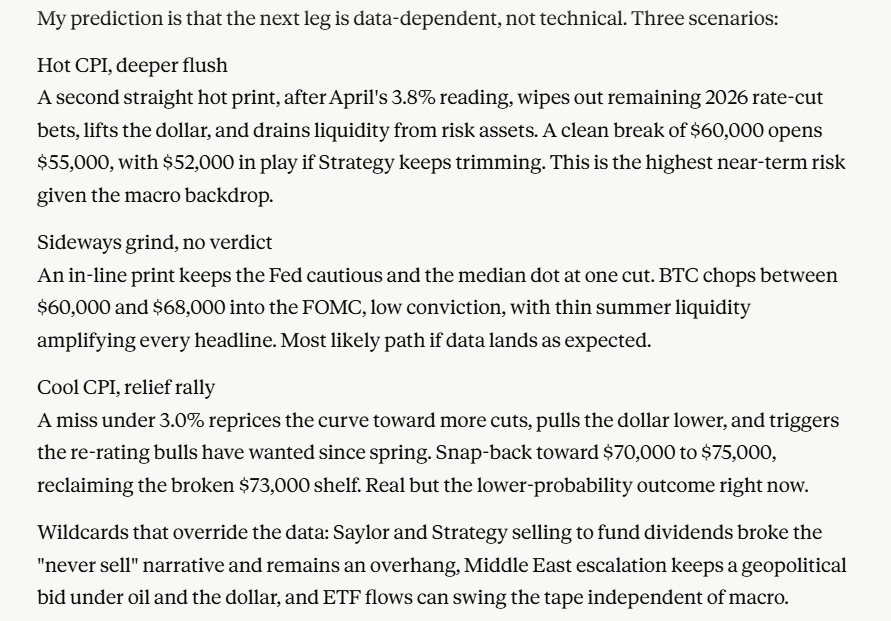
A second consecutive hot CPI print would wipe out remaining 2026 rate cut expectations, strengthen the dollar, and drain liquidity from risk assets. A clean break below $60,000 would open $55,000, with $52,000 in play if Strategy continues trimming Bitcoin to fund preferred dividends. Claude rated this the highest near-term risk.
Data points that could decide Bitcoin’s next move. | Source: Claude
An in-line print keeps the Fed cautious, with the median dot pointing to one cut. Bitcoin grinds sideways between $60,000 and $68,000 through the FOMC meeting, with thin summer liquidity amplifying every headline. Claude rated this the most likely path if the data lands as expected.
A cool reading below 3.0% would reprice the rate curve toward more cuts, push the dollar lower, and trigger the relief rally bulls have been waiting for since spring, with a snap-back toward $70,000 to $75,000. Claude rated this real, but the lowest-probability outcome right now.
According to Claude, three wildcards could override the data entirely: Strategy’s broken no-sell narrative remaining a persistent overhang, Middle East escalation keeping a geopolitical bid under oil and the dollar, and ETF flows capable of swinging the tape independent of any macro signal.
What Arkham’s Data and Research Show
Onchain intelligence platform Arkham published a timely guide on June 2, breaking down exactly what happens when Bitcoin crashes and why current conditions fit the historical pattern closely.
Arkham’s research identifies leverage accumulation as one of the primary crash catalysts, noting that even a small price drop can trigger a liquidation cascade where forced margin calls push prices lower in a self-reinforcing spiral. That mechanism was visible on January 29, 2026, when a disappointing tech earnings session triggered a small BTC decline that cascaded into billions in liquidations across the market.
Arkham also flags macroeconomic liquidity withdrawal as a compounding factor, pointing to 2022 when aggressive Fed rate hikes caused Bitcoin to lose over 60% of its value as capital fled risk assets. With May CPI due June 10 and the FOMC dot plot on June 17, that same dynamic is live again.
Onchain, Arkham data shows a Bitcoin whale who shorted $100 million in BTC at an average price of $69,420 has just broken even after absorbing an $18 million unrealized loss when Bitcoin briefly rallied to $82,833 in early May, a signal that institutional short conviction remains intact rather than having been stopped out by the relief rally.
What Bitcoin’s Next Move Depends on Before June 17
Three different methodologies, one shared conclusion: the next few weeks are binary, and the data calendar between now and June 17 holds the answer.
ChatGPT sees turbulence as the base case regardless of the macro outcome. Claude sees the macro outcome as the tape. Arkham’s onchain data shows at least one large institutional player positioned for lower prices and holding that view with real conviction.
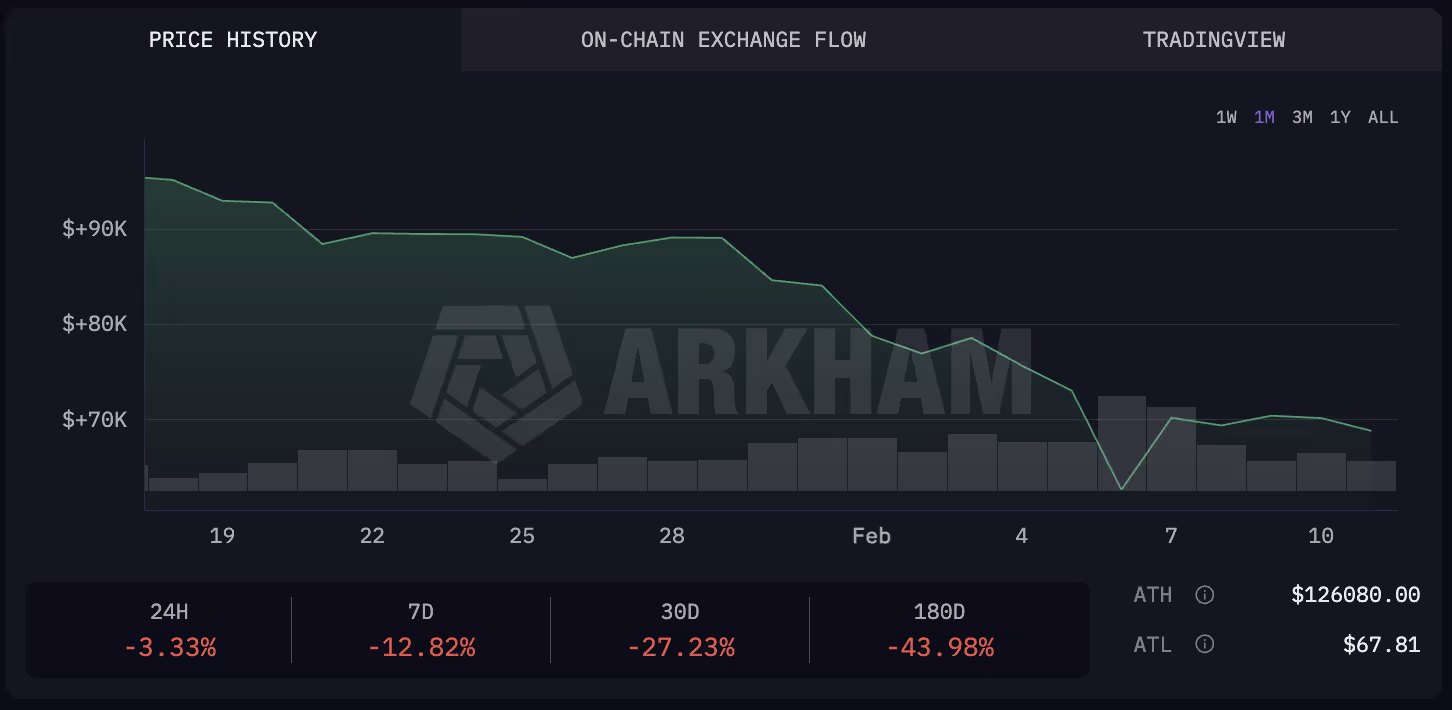
BTC price drop in October 2025 triggered a cascade. | Source: Arkham Intelligence
Whether the current drawdown is the setup for the next leg or the beginning of a deeper unwind is precisely the question that $62,000 Bitcoin, extreme fear sentiment, and a crowded short book cannot yet answer.
Disclaimer:
The information provided in this article is for informational purposes only. It is not intended to be, nor should it be construed as, financial advice. We do not make any warranties regarding the completeness, reliability, or accuracy of this information. All investments involve risk, and past performance does not guarantee future results. We recommend consulting a financial advisor before making any investment decisions.
Dr. Guneet Kaur is a senior editor at CCN.com and a Science Fellow at Exponential Science. She is a fintech and blockchain expert with extensive experience in digital finance education, blockchain ecosystems, and cryptocurrency markets. She has worked with global media such as Cointelegraph, as well as education and blockchain platforms, to design and lead strategic content and learning initiatives. As an educator and assessor for top-tier executive programs, she bridges real-world fintech trends with academic insight.
Dr. Kaur is also a published researcher and peer reviewer across fintech and data science journals, including Financial Innovation Journal and International Journal of Big Data Intelligence and Applications. Her work spans data-driven analysis, Web3 innovation, and technical content development. With a strong foundation in both industry and academia, she translates complex financial technologies into practical applications, empowering learners, professionals, and institutions across the rapidly evolving digital finance landscape.