Home / Analysis / Crypto / Technical Analysis / Bitcoin (BTC) Jumps Past $70k as Trump-Iran Ceasefire Sparks Relief Rally — but Some Traders Aren’t Buying It
Bitcoin climbed above $72K after the ceasefire news, supported by bullish technical indicators.
U.S. investors remain cautious, with the Coinbase Premium Index staying negative.
Derivatives and options data show rising bearish sentiment, hinting at further declines.
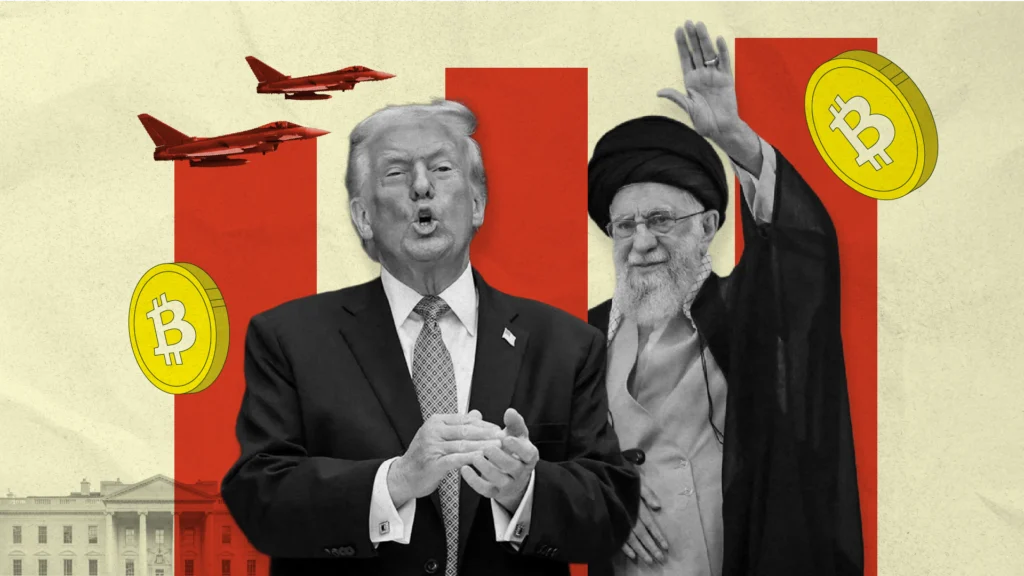
Bitcoin surged past $70,000 on Tuesday after President Donald Trump announced a two-week ceasefire with Iran.
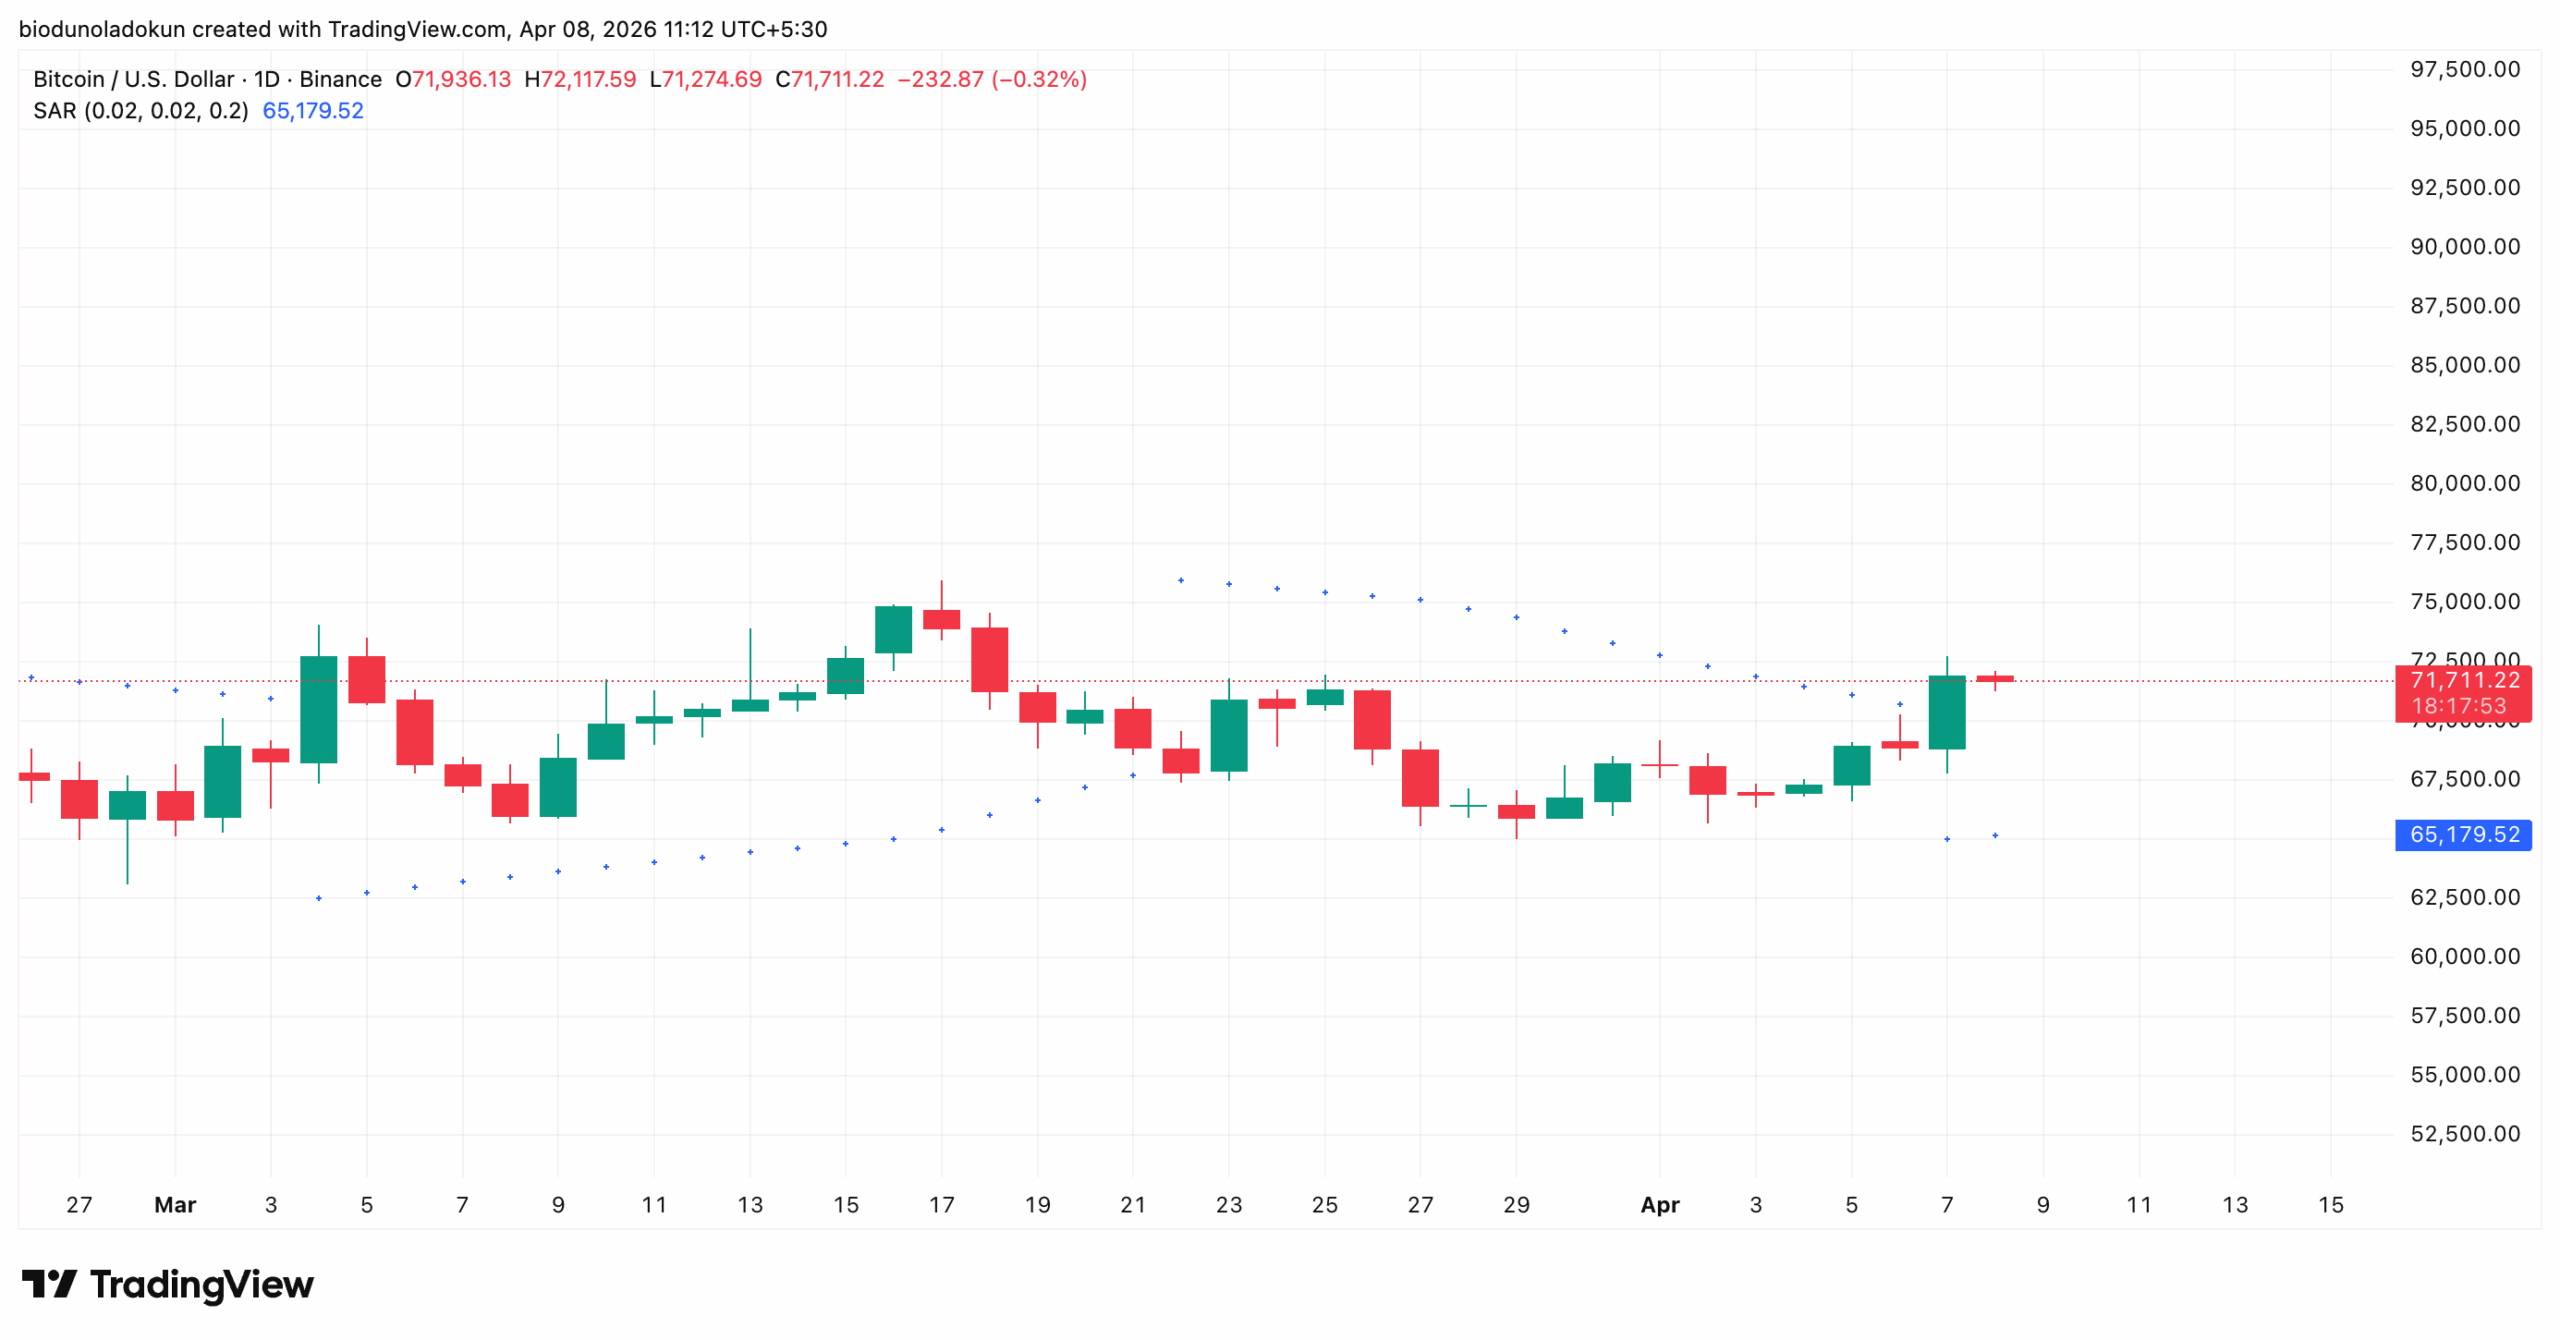
The move pushed the king coin to an intraday high of $72,738 before it settled slightly below that level into the daily close of $71,944.
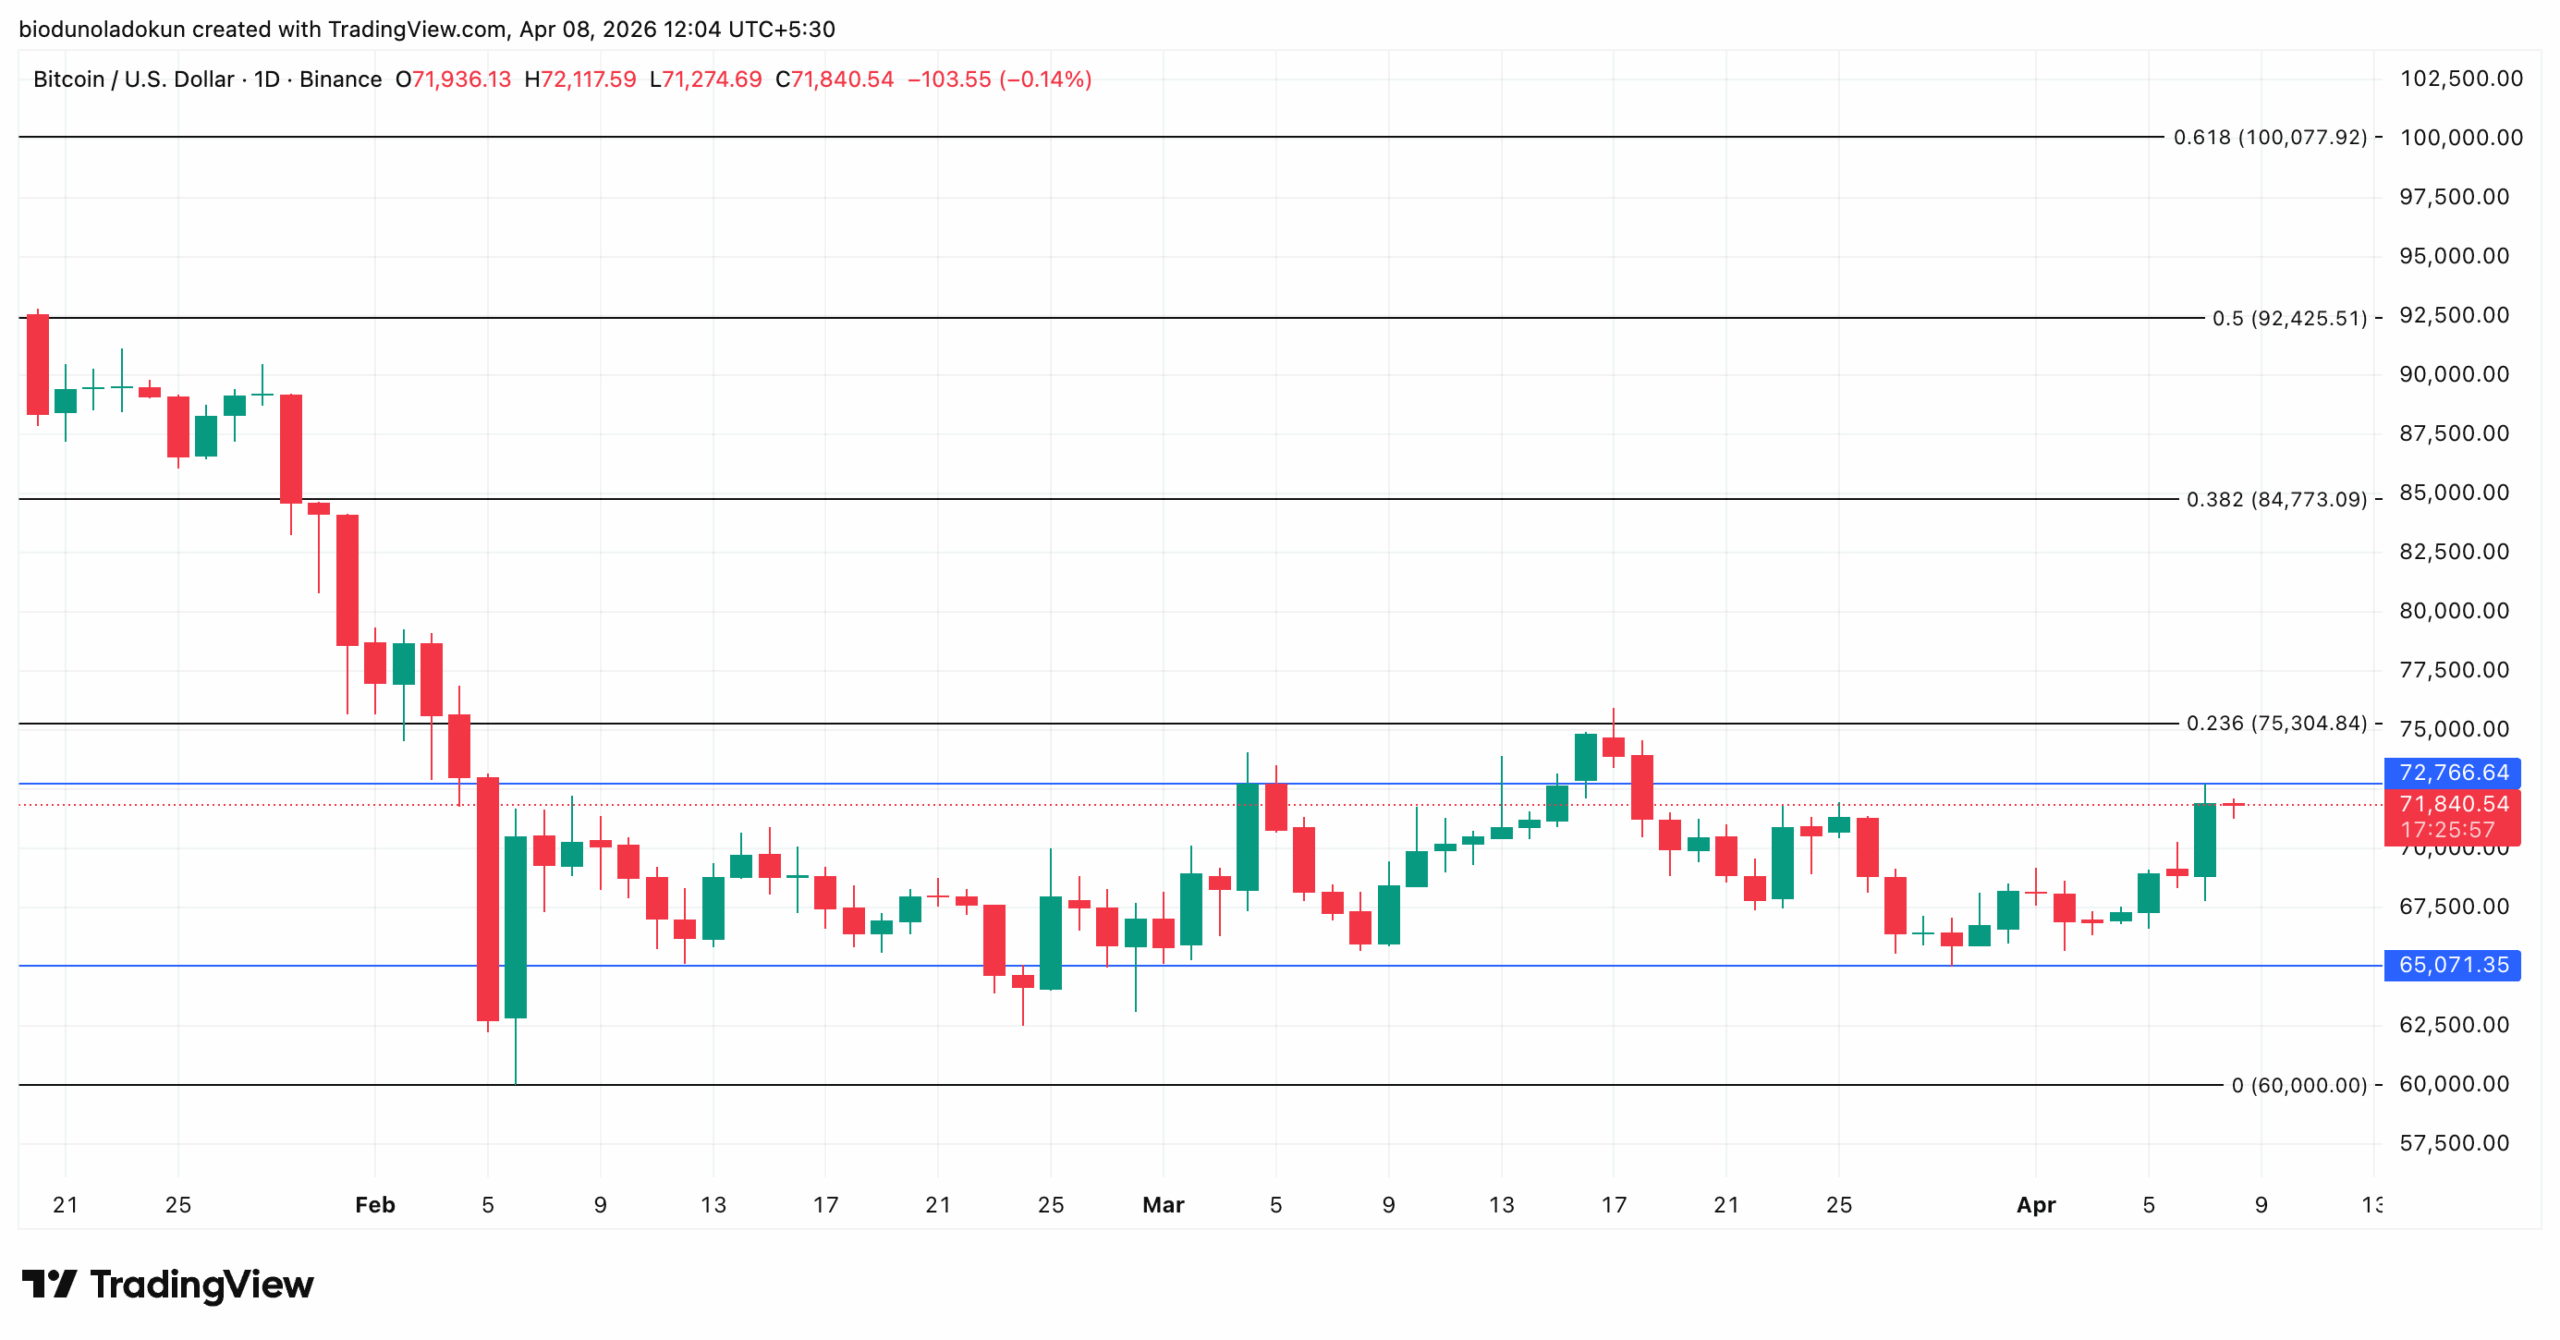
At press time, the coin is up 4% over the past 24 hours and is attempting to break above $72,766, a long-term resistance level that has repeatedly capped upside momentum.
Rally Gains Steam After Geopolitical Tensions Ease
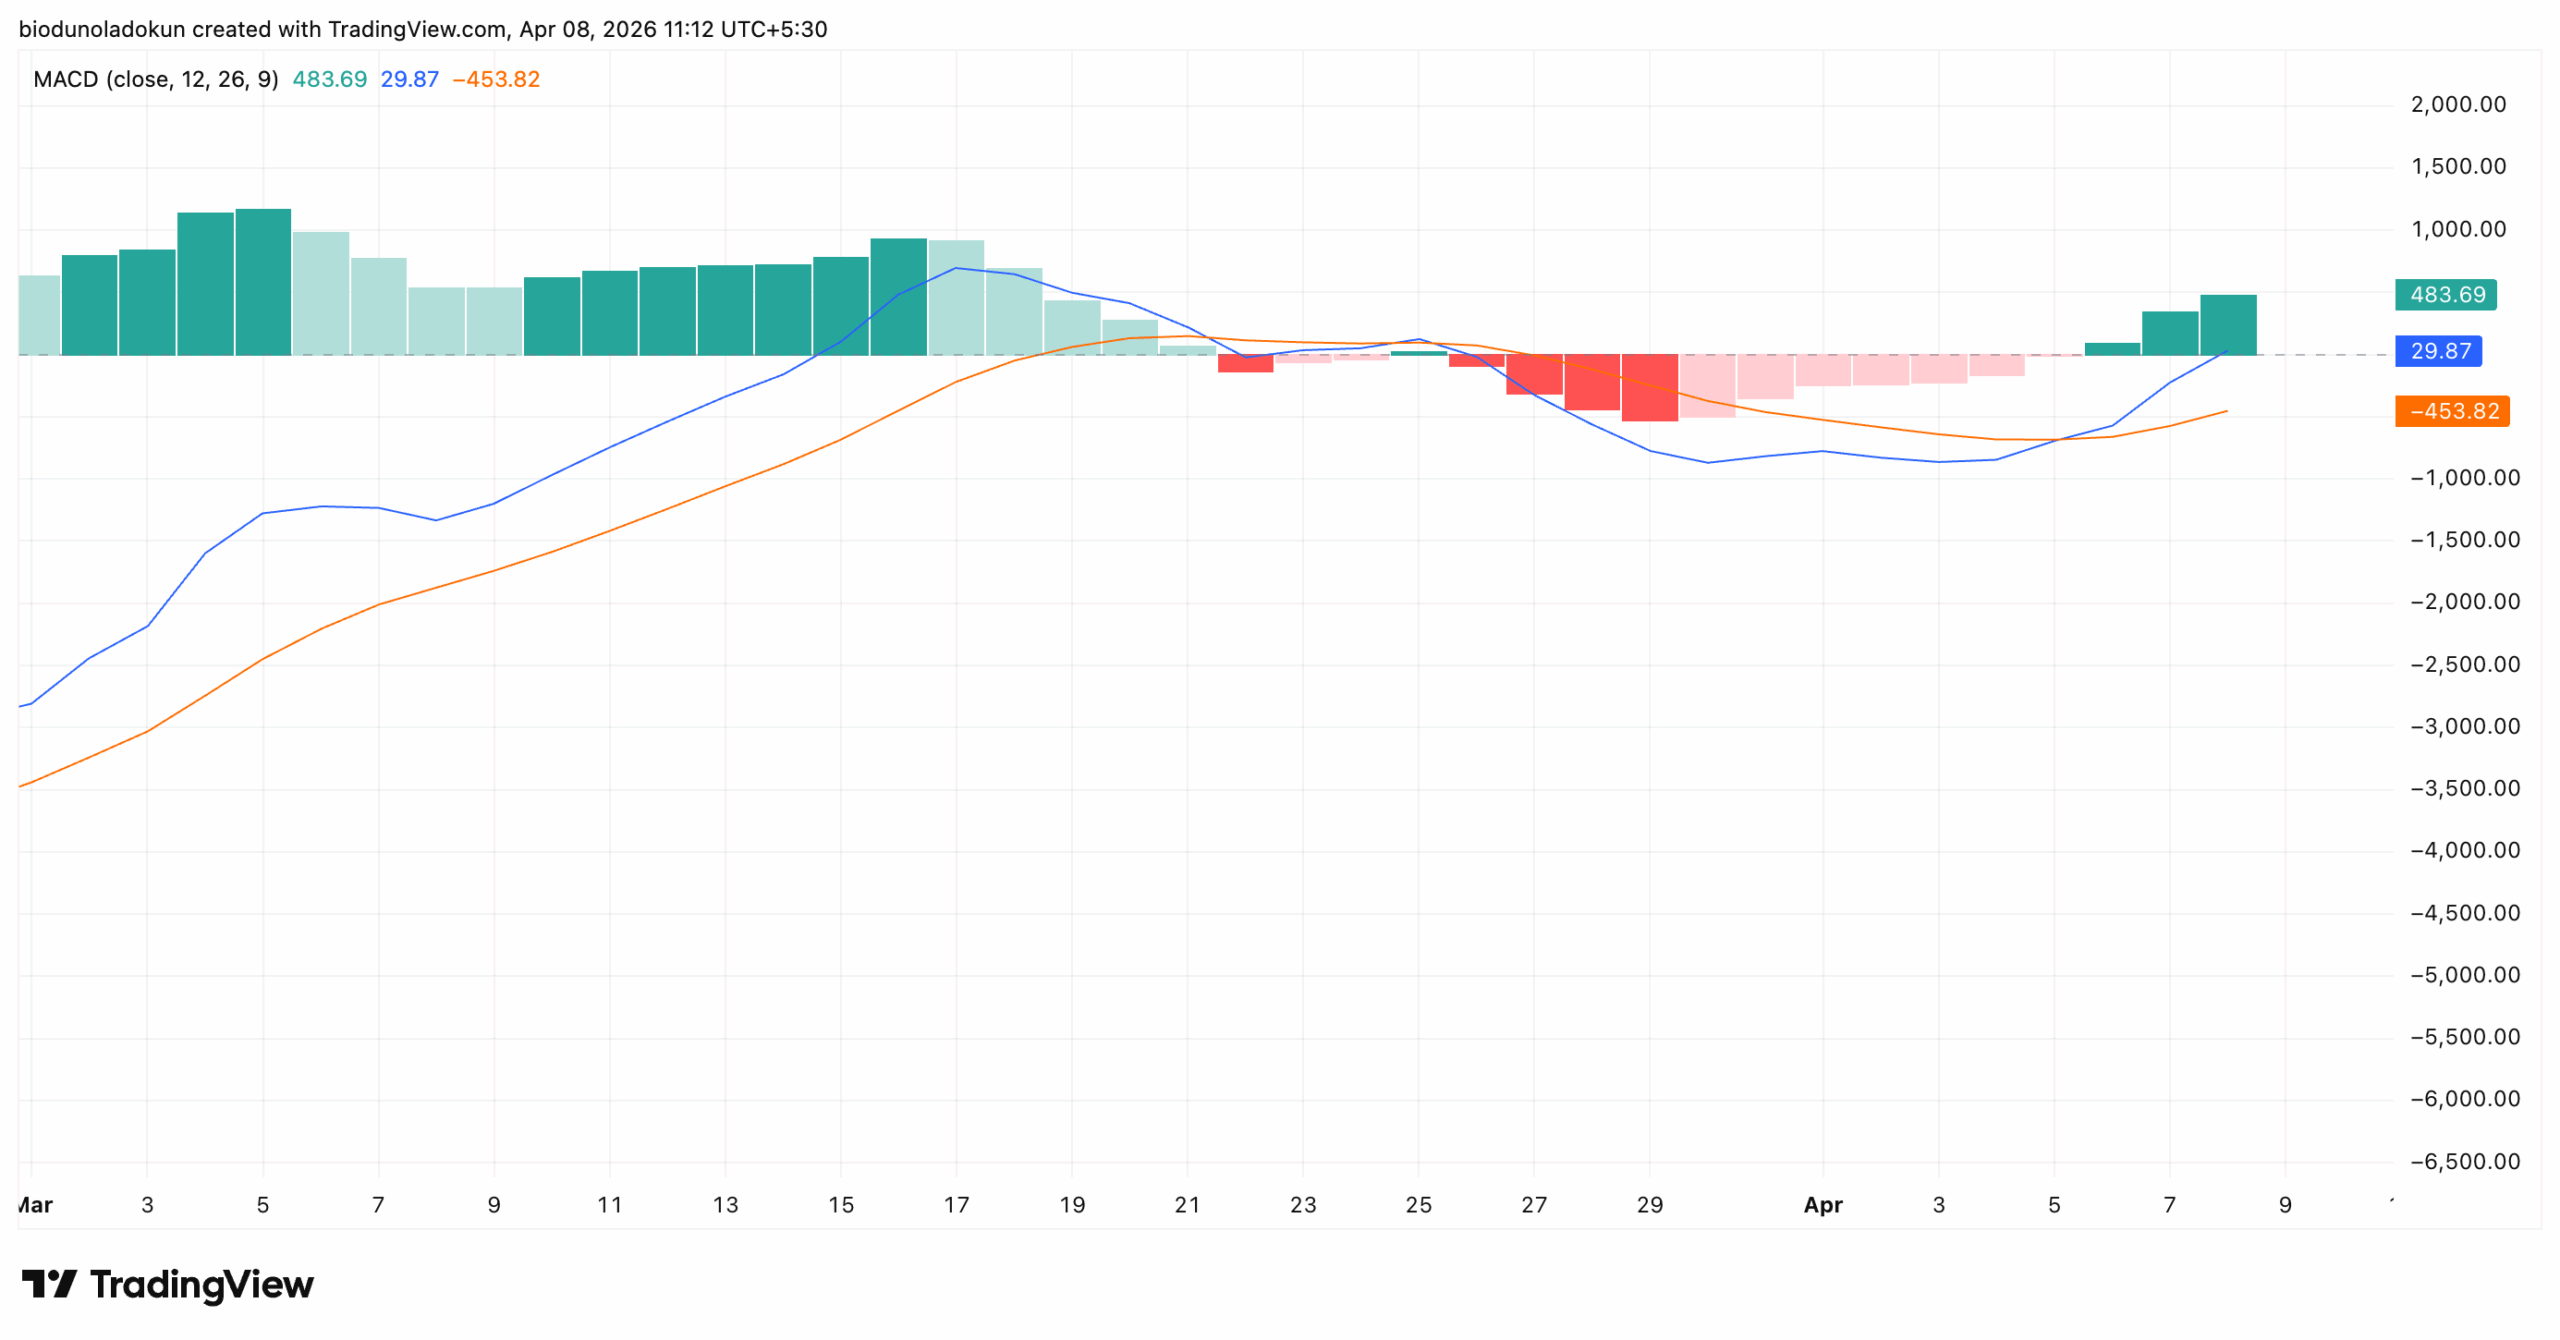
Spot market data support the short-term bullish case for BTC. On the daily chart, the coin’s Moving Average Convergence Divergence (MACD) indicator is flashing a buy signal. The MACD line (blue) has crossed above the signal line (orange) and the center line.
Also, the histogram has printed green bars that have grown larger over the past three sessions. This points to gradual yet steady buying pressure.
The MACD indicator is used to identify shifts in momentum and trend direction. When the MACD line crosses above the signal line, and the histogram turns green, it indicates that bullish momentum is gaining traction and that buyers are asserting control over price action.
For BTC, this setup suggests that buying pressure is strengthening beneath the coin’s lackluster price performance and could sustain a further rally if maintained.
Further, BTC’s Parabolic Stop and Reverse (SAR) confirms this bullish outlook. As of this writing, the indicator’s dots are below BTC’s price, providing dynamic support at $65,179.
An asset’s Parabolic SAR indicator identifies potential trend direction and reversals. When its dots are placed under an asset’s price, the market is in an uptrend.
It indicates that the asset is experiencing bullish momentum and that its price could continue to rally if buying persists.
However, not everyone shares the same enthusiasm as BTC’s spot traders.
U.S. Investors Sit Out Bitcoin Rally
On-chain data suggests that U.S.-based investors are not participating in the current rally with any conviction.
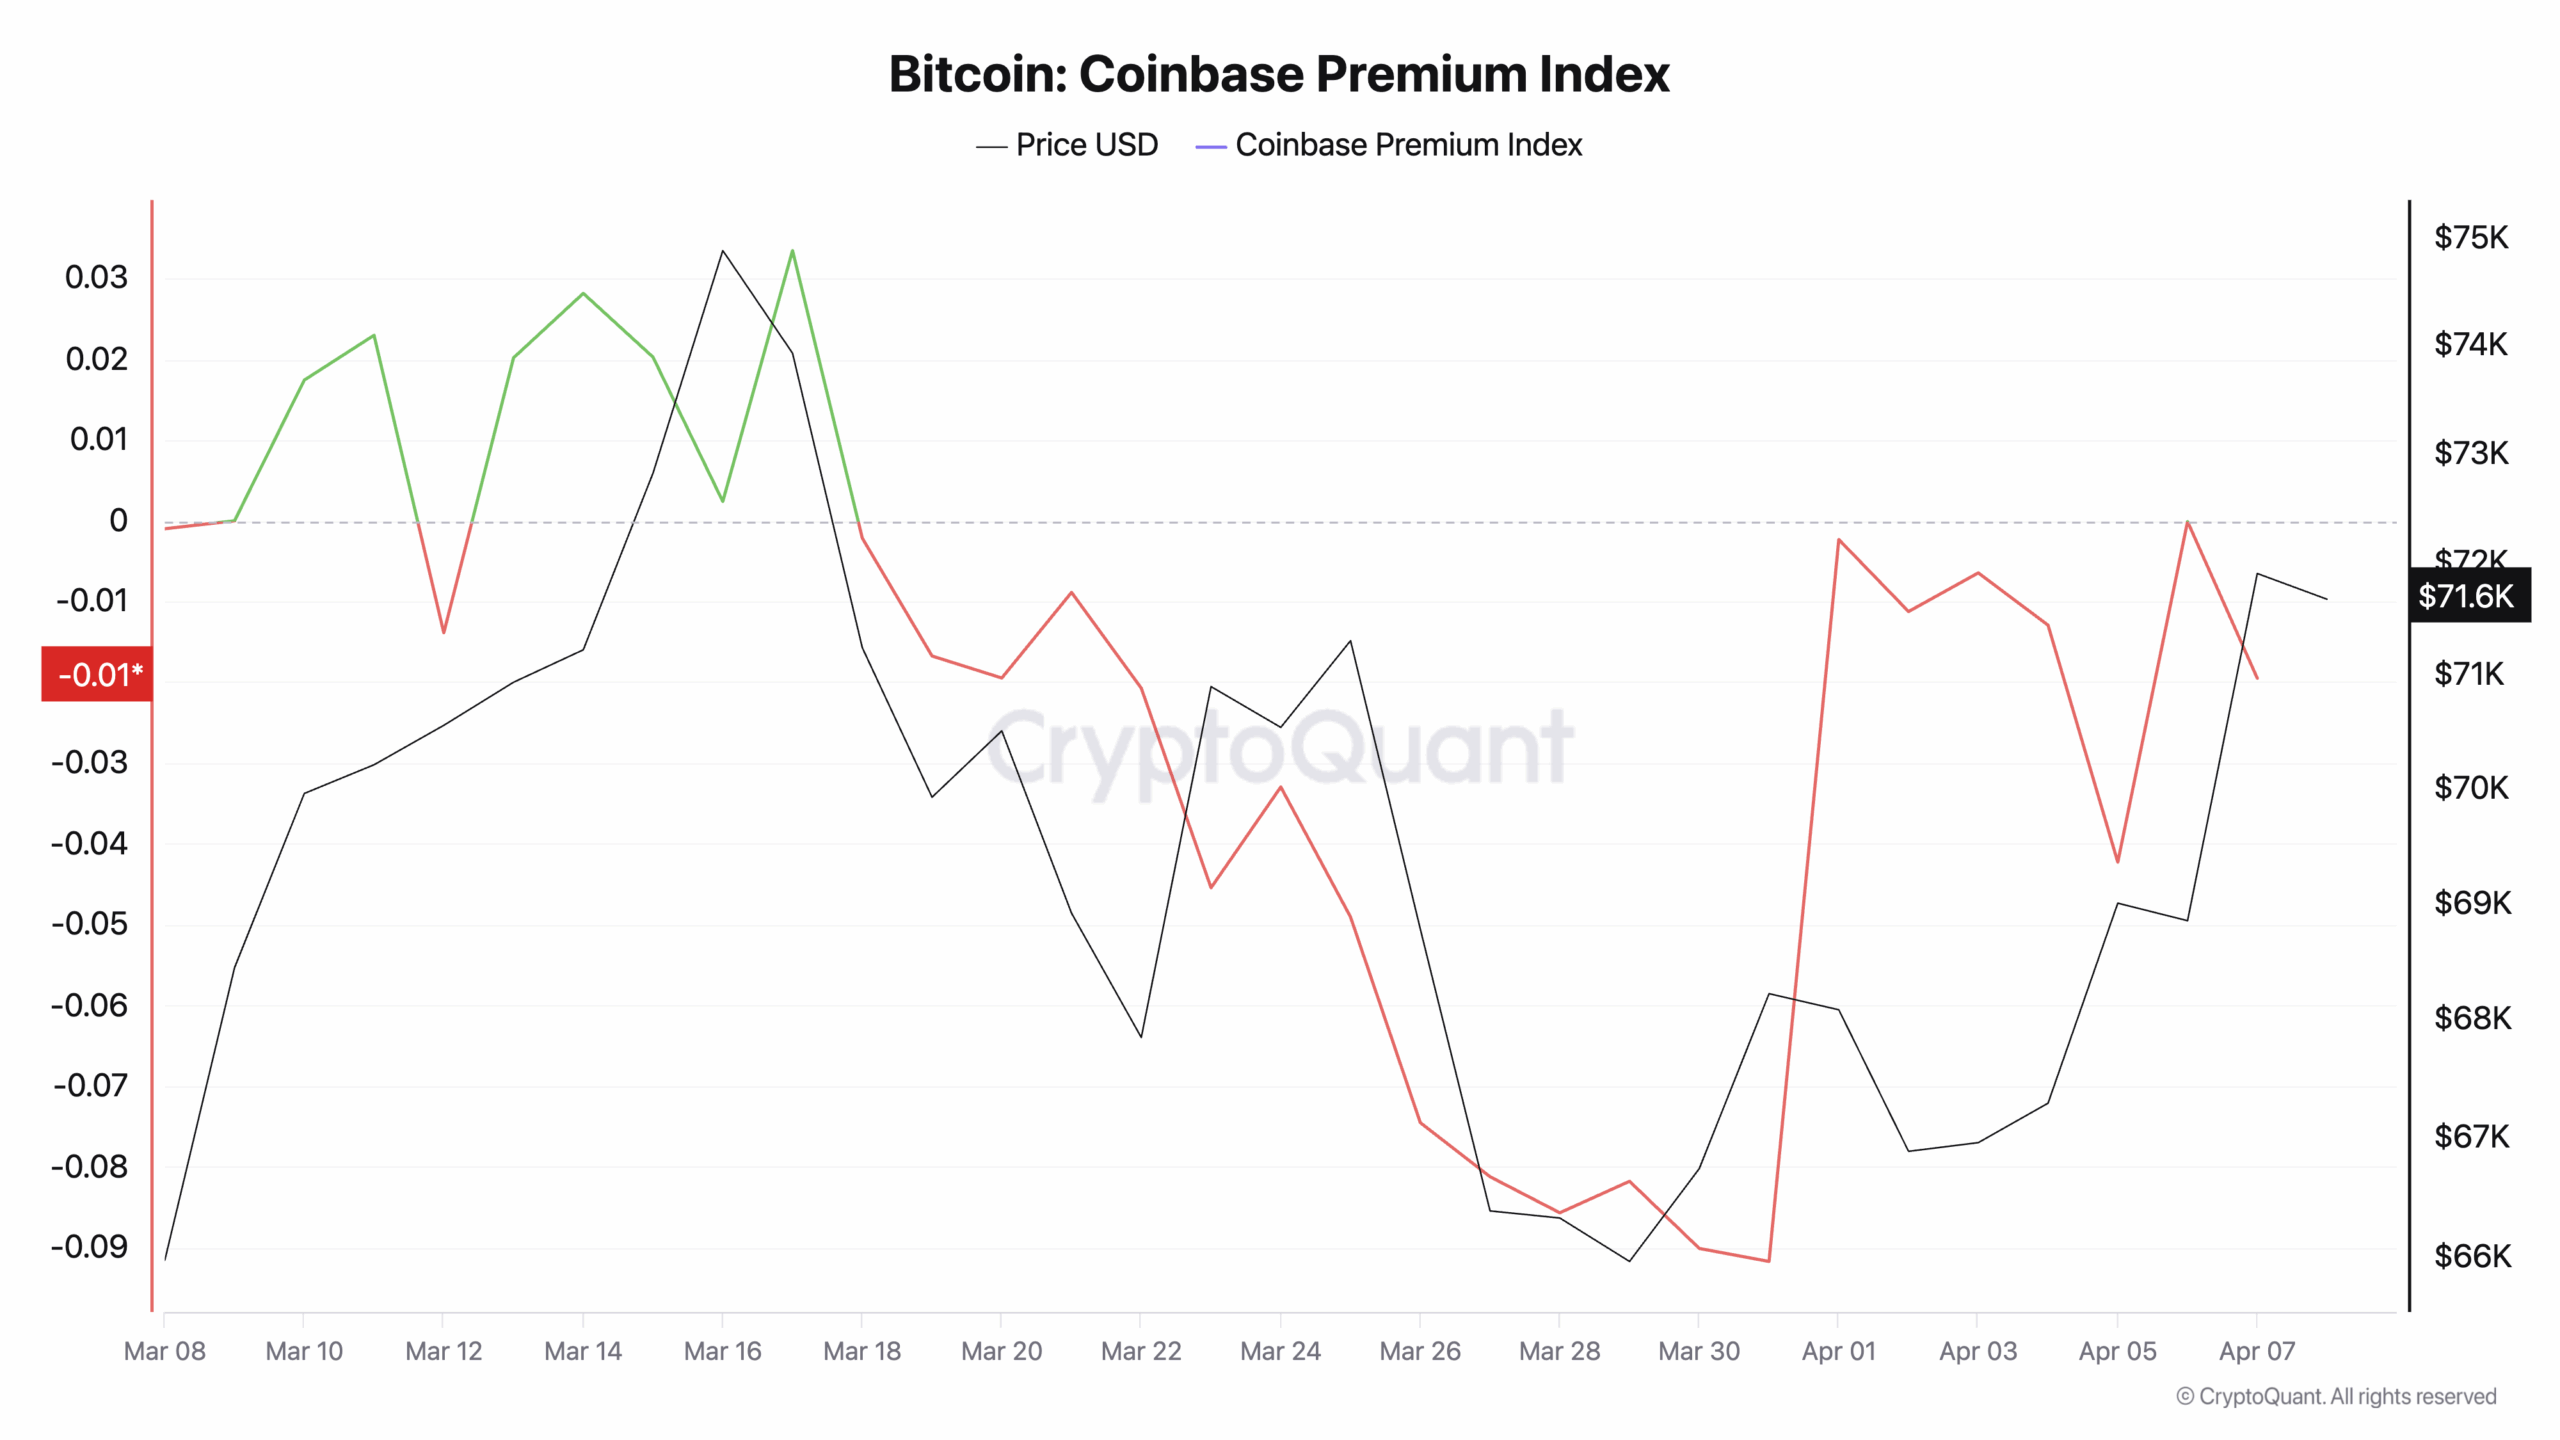
According to CryptoQuant’s data, BTC’s Coinbase Premium Index (CPI) remained in negative territory even after the ceasefire announcement, closing at -0.01 on Tuesday.
The CPI measures the difference between the coin’s prices on Coinbase and Binance and is a good indicator of U.S. investor sentiment.
When the index is positive, BTC trades at a premium on Coinbase, reflecting stronger buying demand from American participants. When it turns negative, as it has now, it indicates outright selling pressure from U.S.-based investors.
For context, BTC’s CPI was briefly positive in early to mid-March, coinciding with a period of relative price strength. But as the coin’s price began to slide from its highs around March 18, the index turned negative and has stayed there.
The index’s failure to return to positive ground despite today’s 4% price surge is significant. It signals that, rather than buying into the relief rally, American investors are selling into it, a pattern that may pull prices lower.
Derivatives Traders Bet Against Rally as Shorts Rise
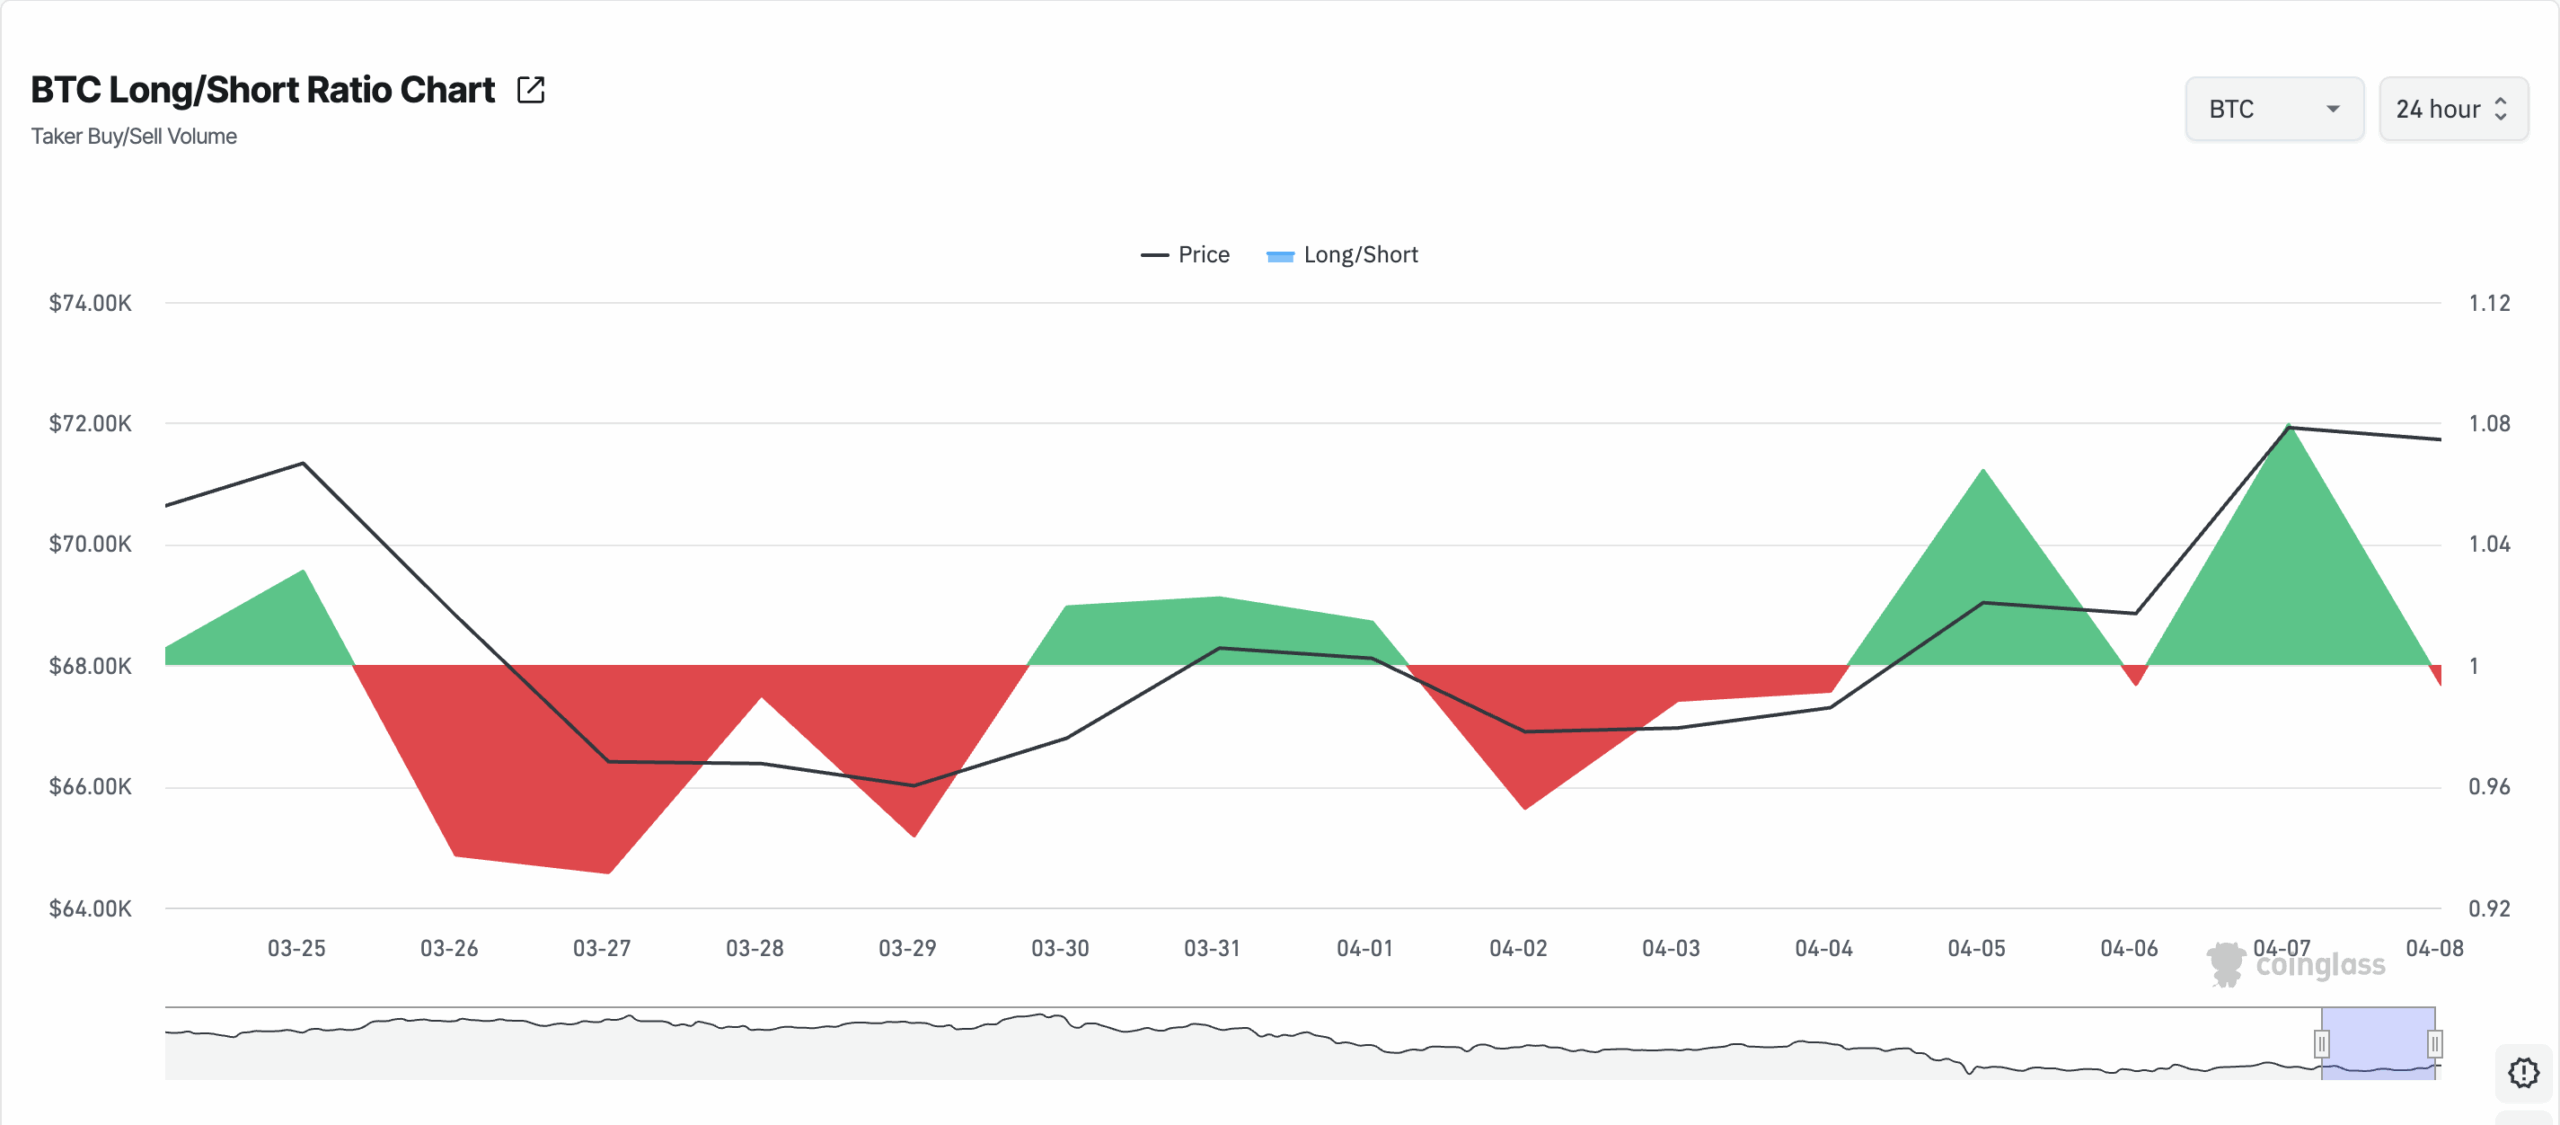
BTC’s derivatives traders are less optimistic than its spot traders. As of this writing, the coin’s long/short ratio is 0.99, tilting toward shorts.
This ratio tracks the balance between traders betting on price increases (longs) versus those betting on declines (shorts).
When the ratio is above 1, it indicates that long positions dominate, signaling bullish sentiment. Conversely, a ratio below 1, as in BTC, suggests that short positions are heavier, indicating bearish expectations.
Per Coinglass, after the ceasefire news drove BTC to $72,000 yesterday, the long/short ratio surged to a 27-day high of 1.07. However, it has now fallen back below 1, even with BTC’s 4% price hike over the past day.
This signals that traders are becoming increasingly cautious despite the recent price rise. It means more participants positioning for a potential pullback rather than a continued rally.
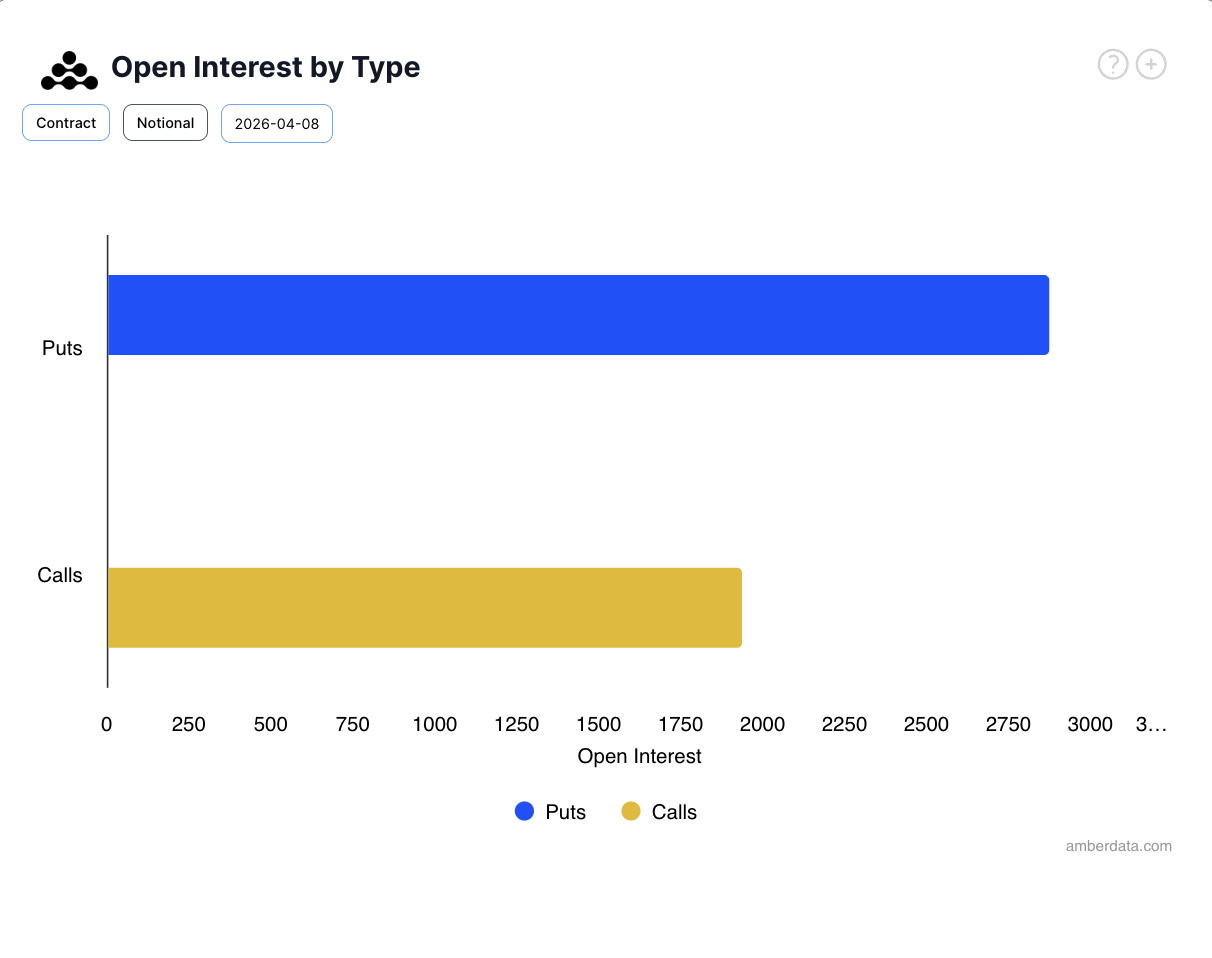
Furthermore, among BTC options traders during Wednesday’s trading session, there is greater demand for puts than for calls, a signal that investors are buying protection against potential price declines.
Per Deribit’s data, open interest stands at 2,900 contracts, compared to about 1,900 for calls. Such a skew suggests that investors are increasingly positioning for potential downside risk rather than further upside.
Drop to $60,000 Remains on the Table
As of this writing, BTC trades under the key resistance line at $72,766. If the buy-side pressure on the coin’s spot market grows, a daily close above this price ceiling is possible in the near term. Should this happen, it could propel BTC further toward $75,304.
However, if poor demand from US-based investors and the bearish bets of its derivatives traders continue to weigh on its price, BTC may shed some of its current gains and remain trapped in its sideways trend.
Disclaimer:
The information provided in this article is for informational purposes only. It is not intended to be, nor should it be construed as, financial advice. We do not make any warranties regarding the completeness, reliability, or accuracy of this information. All investments involve risk, and past performance does not guarantee future results. We recommend consulting a financial advisor before making any investment decisions.
Abiodun Oladokun is a Research Analyst at CCN, where he covers cryptocurrency markets with a focus on on-chain analysis, technical assessments, and emerging trends across decentralized finance (DeFi), real-world assets (RWA), artificial intelligence (AI), decentralized physical infrastructure networks (DePIN), Layer 2s, and meme coins.
Prior to CCN, he served as a Senior On-Chain Analyst at BeInCrypto, producing market reports spanning diverse crypto sectors.
Before that, he conducted technical analysis and market assessments of various altcoins at AMBCrypto, where he also contributed long-form quarterly research papers on DeFi, NFTs, DAOs, and scaling architectures, leveraging on-chain platforms including Messari, Santiment, DefiLlama, and Dune Analytics.
He began his crypto career as a research analyst at SixthSense DAO, developing blockchain forensic tools to trace the history of stolen assets.
Abiodun is a lawyer called to the Nigerian Bar and the founder of Ilé Ijó, a Lagos-based electronic dance music collective.