Here’s where the sharpest voices in crypto think the bottom really is, and why some are quietly buying the bleed.
Bitcoin Breaks Key Support Level as Liquidations Surge
Bitcoin entered the weekend under heavy pressure. The leading cryptocurrency slid beneath $63,000 on June 4, a level it had not traded under since late February, and the move detonated more than $1.1 billion in leveraged liquidations within 24 hours.
The drop was not an isolated flush. On-chain analytics firm Santiment pegs the slide at roughly 18% from a late-May high near $78,000 down to about $63,800, with the bulk of the damage compressed into just three days.
In a market built on leverage, a fast move in the wrong direction tends to feed on itself, and that is exactly what played out heading into June.
The sentiment has followed the price straight down. The Crypto Fear and Greed Index has collapsed to 17, firmly in “extreme fear” territory (on June 5), a reading that historically appears when traders are capitulating rather than calculating.
How Low Can Bitcoin Go? Analyst Price Targets Vary Widely
This is the question dominating crypto timelines right now, and the answers are all over the map, which tells you something about how uncertain this moment really is.
On the cautious but constructive end, trader Radz is urging followers to accumulate aggressively, arguing the downside looks limited from here and that $55,000 is roughly the worst-case floor he envisions.
Accumulate as much Bitcoin as possible. I don't expect it to go much lower, $55k at the worst. https://t.co/qWobSpcteX
Veteran trader Michaël van de Poppe had flagged $71,000 to $73,000 as the must-hold zone. Once that support cracked, he warned, lower levels were on the table, and that is what happened.
He now frames the current region as the area he would be bidding into as a net buyer, noting that while there are reasons to expect more downside, there are just as many arguments that Bitcoin is simply retesting its lows before turning back up.
Long-time Bitcoin skeptic Peter Schiff is not impressed by the discount at all. His argument: even a brutal decline toward $20,000 would not make Bitcoin a bargain, because he believes the asset is fundamentally overvalued at any price and that “cheaper” does not mean “cheap.”
That is a spread from $55,000 to $20,000, depending on who you ask, a reminder that “how low can it go” has no consensus answer in a market this emotional.
Bear Case Points to Wall Street Leverage Unwind
For some observers, this correction is not random. It is the script playing out.
Angel investor Simon Dixon argues the current sell-off is the leverage unwind he has warned about for years. His thesis: Bitcoin was gradually absorbed into the traditional financial system through Wall Street wrappers, structured products, and leverage, vehicles he says were designed to extend the existing financial machine rather than disrupt it.
Just posting this as a reminder.
For years I’ve warned that Bitcoin wasn’t just attracting retail investors and crypto speculators, it was being integrated into the financial-industrial complex through Wall Street wrappers, leverage, and structured products.
The risk, in his view, was always that this borrowed exposure would eventually unwind violently. He draws a sharp line between Bitcoin, the asset, and the financial products built on top of it, and cautions against treating leveraged, publicly traded proxies as the real thing.
That warning lands hard alongside the most eye-catching casualty of the drop. According to Jacob King, Bitcoin’s most prominent corporate champion, Michael Saylor is now sitting on losses approaching $11 billion, making him the single largest loser in the market. King could not resist the historical parallel, pointing to Saylor’s catastrophic dot-com-era wipeout in 2000.
Bull Case: Why Smart Money Is Buying Bitcoin Fear
Not everyone sees a collapse. Several analysts argue that the discount is an opportunity.
Analyst David offers one of the more vivid framings: Bitcoin as a beach ball held underwater. In his model, macro stress is the hand pushing the price down, and fair value floats somewhere between $99,000 and $133,000, yet the market has it pinned in the mid-$60,000s.
Bitcoin Is Being Held Underwater
Bitcoin is the beach ball. Macro stress is the hand.
The model says it wants to float near $99K–$133K. The market has it pinned at $66K.
But stress is not permanent.
Over time, liquidity cycles turn, forced selling exhausts, hedges decay, and… pic.twitter.com/HtXwu3fF5e
Forced selling, decaying hedges, and stressed liquidity can hold a price down temporarily, his argument goes, but not forever. When the pressure lifts, the gap between price and fair value closes, and that gap is the discount.
Santiment’s sentiment data adds a contrarian wrinkle. The crowd was at its most bullish right at the late-May highs and most bearish near the recent lows, the inverse of where conviction usually pays off. Sentiment, the firm notes, is moving with price rather than leading it, which is classic late-stage capitulation behavior rather than a top signal.
Meanwhile, 10x Research is making the case that the headline crash is hiding pockets of strength. Two tokens it flagged the prior week, Stellar (XLM) and Jito (JTO), returned roughly +29% and +16%, even as Bitcoin fell about 13%, a reminder that project-specific catalysts can override the broader downtrend for selective traders.
Bitcoin Rainbow Chart Signals Possible Accumulation Zone
Zoom out far enough, and the panic of a single week looks different.
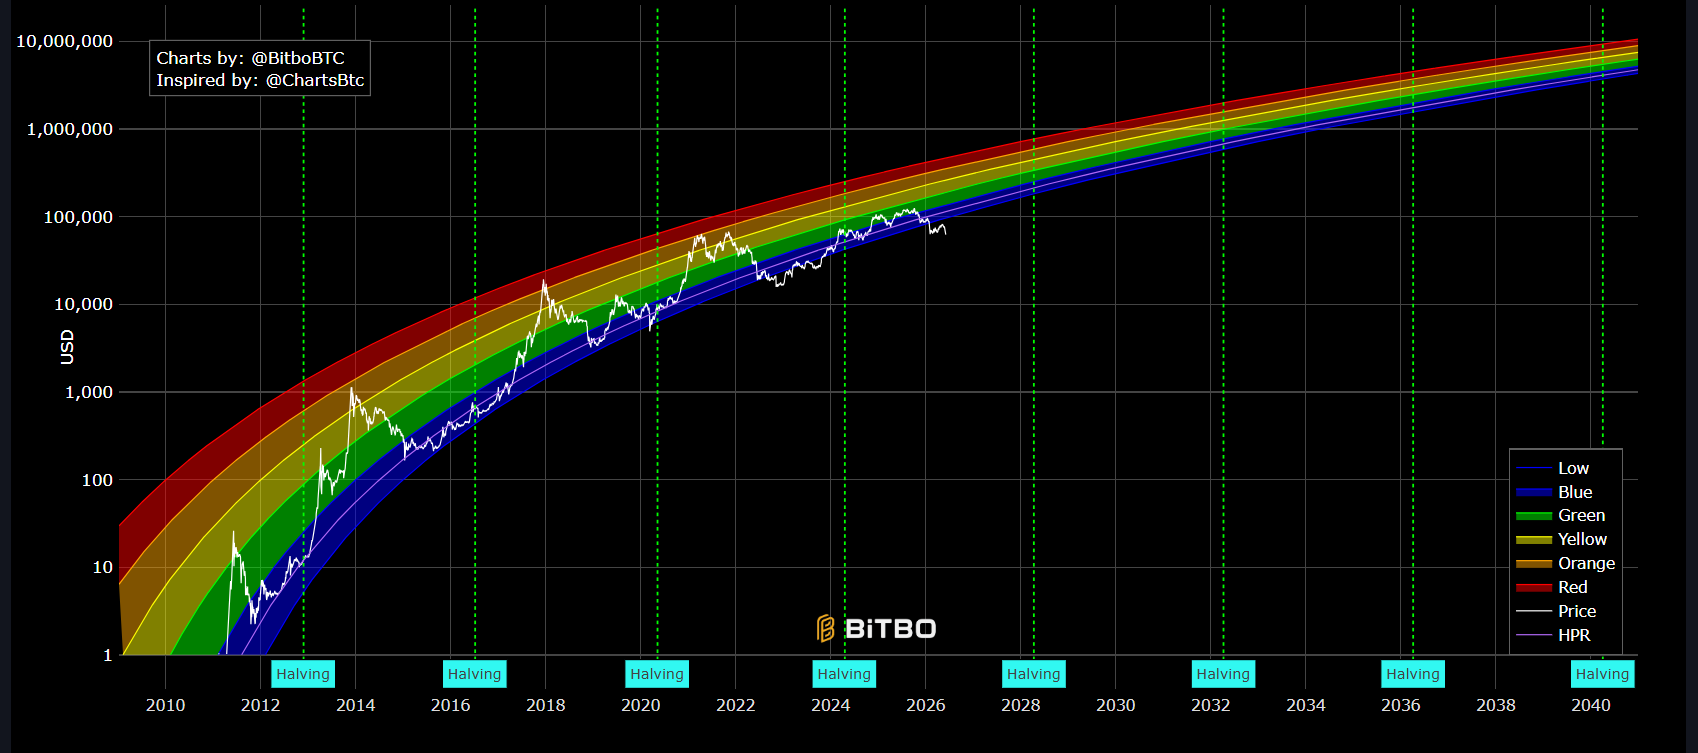
TheBitcoin Rainbow Halving Price Regression Chart plots Bitcoin’s entire price history on a logarithmic scale, banded into colored zones, from deep blue at the bottom (historically a “fire sale” accumulation region) through green and yellow to the orange and red zones that have marked previous market tops. Vertical markers track each halving event, the roughly four-year supply shocks that have anchored Bitcoin’s major cycles.
As of mid-2026, Bitcoin’s price line is sitting in the lower-to-middle bands of that rainbow, nowhere near the red “maximum bubble” territory that defined prior cycle peaks, and in a cooler-colored zone that long-term holders have historically treated as a buying region rather than a selling one.
For believers in the four-year cycle, that placement is the strongest argument that the current drawdown is a correction within a larger uptrend rather than the start of a structural collapse.
What to Watch Next for Bitcoin Price
Bitcoin has fallen hard and fast, leverage has been flushed, and fear is running hot, the textbook ingredients of either a local bottom or the first leg of something deeper.
The bears point to an unfinished Wall Street leverage unwind and a $20,000 worst case, whereas the bulls point to a fair-value gap, an inverted sentiment signal, and a Rainbow Chart sitting in historical accumulation territory.
What virtually every analyst agrees on is this: the next move is best made with a clear head, not under the pressure of a red screen.
The levels to watch in the days ahead are whether Bitcoin can reclaim the mid-$60,000s and stabilize, or whether the $55,000 zone gets put to the test.
Disclaimer:
The information provided in this article is for informational purposes only. It is not intended to be, nor should it be construed as, financial advice. We do not make any warranties regarding the completeness, reliability, or accuracy of this information. All investments involve risk, and past performance does not guarantee future results. We recommend consulting a financial advisor before making any investment decisions.
Dr. Guneet Kaur is a senior editor at CCN.com and a Science Fellow at Exponential Science. She is a fintech and blockchain expert with extensive experience in digital finance education, blockchain ecosystems, and cryptocurrency markets. She has worked with global media such as Cointelegraph, as well as education and blockchain platforms, to design and lead strategic content and learning initiatives. As an educator and assessor for top-tier executive programs, she bridges real-world fintech trends with academic insight.
Dr. Kaur is also a published researcher and peer reviewer across fintech and data science journals, including Financial Innovation Journal and International Journal of Big Data Intelligence and Applications. Her work spans data-driven analysis, Web3 innovation, and technical content development. With a strong foundation in both industry and academia, she translates complex financial technologies into practical applications, empowering learners, professionals, and institutions across the rapidly evolving digital finance landscape.