Learn how to analyze DeFi protocol risk before investing in 2026. Understand smart contract, liquidity, and yield risks to earn returns. | Credit: CCN.com
Share
Key Takeaways
Bitcoin is trading 45% below its long-run trend, suggesting structural undervaluation rather than euphoric excess.
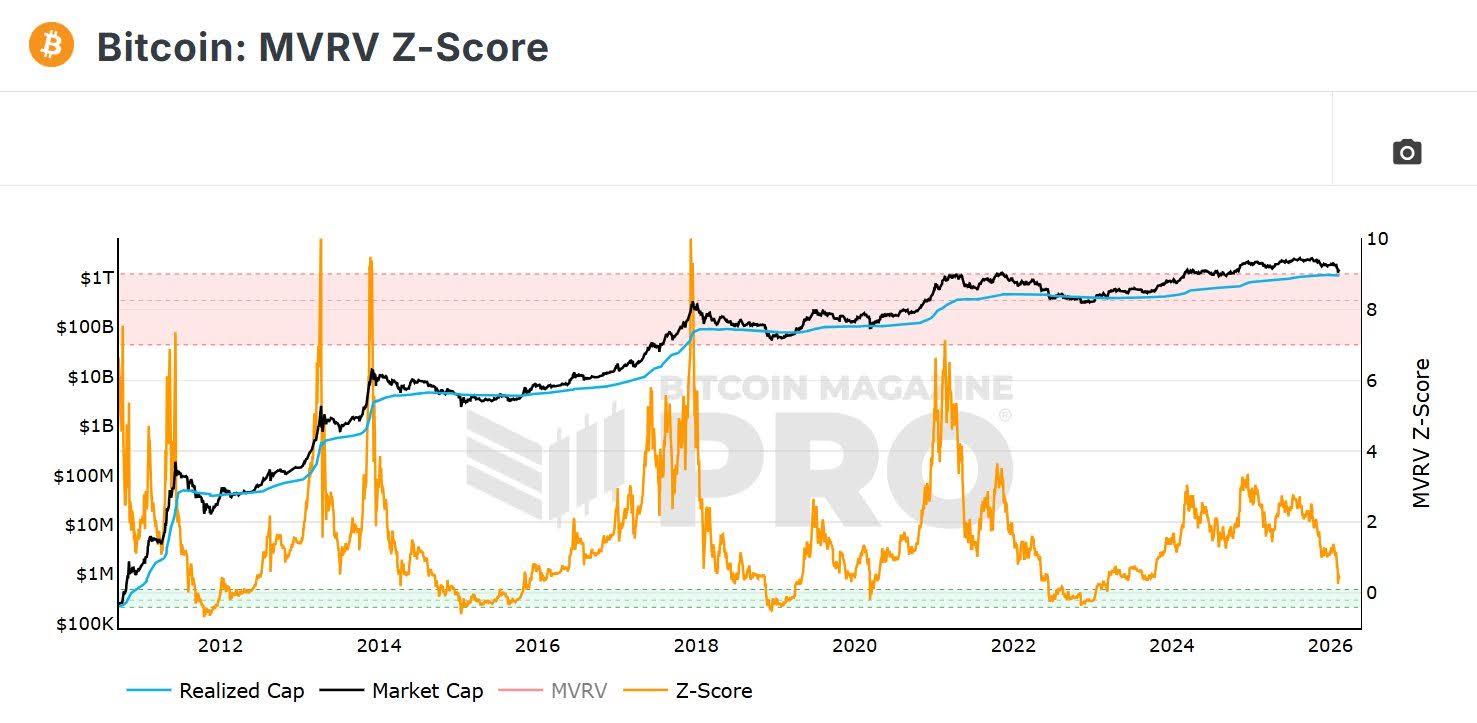
A Z-score of -0.87 indicates BTC is statistically inexpensive, far from historical cycle tops.
Historically, when BTC trades at similar discounts, it has reverted toward trend within months, with a modeled half-life of 4.5 months.
The strongest historical forward returns appear at the 18-month horizon, with projections near $200K under trend continuation.
Bitcoin’s long-term story hasn’t changed: fixed supply, cyclical liquidity, and reflexive demand.
But in the short term, price action can feel chaotic. To cut through the noise, investors increasingly rely on quantitative metrics that help frame where BTC sits in its cycle.
Here are 10 numbers that matter right now, and what they collectively reveal about Bitcoin’s price outlook.
Please note that the quantitative metrics and analytical framework presented in this article were shared by analyst David on X (@david_eng_mba) on February 11, 2026. His work is informed by a background in engineering, macroeconomic analysis, and market structure research.
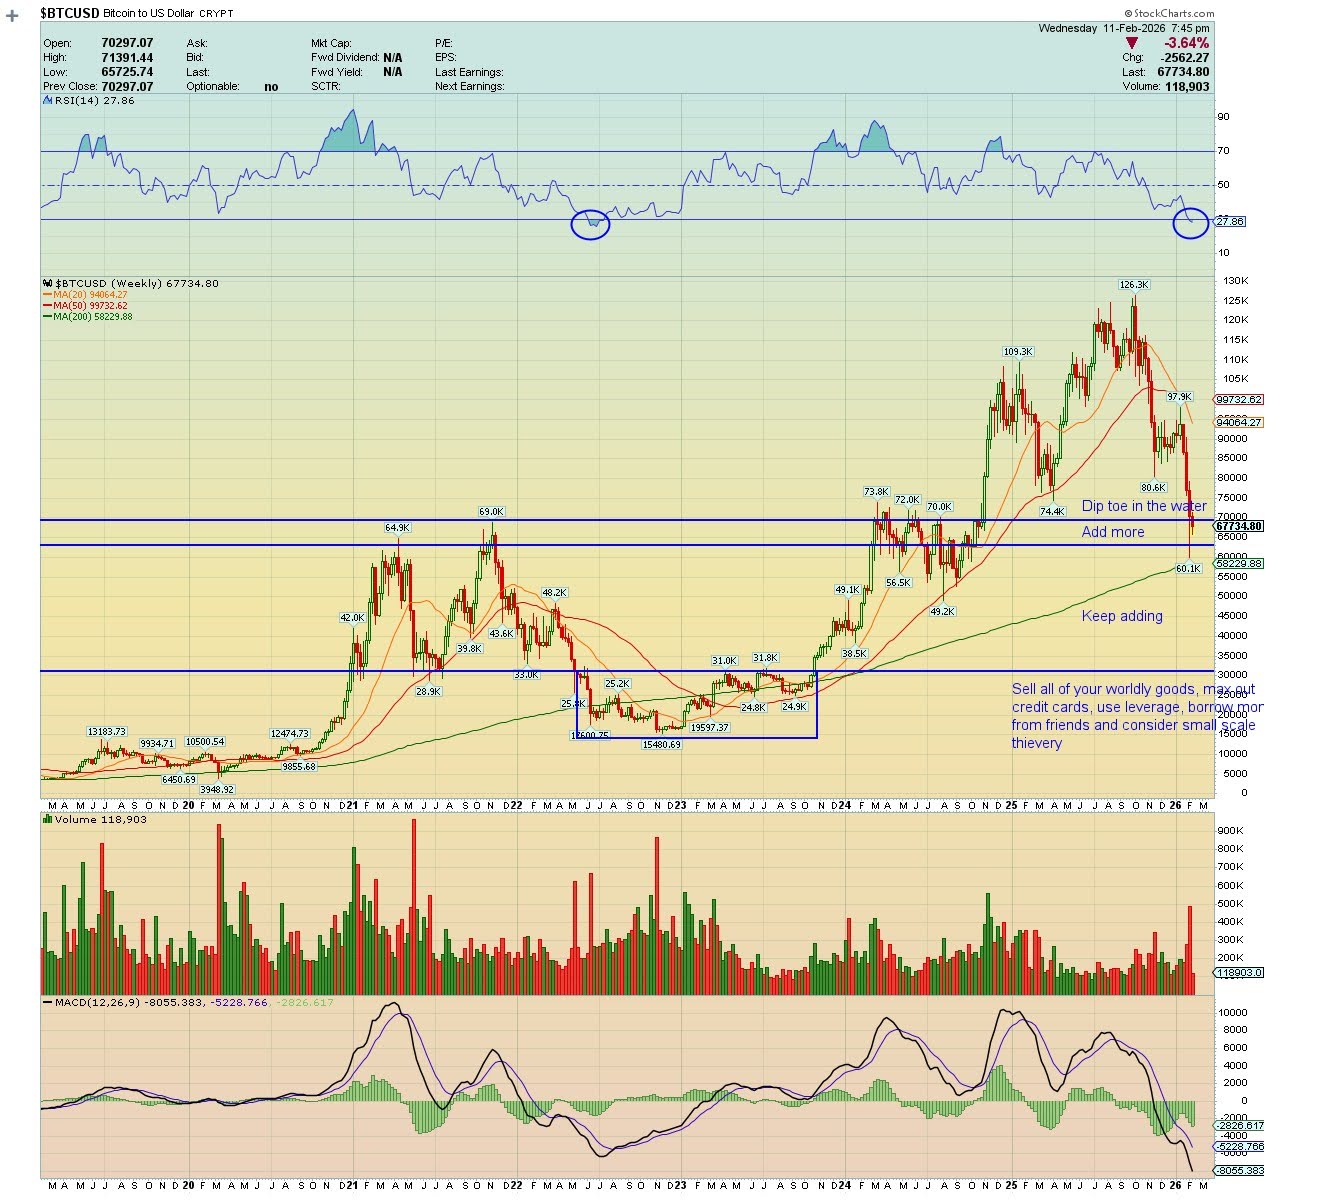
At $67,125, Bitcoin is trading below its all-time highs but far above prior-cycle peaks. This positioning matters. In prior cycles, BTC has typically experienced:
Today’s price sits in a transitional zone: no longer in deep bear territory, but not yet in full price discovery mode.
On its own, price tells you nothing about direction. In context, it becomes powerful.
2. Bitcoin Trend Value: $123,236
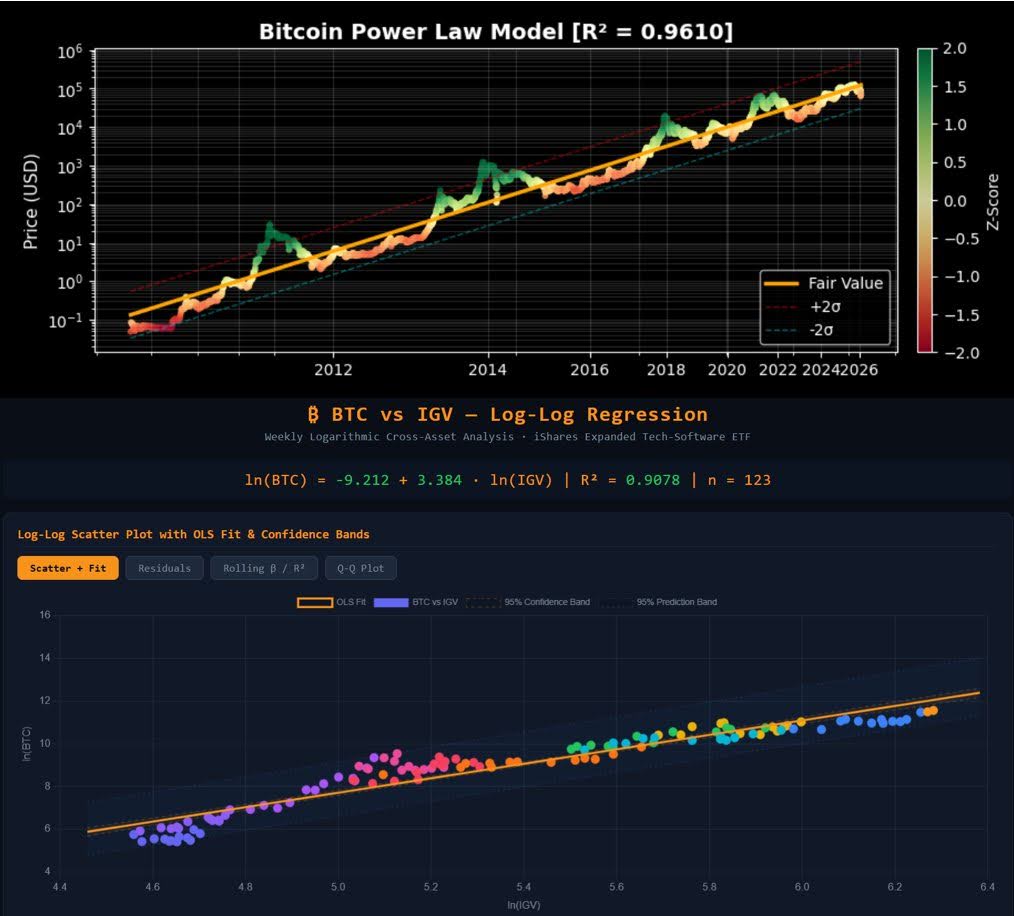
Trend models attempt to estimate Bitcoin’s long-run equilibrium path. One widely discussed framework is the power-law model, which suggests Bitcoin follows a logarithmic growth curve as adoption increases over time.
According to that model, Bitcoin’s current “trend value” is approximately $123,236.
That implies something critical: BTC is trading significantly below its long-term structural trajectory.
Trend value is not a short-term price target. It’s a baseline for understanding structural mispricing.
3. Bitcoin Discount: -45.5%
At $67,125, Bitcoin is trading at a 45.5% discount to its long-run growth trend line, versus a $123,236 trend value.
Mean reversion models estimate how long it takes for the price to move halfway back toward its long-run trend.
A half-life of 4.5 months implies that if conditions normalize, BTC could trend toward approximately $107,000 within that timeframe.
That doesn’t guarantee a straight line upward. It means that, statistically, when BTC trades at this type of discount, the average time to reclaim half the gap is roughly one-quarter.
Markets don’t move mechanically. But historically, Bitcoin does not remain far below trend for extended periods once liquidity turns supportive.
7. Bitcoin Best Forward Signal Horizon: 18 Months ($200,000)
Long-horizon forward returns have historically been strongest at the 12–24 month mark following undervaluation phases.
The “best forward signal horizon” here suggests that 18 months out, statistical projections center near $200,000.
Bitcoin’s best forward signal horizon. | Credit: TJ X profile
Why 18 months?
Because Bitcoin cycles are slow, liquidity-driven, and reflexive. They require:
A 548-day non-overlapping correlation of -0.786 suggests that Bitcoin tends to move inversely relative to its own price behavior roughly 1.5 years prior.
In simpler terms: Bitcoin has historically exhibited cyclical mean reversion across ~18-month windows.
An R² of 0.617 means over 60% of future variance can be explained by this cyclical pattern.
This reinforces the idea that Bitcoin moves in structured waves rather than a random walk.
The implication: periods of underperformance often precede periods of outperformance on similar time scales.
Cyclical mean reversion favors upside over 12-18 months.
Short-term positioning sits near a derivatives inflection point.
None of this guarantees immediate upside. Markets can stay discounted longer than models expect.
But historically, periods like this, where BTC is structurally intact, statistically inexpensive, and liquidity-sensitive, have preceded powerful expansions.
Bitcoin is not priced for euphoria. It is priced below trend, below statistical equilibrium, and near a derivatives pivot.
The framework is simple:
The structure is intact.
Liquidity is the accelerator.
Beta amplifies the move.
If global liquidity turns supportive, historical patterns suggest Bitcoin does not simply drift higher, it reverts aggressively toward trend.
And trend, for now, sits meaningfully above spot.
The next 18 months may matter more than the next 18 days.
Based on long-term trend models, Bitcoin is trading at roughly a 45% discount to its power-law trend value. Its Z-score of -0.87 also suggests it is statistically inexpensive relative to historical averages. That does not guarantee immediate upside, but it indicates BTC is below long-run structural equilibrium.
What does “trend value” mean for Bitcoin?
Trend value refers to Bitcoin’s estimated long-term growth trajectory, often modeled using logarithmic or power-law regression. It reflects growth in adoption over time rather than short-term speculation. The current estimated trend value of $123,000 suggests where BTC might trade if it were aligned with its historical structural path.
What does the power-law R² of 0.961 indicate?
An R² of 0.961 means the long-term power-law model explains 96.1% of Bitcoin’s historical price variance. This suggests that, despite volatility, Bitcoin has followed a remarkably consistent adoption-driven growth curve over time.
What is a “gamma flip” and why does it matter?
The gamma flip refers to the price level where options market makers shift from stabilizing price moves to amplifying them. With the flip near $67,801, close to the current price, short-term volatility could increase if BTC decisively moves above or below that level.
Disclaimer:
The information provided in this article is for informational purposes only. It is not intended to be, nor should it be construed as, financial advice. We do not make any warranties regarding the completeness, reliability, or accuracy of this information. All investments involve risk, and past performance does not guarantee future results. We recommend consulting a financial advisor before making any investment decisions.
Giuseppe Ciccomascolo began his career as an investigative journalist in Italy, where he contributed to both local and national newspapers, focusing on various financial sectors.
Upon relocating to London, he worked as an analyst for Fitch's CapitalStructure and later as a Senior Reporter for Alliance News. In 2017, Giuseppe transitioned to covering cryptocurrency-related news, producing documentaries and articles on Bitcoin and other emerging digital currencies. He also played a pivotal role in establishing the academy for a cryptocurrency exchange website. Crypto remained his primary area of interest throughout his tenure as a writer for ThirdFloor.


 Easy
Easy