Key Takeaways
- Bitcoin’s 2026 downside depends on market conditions, not a single price prediction.
- Normal bear markets historically bottom far above catastrophic collapse levels.
- Deep declines require forced selling and systemic stress, not routine volatility.
- Liquidity, leverage, and psychology, not belief, ultimately determine Bitcoin’s lows.
When people ask, “How low can Bitcoin go in 2026?”, they are rarely asking a single, precise question.
Most of the time, they are actually asking one of three very different things:
- What is the absolute worst-case crash scenario? (Panic, black-swan events, systemic failure)
- What is a realistic bear-market low within a normal Bitcoin cycle? (Painful, but historically consistent)
- What kind of drawdowns are likely during volatility without a full collapse? (Corrections inside a broader market structure)
These outcomes are not interchangeable, and treating them as one leads to confusion and exaggerated fear.
This article separates these outcomes and evaluates each using historical precedent, market structure, probability-based reasoning derived from ChatGPT analysis, and perspectives commonly expressed by real-world market analysts, rather than emotion or narrative.
Why “How Low Bitcoin Can Go” Is the Wrong Question Without Context
Bitcoin has no intrinsic valuation anchor such as earnings, coupons, or dividends. Its price is set entirely by market participants under varying liquidity conditions. As a result, asking “how low can Bitcoin go in 2026” without defining the environment leads to misleading answers.
Historically, Bitcoin does not move randomly. Large declines occur under specific, repeatable conditions: leverage unwinds, liquidity withdrawal (e.g., Bhutan selling Bitcoin), macro risk-off regimes, and prolonged post-euphoria fatigue.
This article evaluates Bitcoin’s potential downside in 2026 by examining how Bitcoin has actually behaved in comparable periods, rather than relying on narratives or optimism.
Bitcoin in Context: Where 2026 Sits in the Cycle
Bitcoin has historically moved in four-year halving-anchored cycles, not because of mysticism, but because supply issuance and speculative behavior cluster around predictable intervals.
A simplified framework looks like this:
- Year 0: Halving
- Year 1: Expansion / Bull market
- Year 2: Peak volatility / Distribution
- Year 3: Bear market / Consolidation
- Year 4: Accumulation → next halving
Where 2026 Falls in Bitcoin’s Market Structure
According to ChatGPT, the most recent halving occurred in 2024, which places 2026 after the expansion phase (i.e., peak volatility), not at the beginning of a new cycle.
Historically, similar post-euphoria years include:
- 2014
- 2018
- 2022 (remember the 2022 bear market?)
All three produced meaningful drawdowns, but none resulted in a permanent collapse.
Base assumption: 2026 is more likely to be a cooling or consolidation year, not a hyper-bull market and not a total reset to zero.
Bitcoin has repeatedly exhibited a four-year rhythm anchored around supply halvings. While not a law of nature, this structure has coincided with human behavior: speculation, leverage buildup, distribution, and eventual consolidation.
Historically:
- The year following a halving tends to experience expansion and speculative excess.
- The subsequent year often marks a peak or transition.
- The following one to two years are characterized by drawdowns, consolidation, and reduced interest.
The year 2026 follows the 2024 halving and the subsequent speculative expansion phase. Comparable historical periods include 2014, 2018, and 2022. Each of those years shared common traits:
- Prices remained well above zero.
- Confidence declined significantly.
- Large drawdowns occurred without destroying the network.
This positioning matters. Early-cycle years behave very differently from post-euphoria years, and most severe declines in Bitcoin history occurred after, not before, periods of excess optimism.
What Has Changed and What Has Not Since Earlier Bitcoin Bear Markets
Bitcoin in the mid-2020s differs structurally from its early cycles. Market depth has increased, custody infrastructure has matured, and ownership is more distributed among long-term holders and institutions. These changes reduce the probability of total collapse, but they do not remove downside risk.
At the same time, several destabilizing forces remain unchanged:
- Leverage continues to amplify both rallies and crashes.
- Bitcoin still trades as a global risk asset, responding to liquidity conditions.
- When confidence breaks, selling pressure can overwhelm fundamentals.
The result is a market that is more resilient but not immune. Declines may be less extreme than early-cycle collapses, but deep drawdowns remain a structural feature.
K33: Why an 80% Bitcoin Collapse Looks Unlikely This Cycle
K33 has pushed back against growing fears that Bitcoin is heading toward another deep, cycle-style collapse, even as recent price action has unsettled the market.
Bitcoin has retreated sharply from its October high, losing roughly two-fifths of its value. The decline accelerated during a week of elevated global risk aversion, reviving comparisons to past post-peak downturns. These moves have naturally reignited discussion around the four-year cycle framework that has historically framed Bitcoin’s largest drawdowns.
K33 acknowledges that recent behavior is uncomfortably familiar. The pace of selling, the deterioration in sentiment, and the return of defensive positioning resemble periods that preceded major bear markets in earlier cycles. According to the firm, these similarities alone are enough to explain why cycle narratives are regaining traction.
However, K33 argues that resemblance does not equal repetition.
Why Cycle Fears Can Reinforce Downside Pressure
One of the key risks highlighted by K33 is behavioral rather than technical. When a large share of the market expects a deep bear phase, those expectations can influence decisions in ways that intensify selling pressure.
Long-term holders may reduce exposure to protect gains accumulated during the prior rally, while new capital may hesitate to enter until clarity returns. This combination can suppress demand even in the absence of a structural breakdown. In that sense, cycle narratives can become self-reinforcing, regardless of whether the underlying conditions truly justify them.
Structural Differences From Prior Collapse Periods
Despite the similarities in price behavior, K33 emphasizes that the broader environment differs meaningfully from earlier bear-market episodes.
The most important distinction lies in the macro backdrop. Previous severe drawdowns were amplified by aggressive monetary tightening and widespread credit stress, which forced leveraged players to unwind positions rapidly. In contrast, the current rate environment is less restrictive, reducing the likelihood of sudden, system-wide deleveraging events.
Market structure has also evolved. Institutional participation is broader, access is increasingly routed through regulated products, and liquidity is distributed across more channels than in earlier cycles. These factors do not prevent declines, but they tend to dampen the extreme feedback loops that previously drove peak-to-trough losses beyond 80%.
For these reasons, K33 does not expect Bitcoin to experience another year-long collapse of the same magnitude as those seen in past cycle resets.
Historical Drawdowns as the Primary Evidence Base
ChatGPT argues that Bitcoin’s past drawdowns provide the clearest framework for evaluating future downside. Across multiple cycles, peak-to-trough declines have followed a consistent pattern:
- Early cycles experienced collapses exceeding 90%.
- Later cycles showed diminishing drawdowns, closer to 75–80%.
- Each cycle bottomed only after leverage was cleared and speculative interest faded.
The trend is not elimination of risk, but moderation. This supports the conclusion that future bear markets are more likely to resemble 60–75% declines from cycle highs, rather than catastrophic resets.
Why Any 2026 Low Must Be Measured From the Prior Peak
Downside analysis without a reference peak is meaningless. Bitcoin does not fall to arbitrary numbers; it falls relative to where excess optimism previously pushed it.
For example:
- A 60% decline from a major peak produces a very different outcome than an 85% decline.
- The difference between these scenarios is not belief, but market environment.
Historically, declines in the 60–70% range occur when markets cool gradually and liquidity tightens without systemic failure. Declines exceeding 80% typically require cascading failures or severe macro stress.
Michaël van de Poppe’s View: Why He Believes Bitcoin Is Near a Cycle Bottom
Michaël van de Poppe argues that current market conditions are more consistent with a cyclical bottom than a market peak, and that many investors are interpreting the environment using the wrong framework.
His core thesis is macro-driven, not short-term price-based.
Business Cycle Argument
According to van de Poppe, the global business cycle is at one of its weakest points in more than a decade. Historically, such periods coincide with:
- Economic pessimism
- Corporate layoffs
- Reduced speculative appetite
- Broad disinterest in non-essential assets
He views this phase as the end of contraction rather than the start of expansion-driven declines. In his framework, markets tend to bottom when economic conditions feel worst, not when they feel strong.
Relative Valuation Signals (Bitcoin vs. Traditional Assets)
Van de Poppe places heavy emphasis on relative valuation, not absolute price.
He highlights that:
- Bitcoin’s valuation relative to gold is at the lowest level ever recorded on the RSI metric
- Ethereum’s valuation relative to silver is also at historic lows on higher-timeframe momentum indicators
These signals suggest to him that crypto assets are historically cheap compared to traditional stores of value, even if their nominal prices remain volatile.
In his view, such relative extremes have historically aligned with accumulation phases rather than distribution phases.
Labor Market Stress as a Contrarian Signal
Van de Poppe points to widespread layoffs, particularly in technology and knowledge-based sectors, as a sign of late-cycle economic stress.
He argues that periods where capital and talent rush toward the “next big theme” (in this case, artificial intelligence) often coincide with neglect of existing asset classes.
From a contrarian perspective, he sees this neglect as constructive rather than dangerous.
Policy and Liquidity Tailwinds
Another pillar of his argument is forward-looking liquidity.
He believes several macro and policy developments may support risk assets over the medium term, including:
- A more accommodative monetary stance
- Reduced fiscal uncertainty
- Improving regulatory clarity for digital assets
- Expansionary liquidity conditions
In his framework, these factors do not signal an immediate rally, but they reduce downside risk and increase the probability that markets are forming a base.
Michael Burry’s Latest Bitcoin Warning: Price Thresholds and Market Risks
Michael Burry, the investor known for predicting the 2008 financial crisis, has recently issued explicit warnings tied to specific Bitcoin price levels as the market has slid toward the $70,000 area.
In a Substack post, Burry described the decline below this threshold as a trigger for what he calls “sickening scenarios,” where deeper losses could tighten financing conditions for large corporate holders and drive forced selling across markets.
In Burry’s view, a drop below $70,000 could inflict multi-billion-dollar unrealized losses on firms heavily exposed to Bitcoin and potentially constrain their access to capital.
He also highlighted that if Bitcoin continues sliding toward $60,000, the risk to firms, miners, and wider market structures becomes more acute, and further declines, such as toward $50,000, could strain related markets like tokenized precious metals and miner solvency. Burry has emphasized that Bitcoin’s behavior during this sell-off, failing to act as a hedge while erasing post-peak gains — reflects its speculative nature and exposes vulnerabilities in corporate balance sheets and risk management.
Scenario Analysis: Plausible 2026 Downside Outcomes
According to ChatGPT, Bitcoin’s 2026 downside spans three broad outcomes: a normal post-peak bear market (60–70% drawdown) driven by gradual deleveraging, an extended risk-off phase (70–77%) caused by prolonged liquidity withdrawal, or a low-probability systemic shock (85–90%) marked by forced selling.
The key difference across scenarios is not whether price falls, but whether selling is orderly, prolonged, or mechanically forced by macro stress.
Scenario 1: Normal Post-Peak Bear Market
Estimated downside range: approximately 60–70% from the prior peak
In this environment, speculative leverage unwinds over months rather than days. Price declines occur in waves as traders exit, long-term holders become inactive, and interest fades. This mirrors the behavior seen after previous euphoric phases, where the market does not panic indefinitely but grinds lower.
In such conditions, Bitcoin historically finds support well above catastrophic levels. Prices stabilize when sellers are exhausted, not when confidence is high. This type of bear market is uncomfortable but structurally normal.
Scenario 2: Extended Risk-Off and Liquidity Tightening
Estimated downside range: approximately 70–77% from the prior peak
This scenario requires more than routine cooling. It emerges when tight financial conditions persist and multiple rounds of deleveraging occur. The defining characteristic is duration rather than violence.
Historically, this type of decline unfolded slowly, with repeated breakdowns after temporary relief rallies. Market participants assume the worst is over, only for selling pressure to resume. These environments tend to push Bitcoin toward historically significant accumulation zones formed in prior cycles.
This outcome does not require a failure of Bitcoin itself, only prolonged risk aversion and capital withdrawal.
Scenario 3: Severe Systemic Shock
Estimated downside range: approximately 85–90% from the prior peak
This represents tail risk rather than baseline expectation. Historically, drawdowns of this magnitude coincided with:
- Forced liquidation dominating price discovery
- Structural failures in market plumbing
- Extreme macroeconomic stress
In such conditions, price becomes disconnected from long-term value. Selling occurs because participants must sell, not because they choose to. Bitcoin has experienced this behavior before, but such events are rare and typically short-lived relative to the broader cycle.
BTC Technical Analysis: Bitcoin’s Weekly Chart Is Echoing the 2022 Bear Market Structure
Bitcoin’s current weekly structure is starting to echo several features of the 2022 bear market, especially in how the price is reacting after a major macro peak.
In 2022, BTC topped out near $69,000 and then lost its 50-week EMA, triggering a prolonged downtrend marked by lower highs, failed relief rallies, and accelerating downside momentum.
On the chart now, a similar sequence is unfolding after the rejection from the $120,000 region, with price breaking back below the 50-week EMA.
The pullback’s magnitude is also comparable in structure, even though the absolute prices differ.
During the 2022 bear market, Bitcoin’s price dropped roughly 70% from peak to trough, eventually finding a bottom near the 0.236–0.382 Fibonacci region of the prior cycle.
In the current move, BTC has already declined more than 40% from the recent high, slicing through the 0.786 level and now trading close to the 0.5 retracement.
This mirrors the early-to-mid stages of 2022, when many participants still expected a quick recovery. Unfortunately, the price instead continued to grind lower.
Momentum confirms the comparison. In 2022, the weekly MACD rolled over aggressively and remained negative for months, with brief bullish crossovers quickly failing.
The current MACD is again negative, with no sign of bullish divergence yet. That suggests downside pressure remains dominant. Therefore, any minor bounce is likely to be corrective.
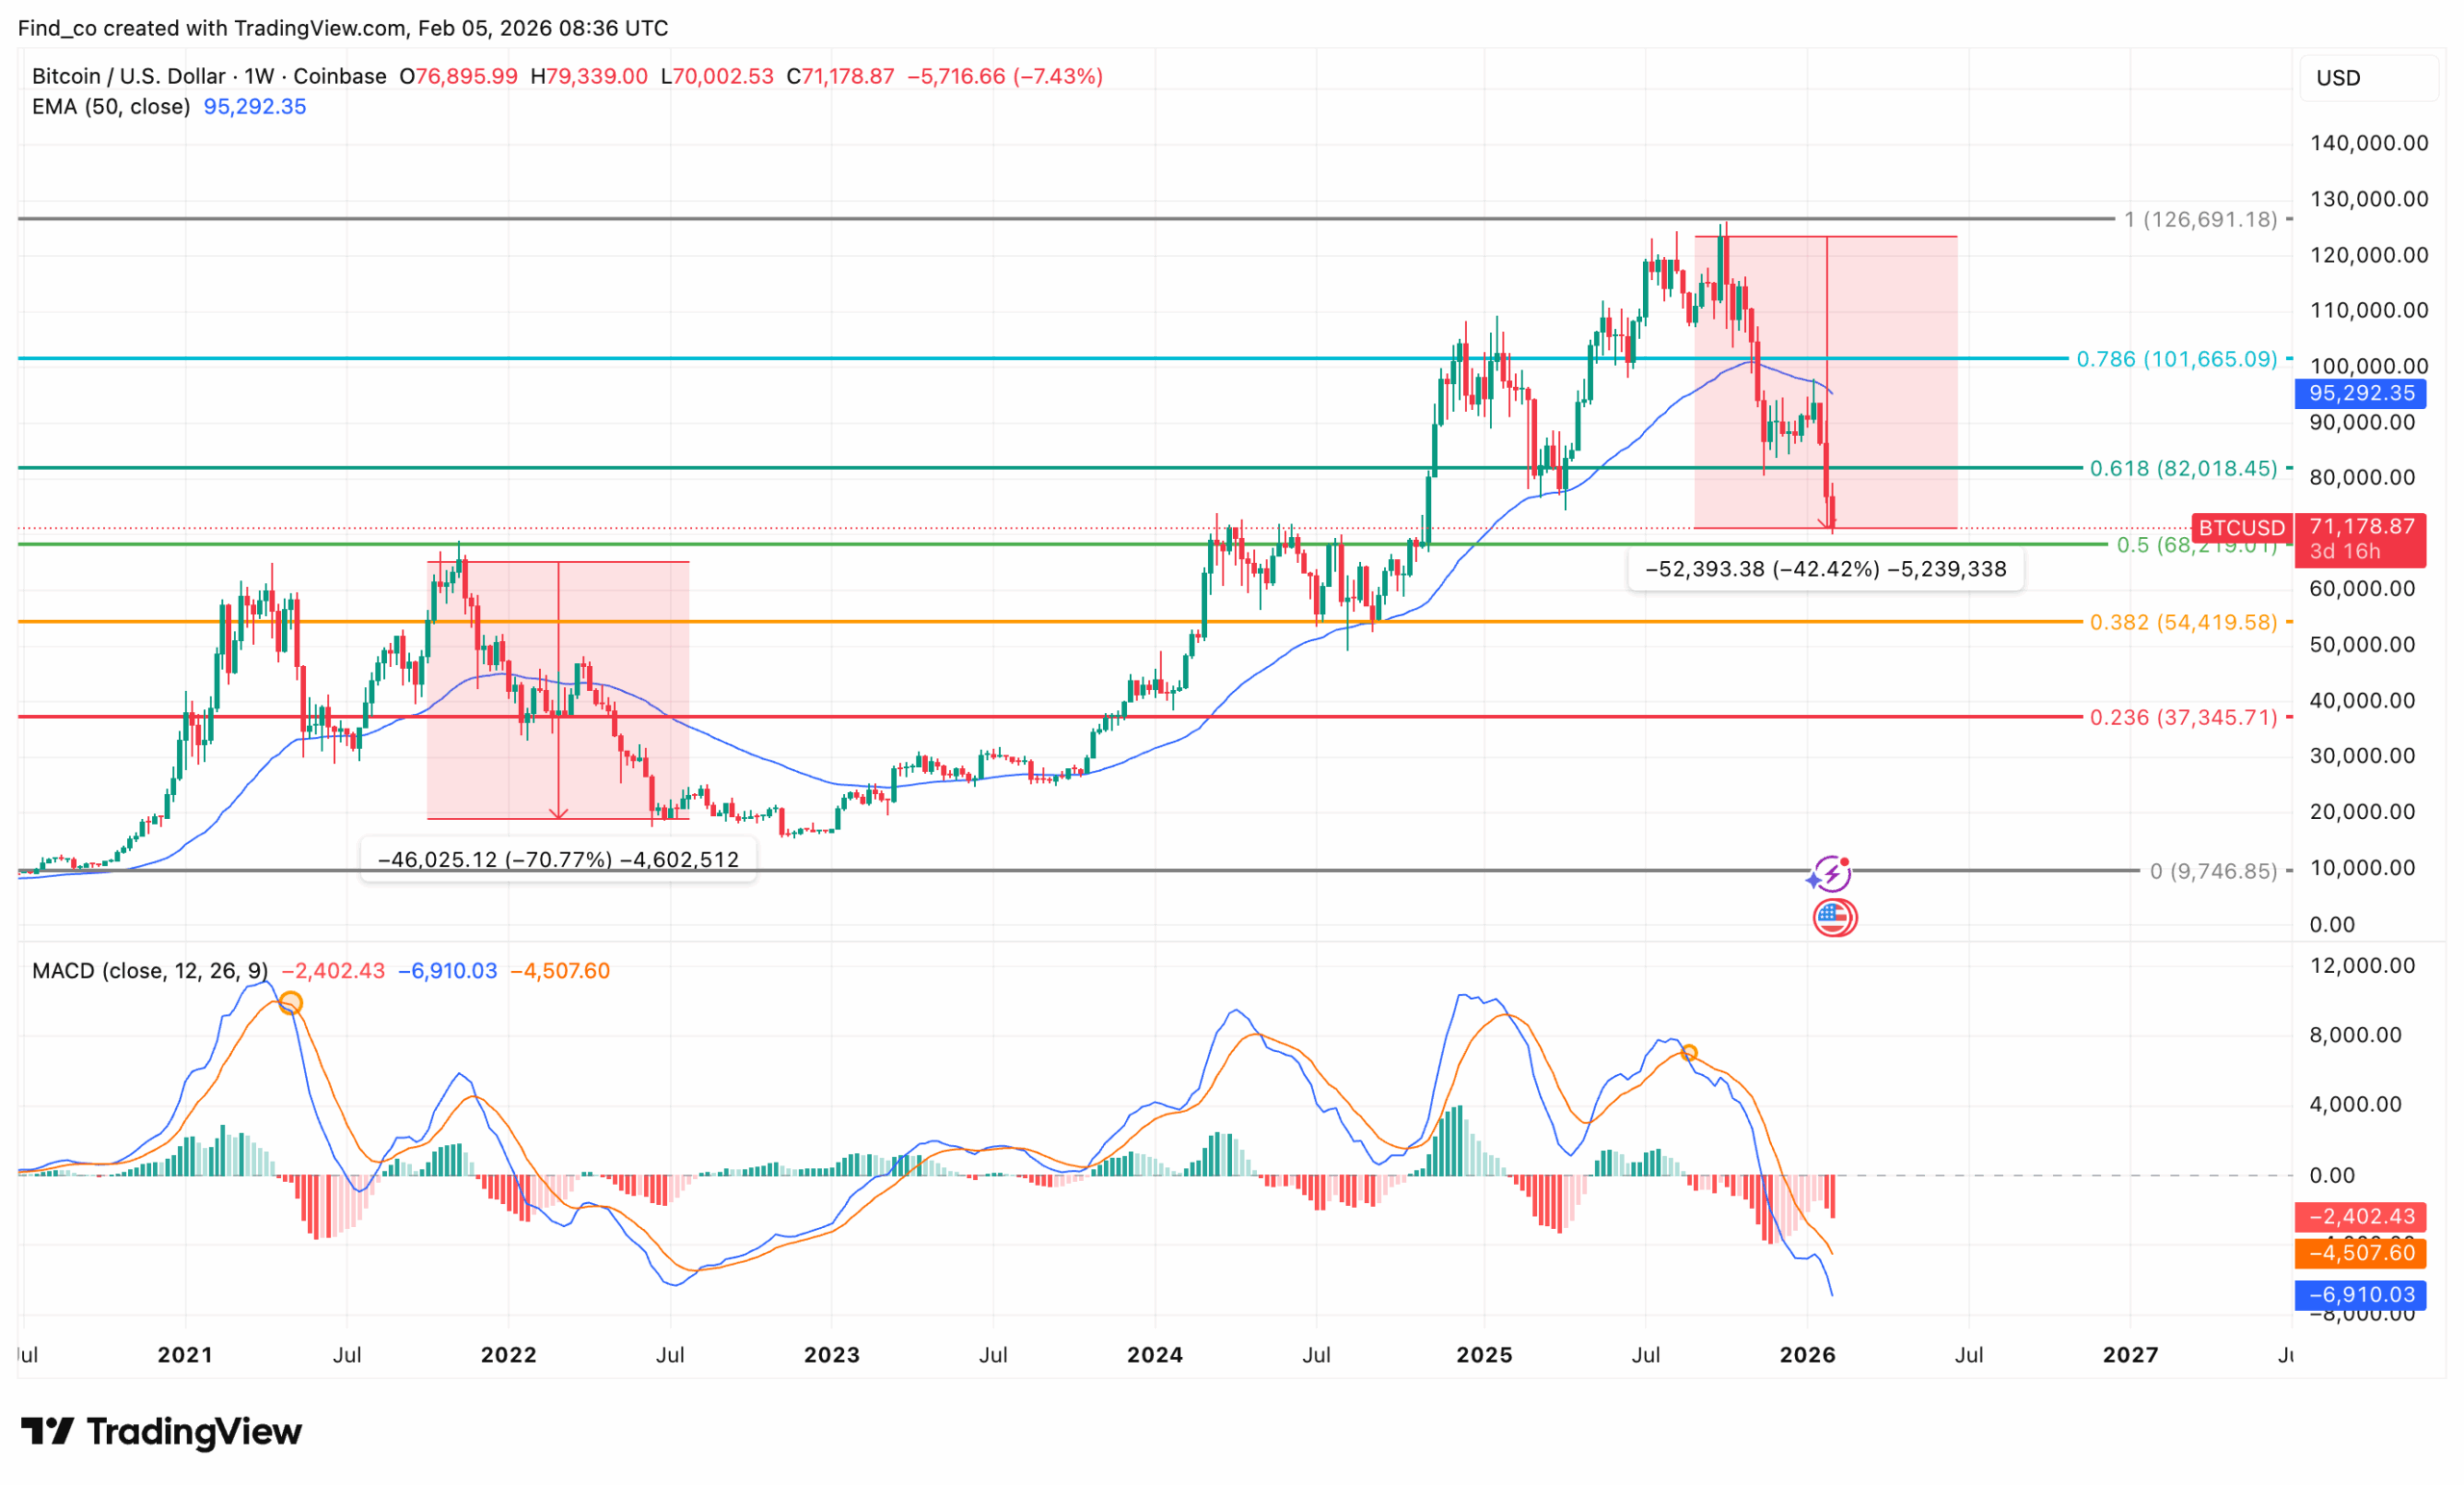
BTC/USD Weekly Chart | Credit: Victor Olanrewaju via TradingView
Where this cycle could differ is in how and where Bitcoin’s price finds support.
If BTC follows a similar path to 2022, a deeper move toward the 0.382 Fibonacci level near $54,419 becomes plausible.
On the other hand, if this cycle proves structurally stronger than 2022, the $68,219 region could act as a higher-low demand zone.
Holding this area and reclaiming the 50-week EMA would be the key signal that this is a deep correction within a larger bull structure rather than a full bear-market reset.
Why Extremely Low Numbers Are Increasingly Difficult to Sustain
Arguments that Bitcoin can easily return to early-cycle price levels ignore several structural realities:
- A large share of supply is held by long-term holders with no incentive to sell at extreme discounts.
- Industrial-scale mining imposes economic constraints that did not exist in early years.
- Broader awareness reduces the probability of prolonged abandonment.
While short-lived price wicks below perceived value remain possible, sustained pricing at extreme lows requires conditions far more severe than routine bear markets.
The Role of Psychology in Setting Market Bottoms
According to ChatGPT, Bitcoin bottoms have never been formed by mathematical models alone. They occur when:
- Public interest disappears
- Volatility compresses
- Market participants stop debating price targets altogether
This psychological exhaustion phase tends to create durable floors. Historically, it has produced consolidation zones rather than freefalls, even after brutal declines.
Probability-Weighted Insight on Bitcoin Price
Based on historical drawdowns, cycle positioning, and observable market structure, the most defensible downside ranges for Bitcoin in 2026 are:
- Moderate bear market: prices stabilize after a 60–70% decline from the prior peak
- Severe but historically consistent bear market: prices approach the 70–77% drawdown zone
- Extreme tail risk: prices briefly reach 85–90% drawdowns only under systemic stress
The central insight is not a single number, but a rule:
Bitcoin’s downside is determined by liquidity and leverage, not belief.
So… How Low Can Bitcoin Go in 2026?
Based on historical drawdowns, current market structure, probability-weighted analysis generated by ChatGPT, and views commonly expressed by real-world analysts, Bitcoin’s 2026 downside clusters into three realistic price zones, not one extreme outcome:
- $45,000–$60,000 in a normal post-peak bear market where leverage unwinds gradually and selling pressure fades over time.
- $30,000–$45,000 in an extended risk-off environment marked by prolonged liquidity tightening and repeated failed recoveries.
- $15,000–$30,000 only under a severe systemic shock involving forced liquidations, macro stress, or structural market failures.
These ranges assume Bitcoin peaked in the low six-figure area during the prior cycle. The key distinction is not whether price declines, but how it declines – orderly cooling, prolonged exhaustion, or mechanically forced selling.
FAQs
In theory, any asset without intrinsic cash flows could approach zero; however, historically, Bitcoin’s price has never permanently collapsed. Sustained prices near zero would require a total loss of network trust or systemic failure, which has not occurred in prior cycles.
Bitcoin’s declines have historically been proportional to how far the price moved during speculative expansions. Bear-market lows tend to form as a percentage retracement from prior highs, not at arbitrary price levels.
Institutional involvement can reduce volatility and improve liquidity, but it does not eliminate downside risk. Institutions also reduce exposure during risk-off periods, which can contribute to prolonged declines.
Historically, major consolidation and drawdown phases have lasted between one and two years. Prices often stabilize only after leverage is cleared and market interest wanes.
The information provided in this article is for informational purposes only. It is not intended to be, nor should it be construed as, financial advice. We do not make any warranties regarding the completeness, reliability, or accuracy of this information. All investments involve risk, and past performance does not guarantee future results. We recommend consulting a financial advisor before making any investment decisions.

Giuseppe Ciccomascolo began his career as an investigative journalist in Italy, where he contributed to both local and national newspapers, focusing on various financial sectors.
Upon relocating to London, he worked as an analyst for Fitch's CapitalStructure and later as a Senior Reporter for Alliance News. In 2017, Giuseppe transitioned to covering cryptocurrency-related news, producing documentaries and articles on Bitcoin and other emerging digital currencies. He also played a pivotal role in establishing the academy for a cryptocurrency exchange website. Crypto remained his primary area of interest throughout his tenure as a writer for ThirdFloor.

Victor Olanrewaju is a crypto analyst and reporter at CCN with deep roots in on-chain research and technical analysis. His crypto journey began in 2017, but it was the 2020 Uniswap airdrop that sparked a full-time pivot into the space.
With a foundation in copywriting, Victor honed his craft creating high-converting content for leading crypto brokers — most notably an XRP price prediction that ranked #1 on Google during the 2021 bull run.
He later joined AMBCrypto in 2022, where he combined storytelling with technical and on-chain analysis to cover key market narratives.
In 2024, he expanded his expertise at BeInCrypto, collaborating with analysts and using tools like Glassnode, Santiment, and IntoTheBlock to break down Bitcoin and altcoin trends.
At CCN, Victor covers the top cryptocurrencies, memecoins, macro shifts, blending real-time insights with deep-dive metrics.
He holds a Bachelor’s degree in Physics from the University of Ibadan, equipping him to simplify complex data for a wide audience. Follow his work or connect on LinkedIn or X.


 Easy
Easy 


