The view that MSTR underperforms Bitcoin is a product of investor biases and a disregard for longer-term performance metrics.
Underperformance episodes stem from three structural factors: dilution through capital issuance, competitive capital dispersion, and convertible arbitrage pressure.
The Ballistic Acceleration Model fails as a forecasting tool, while a power law framework offers a more stable and theoretically grounded explanation of MSTR’s long-term trajectory.
Strategy’s (formerly MicroStrategy) transition from a traditional enterprise software company to a Bitcoin-centric vehicle has reshaped the way its equity is understood, traded, and valued. Since August 2020, when the company began allocating its treasury to Bitcoin (BTC), MSTR has become one of the most discussed equities among investors. It is viewed as a leveraged proxy for Bitcoin, yet there remains persistent confusion and controversy around its price behavior relative to BTC.
A common narrative within investor communities on Reddit, X, and Discord is that MSTR “lags” Bitcoin. The perception has gained traction, especially in 2025, when Bitcoin continued setting new all-time highs. It reached fresh peaks in January, May, and July, and most recently on August 14, 2025, when it hit $124,277.5. Strategy’s latest high, however, was on November 21, 2024, at $543 per share.
In light of this, a Ballistic Acceleration Model was developed at the end of 2024 by Marty Kendall, which has gained popularity among retail investors as a form of explanatory reassurance for Strategy’s price behavior. Rather than accepting MSTR’s divergence from Bitcoin as a natural consequence of volatility, leverage, or market structure, many investors turn to the model to calm the growing fear that their investment in Strategy has failed. For some, it offers hope that they can still make money on their MSTR position. For others, especially those who bought near prior MSTR peaks above $500 in November 2024, it represents a chance to eventually break even.
This CCN Report examines the growing belief that MSTR consistently underperforms Bitcoin, what fuels that perception, and how its price behavior actually unfolds. The report also assesses the Ballistic Acceleration Model and offers an alternative based on the power law.
Retail Investor Surge: COVID-19 to 2024
Before examining the disconnect between Strategy’s performance and market expectations, it is necessary to understand the environment that shaped this sentiment: the global retail investor boom.
The onset of the COVID-19 pandemic triggered a surge in retail investor participation across global markets. According to market reports from Crypto.com, global cryptocurrency ownership tripled in 2021, rising from about 100 million to over 300 million individuals in just twelve months. By contrast, growth from 2022 to 2024 was more subdued; still, ownership roughly doubled in three years.
Figure 1: Total Number of Crypto Owners | Credit: Crypto.com, Toghrul Aliyev (@itsToghrul)
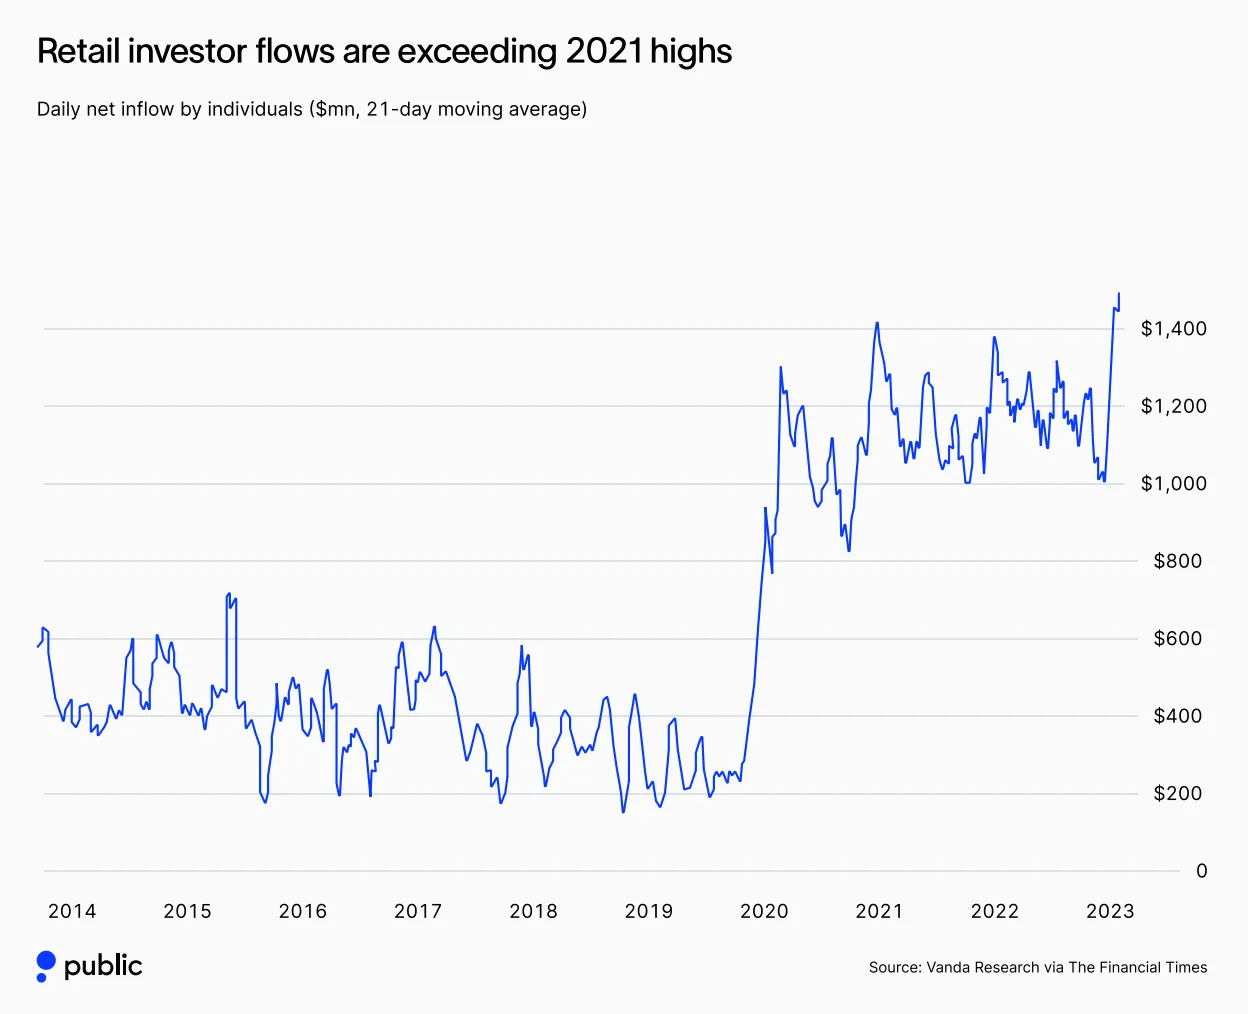
In addition, retail flow data from Vanda Research, an independent research firm, shows that daily net inflows from retail investors, which averaged $300–400 million before the pandemic, jumped to over $1.4 billion per day at the 2023 peak.
At the same time, data tracked by JPMorgan indicated that in January 2023, retail investors accounted for nearly a quarter of all U.S. stock trading, the highest share on record.
The rise in retail investors and flows comes from a combination of factors.
In 2020, governments introduced large-scale fiscal programs, including direct stimulus payments and expanded unemployment benefits, that injected liquidity into households worldwide. The most significant measures came from the United States, but similar programs were also enacted in Canada, Hong Kong, and other economies. Lockdowns added to the effect by creating a surplus of discretionary time.
With more time and capital available, individuals turned to financial platforms that had already begun lowering barriers to entry.
Brokerage firms and cryptocurrency exchanges simplified onboarding through fractional shares, zero or low commission models, mobile-first interfaces, and almost instant account creation.
At the same time, asset prices across both equities and digital assets delivered extraordinary returns, which drew retail investors in. Many chased gains out of fear of missing out.
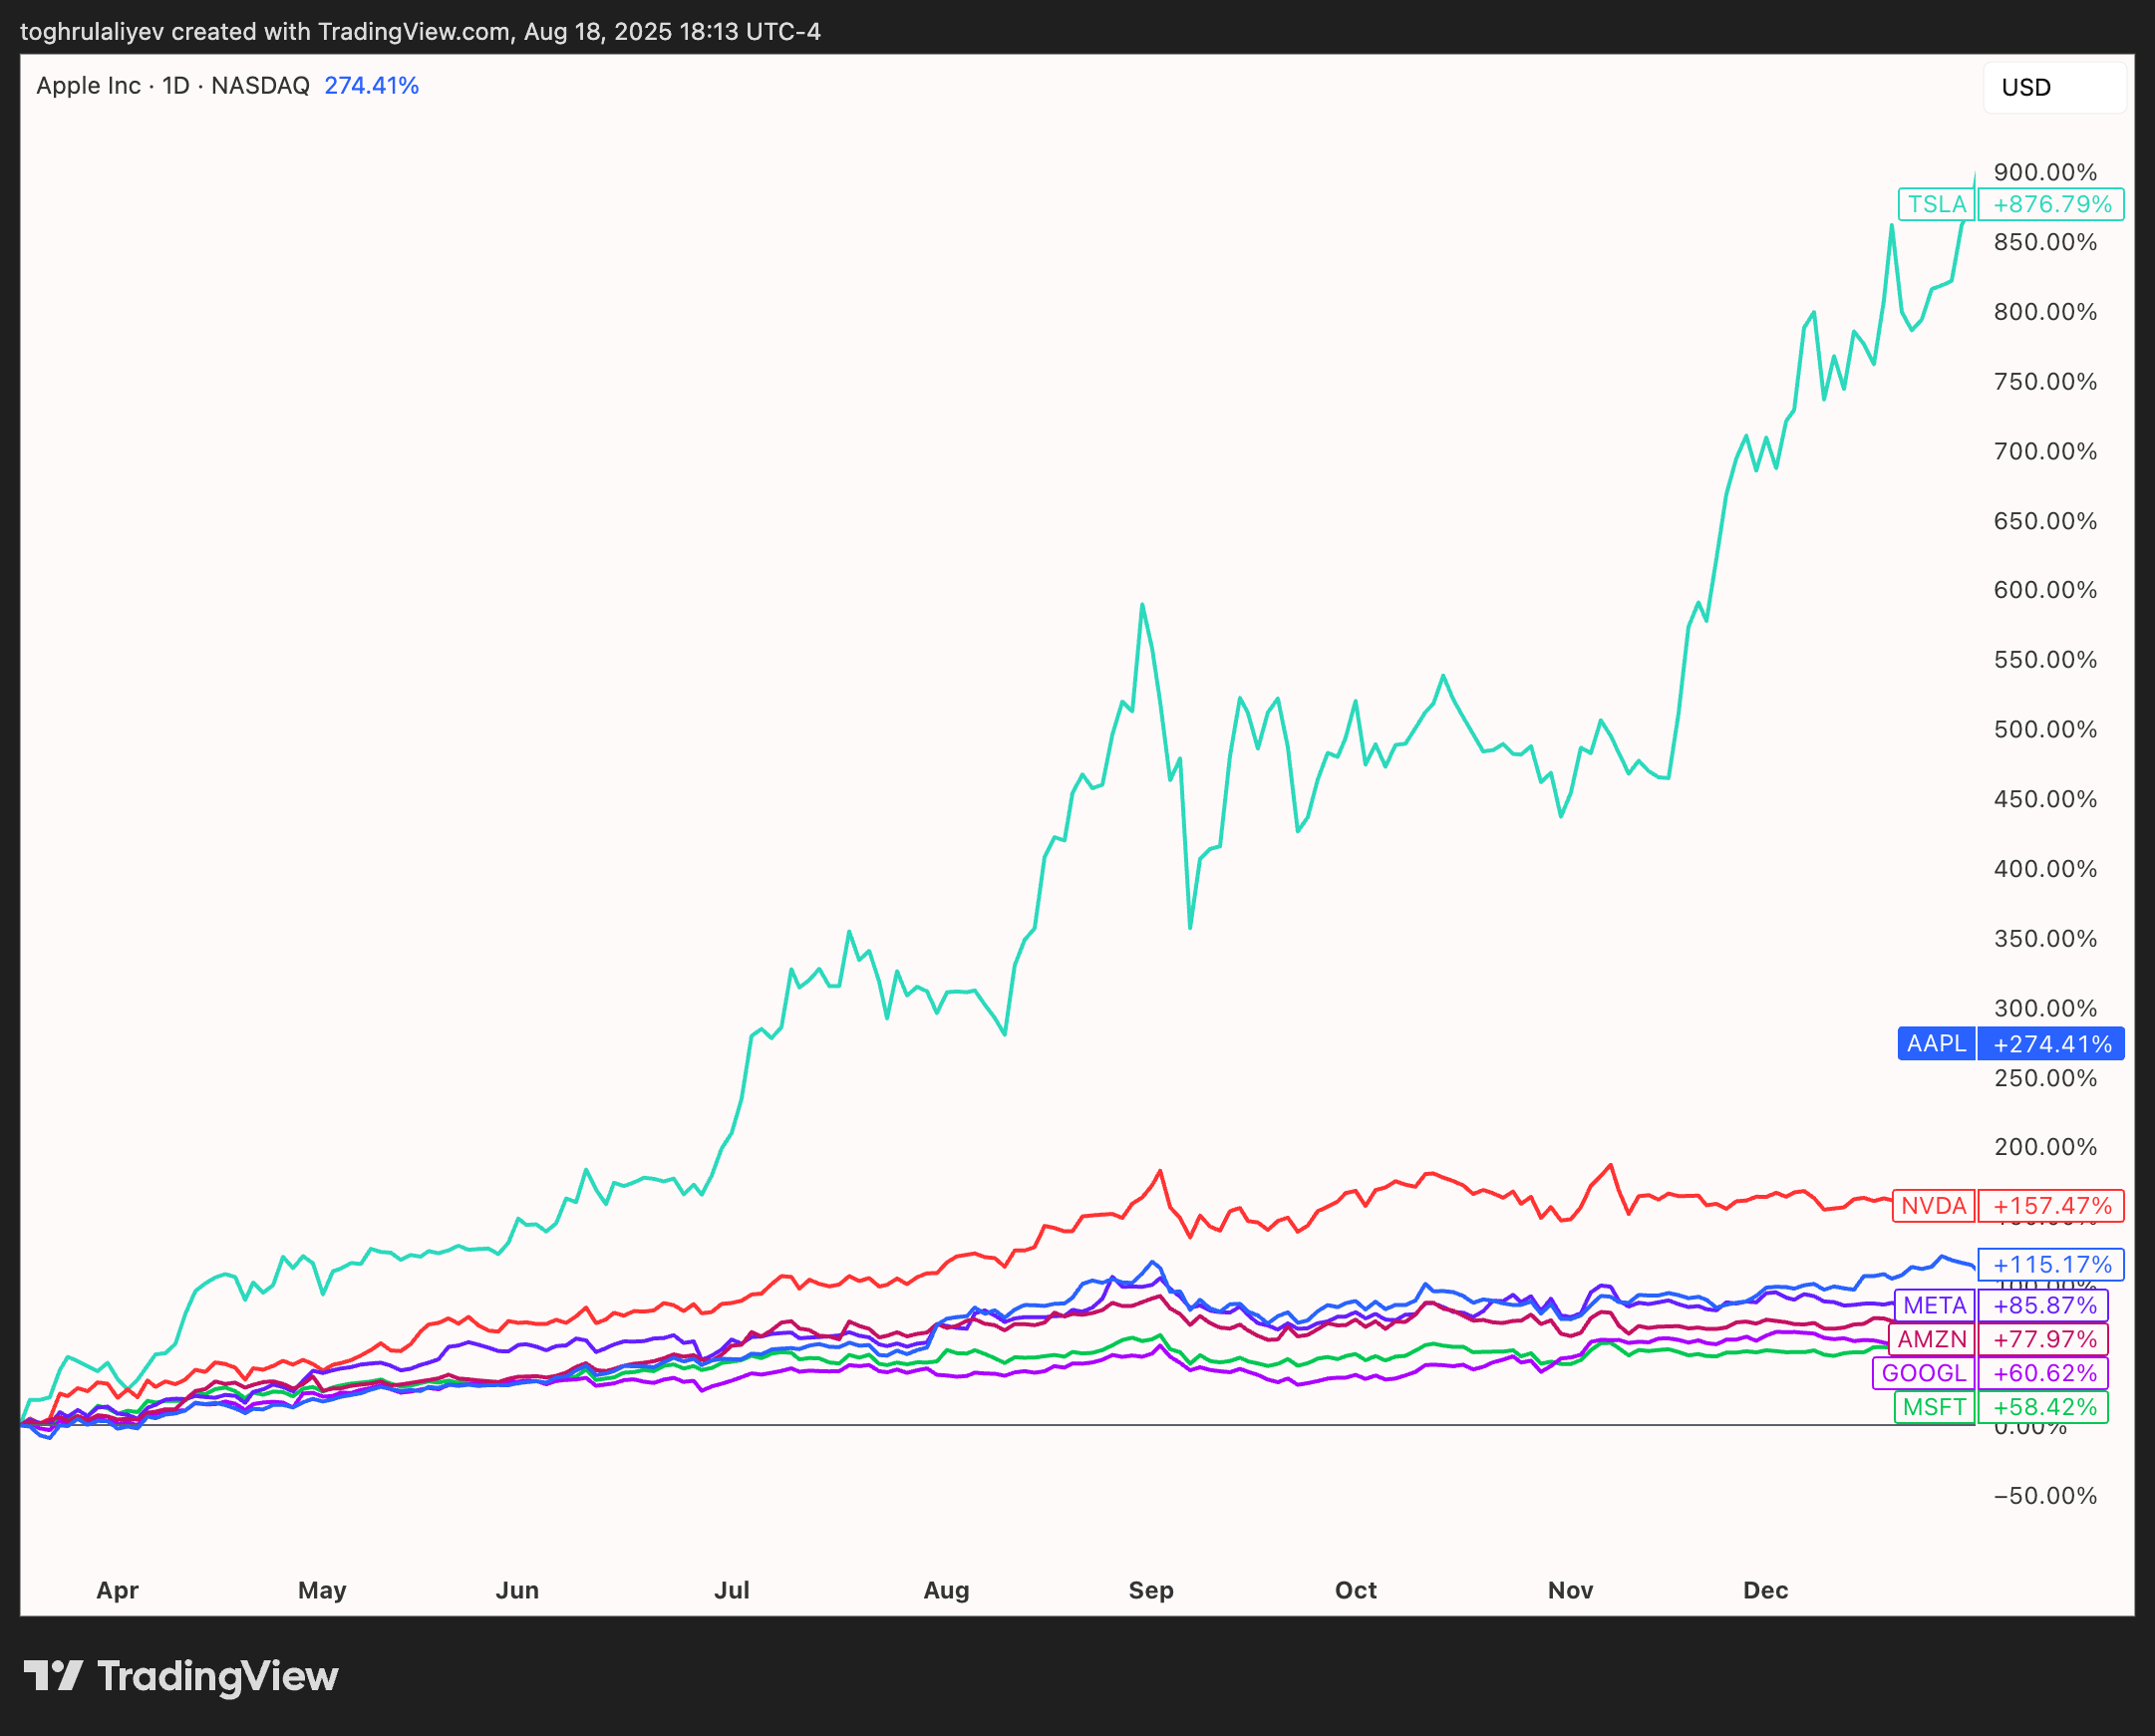
First came the rebound in equities. After the COVID-19 sell-off in March 2020, the Magnificent Seven stocks rallied by 100% or more by year-end.
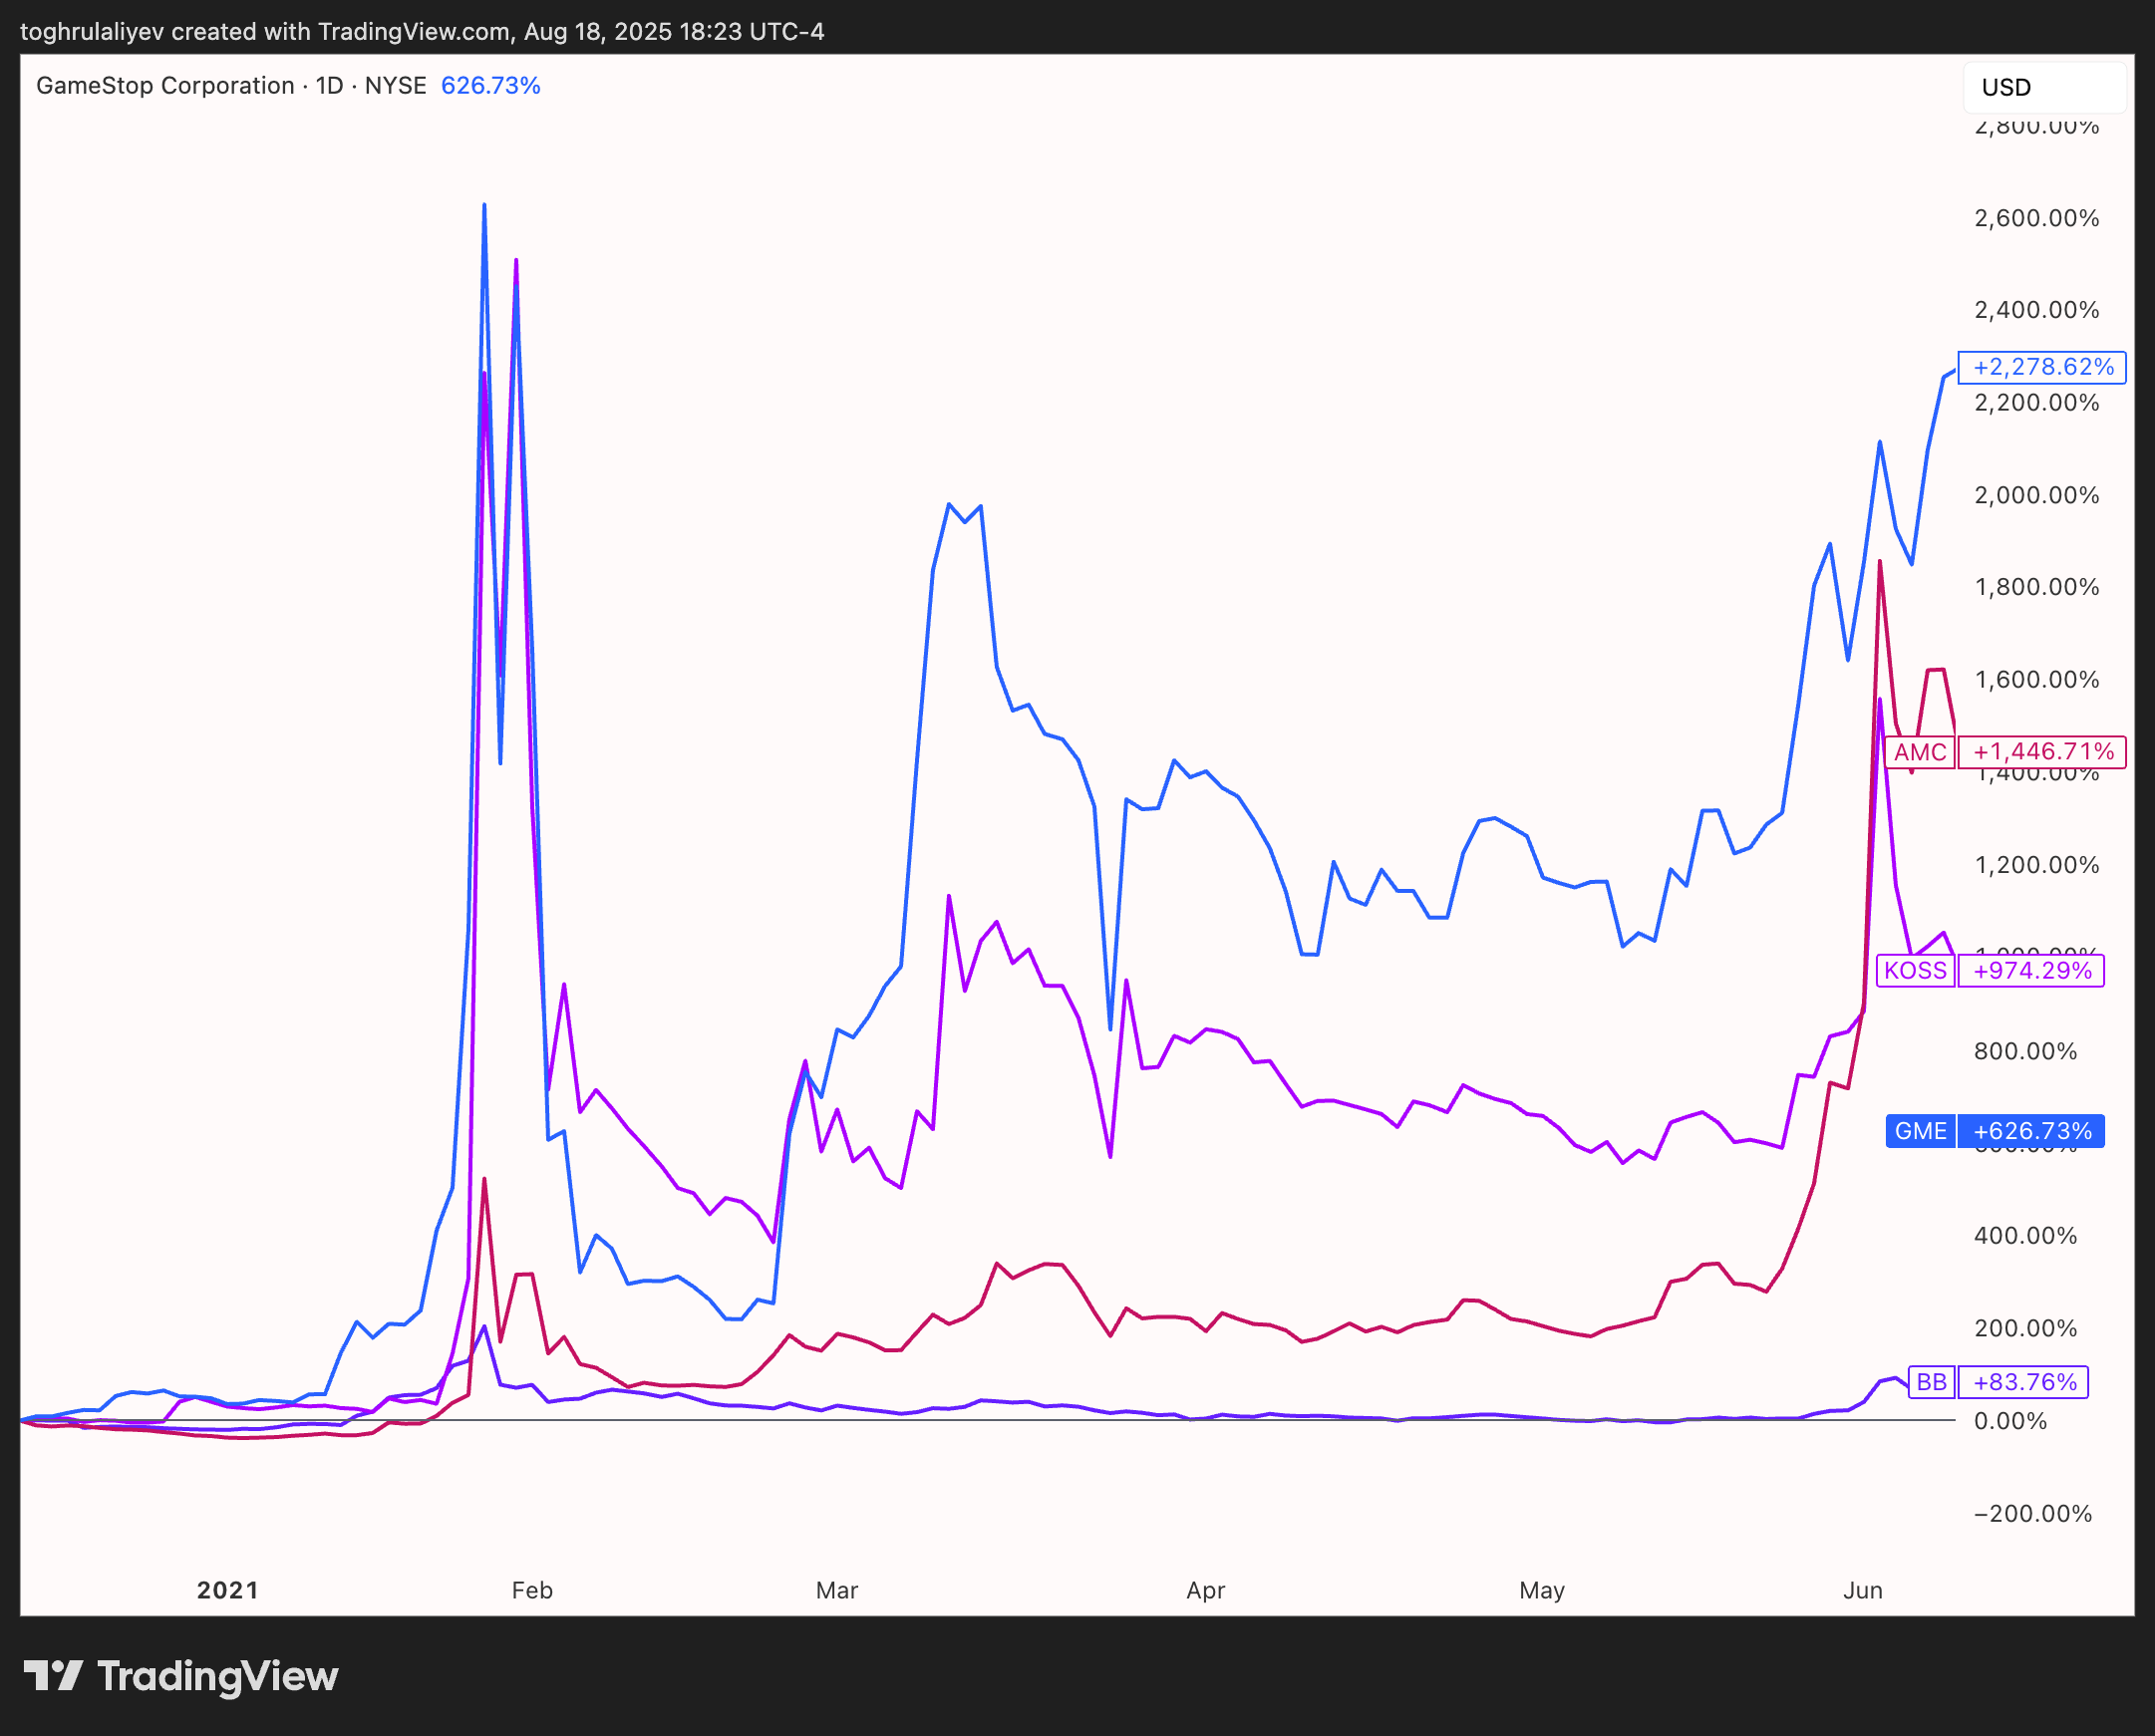
Next came the meme stock mania in early 2021. Share prices of companies like GameStop (GME), AMC Entertainment (AMC), and BlackBerry (BB) increased tenfold or more within the span of a month.
Figure 4: The Rise of Meme Stocks in 2021 | Credit: TradingView, Toghrul Aliyev (@itsToghrul)
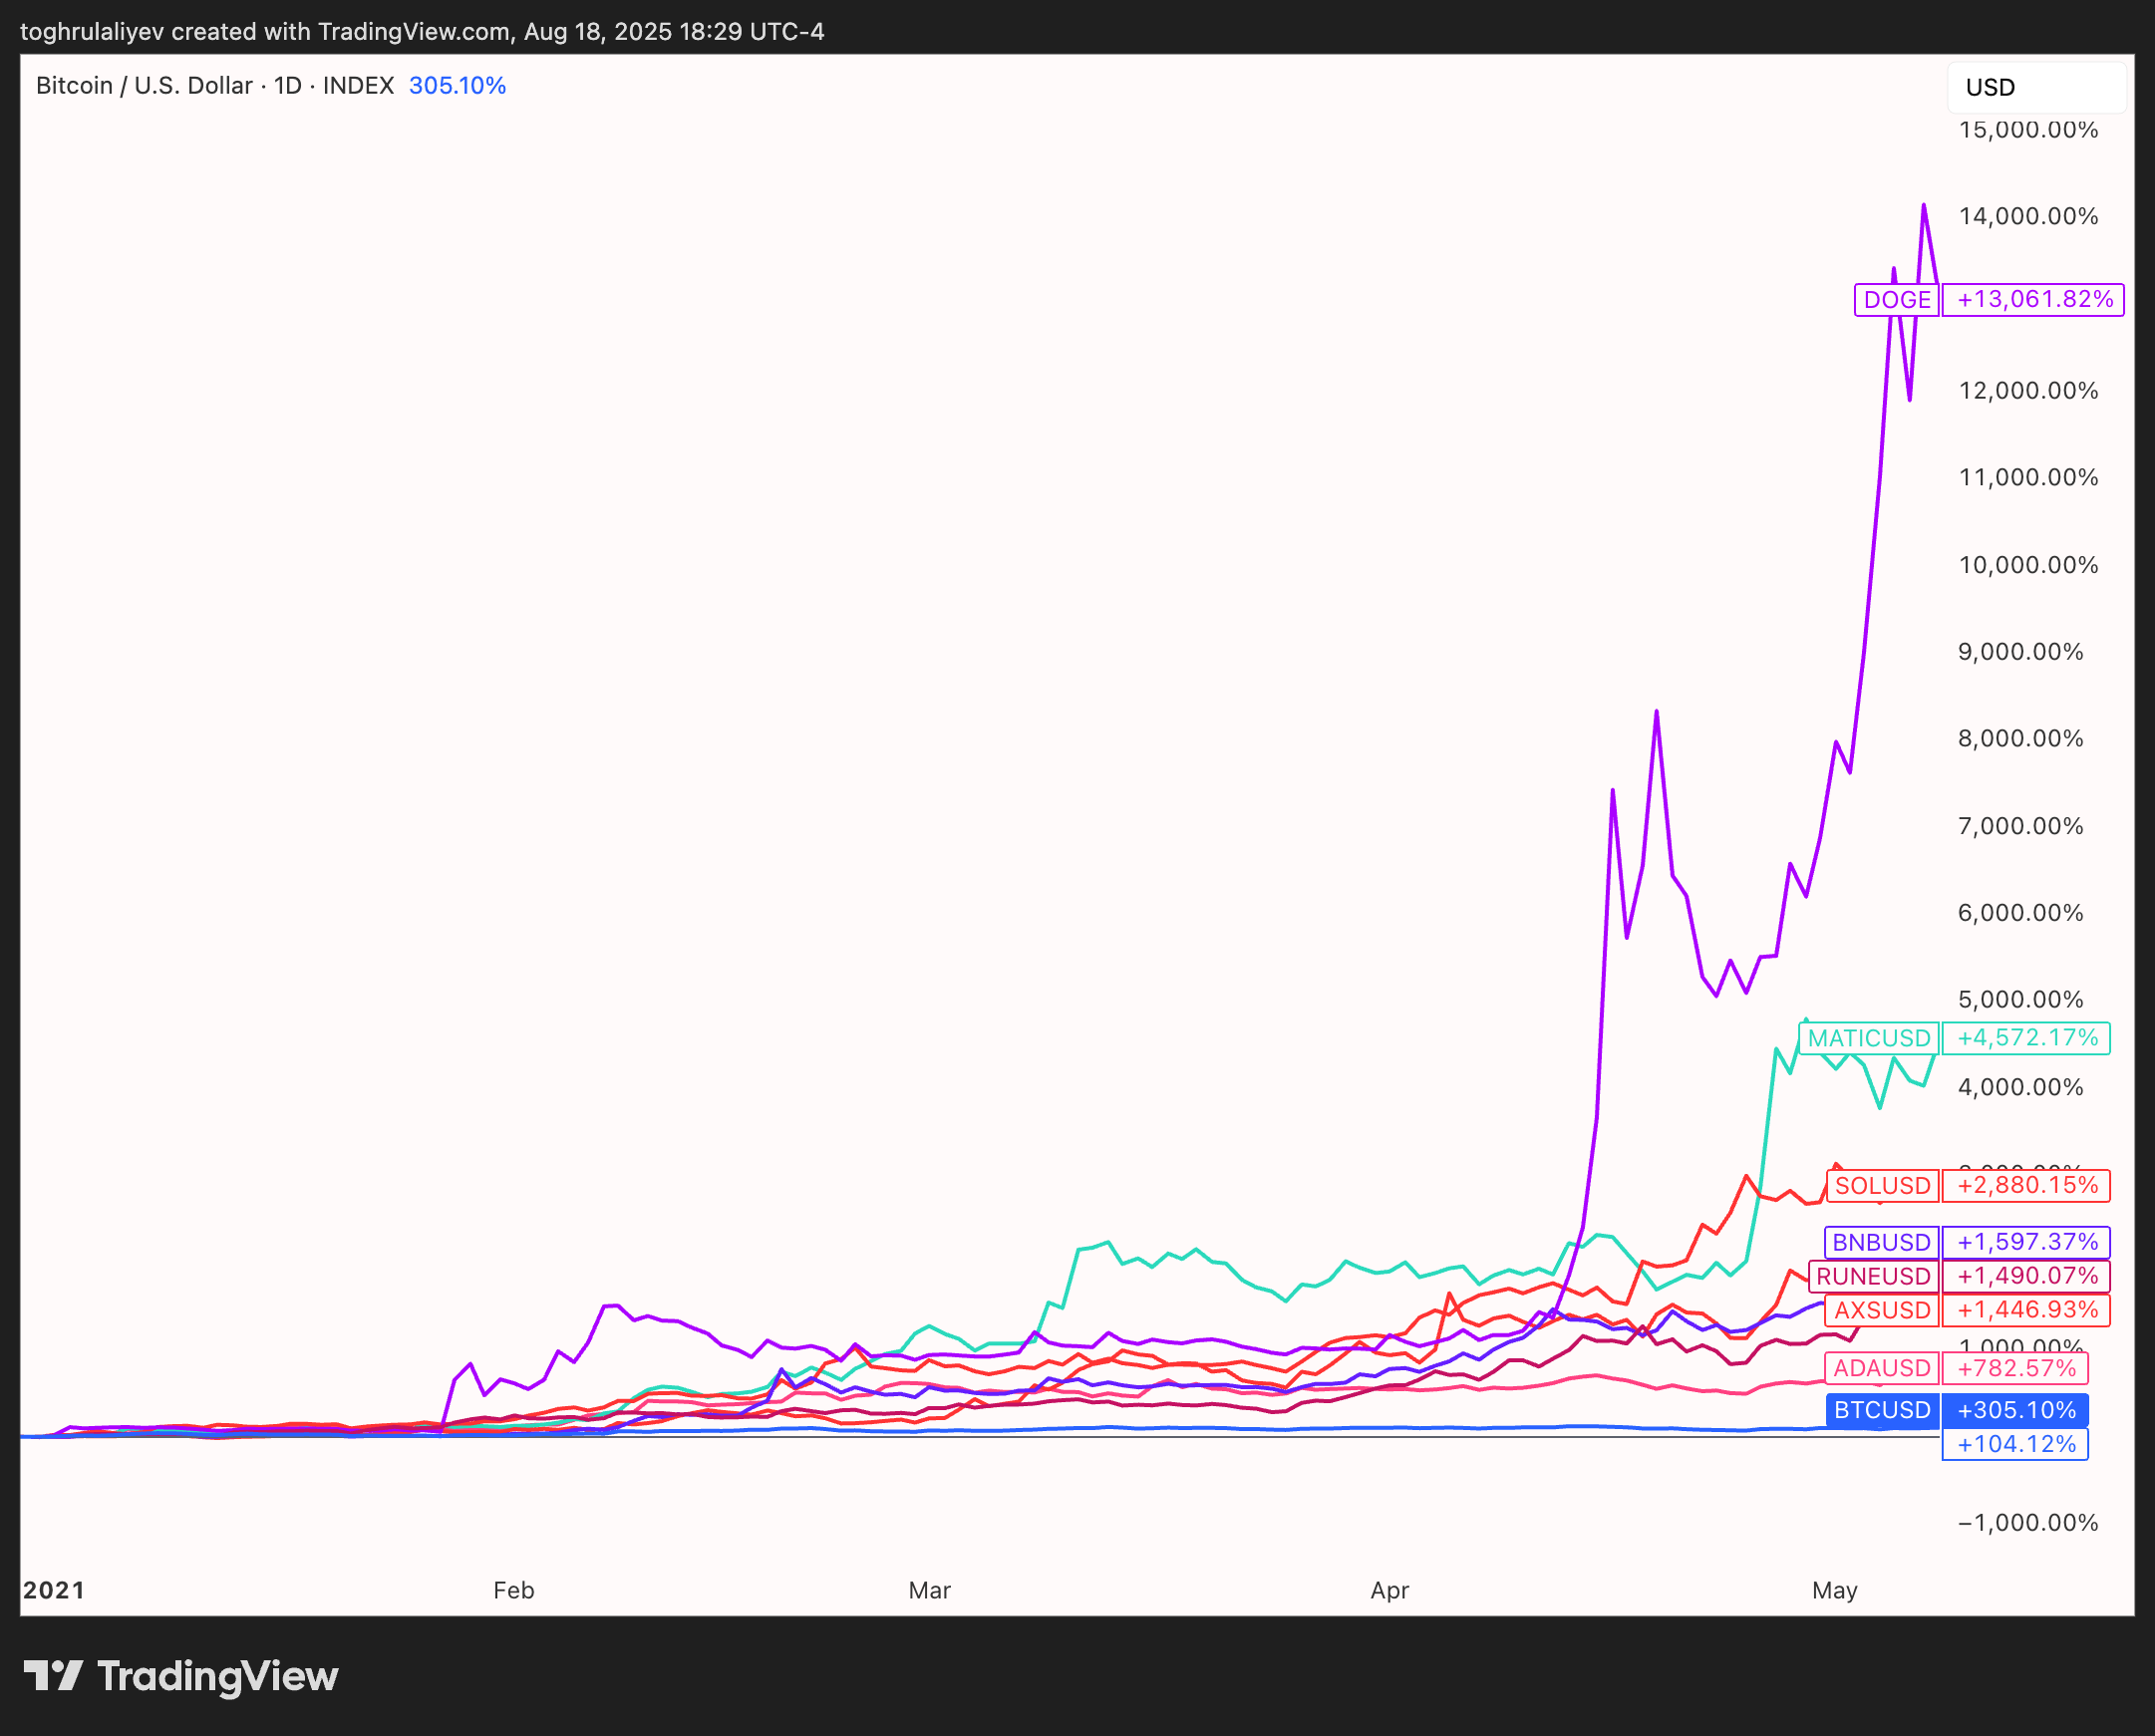
And the last nail was the crypto mania. Bitcoin reached a new all-time high of $68,997.75, and a wide range of altcoins followed with exponential gains, many recording triple- to quadruple-digit returns within a matter of weeks.
Figure 5: The Crypto Bull Market of 2021 | Credit: TradingView, Toghrul Aliyev (@itsToghrul)
All of this brought in a wave of mostly brand-new investors with a risk-on mindset who got everything handed to them on a silver platter. Academic research from Paderborn University confirms that “young and inexperienced traders entered financial markets” during 2020 and were “on average more overconfident than experienced traders.” Similarly, the JPMorgan Chase Institute documented that investors establishing new accounts in 2020 and 2021 consistently took on more risk than those in earlier periods.
With markets rising almost without interruption, every bet looked like a genius move. Every chart went up. New investors entered the markets with sky-high expectations, and, for a while, got exactly what they wanted.
Which is why many retail investors view Strategy through the wrong lens. When you’re used to seeing double-digit returns in days, watching an investment move sideways for weeks feels strange, even when it’s not.
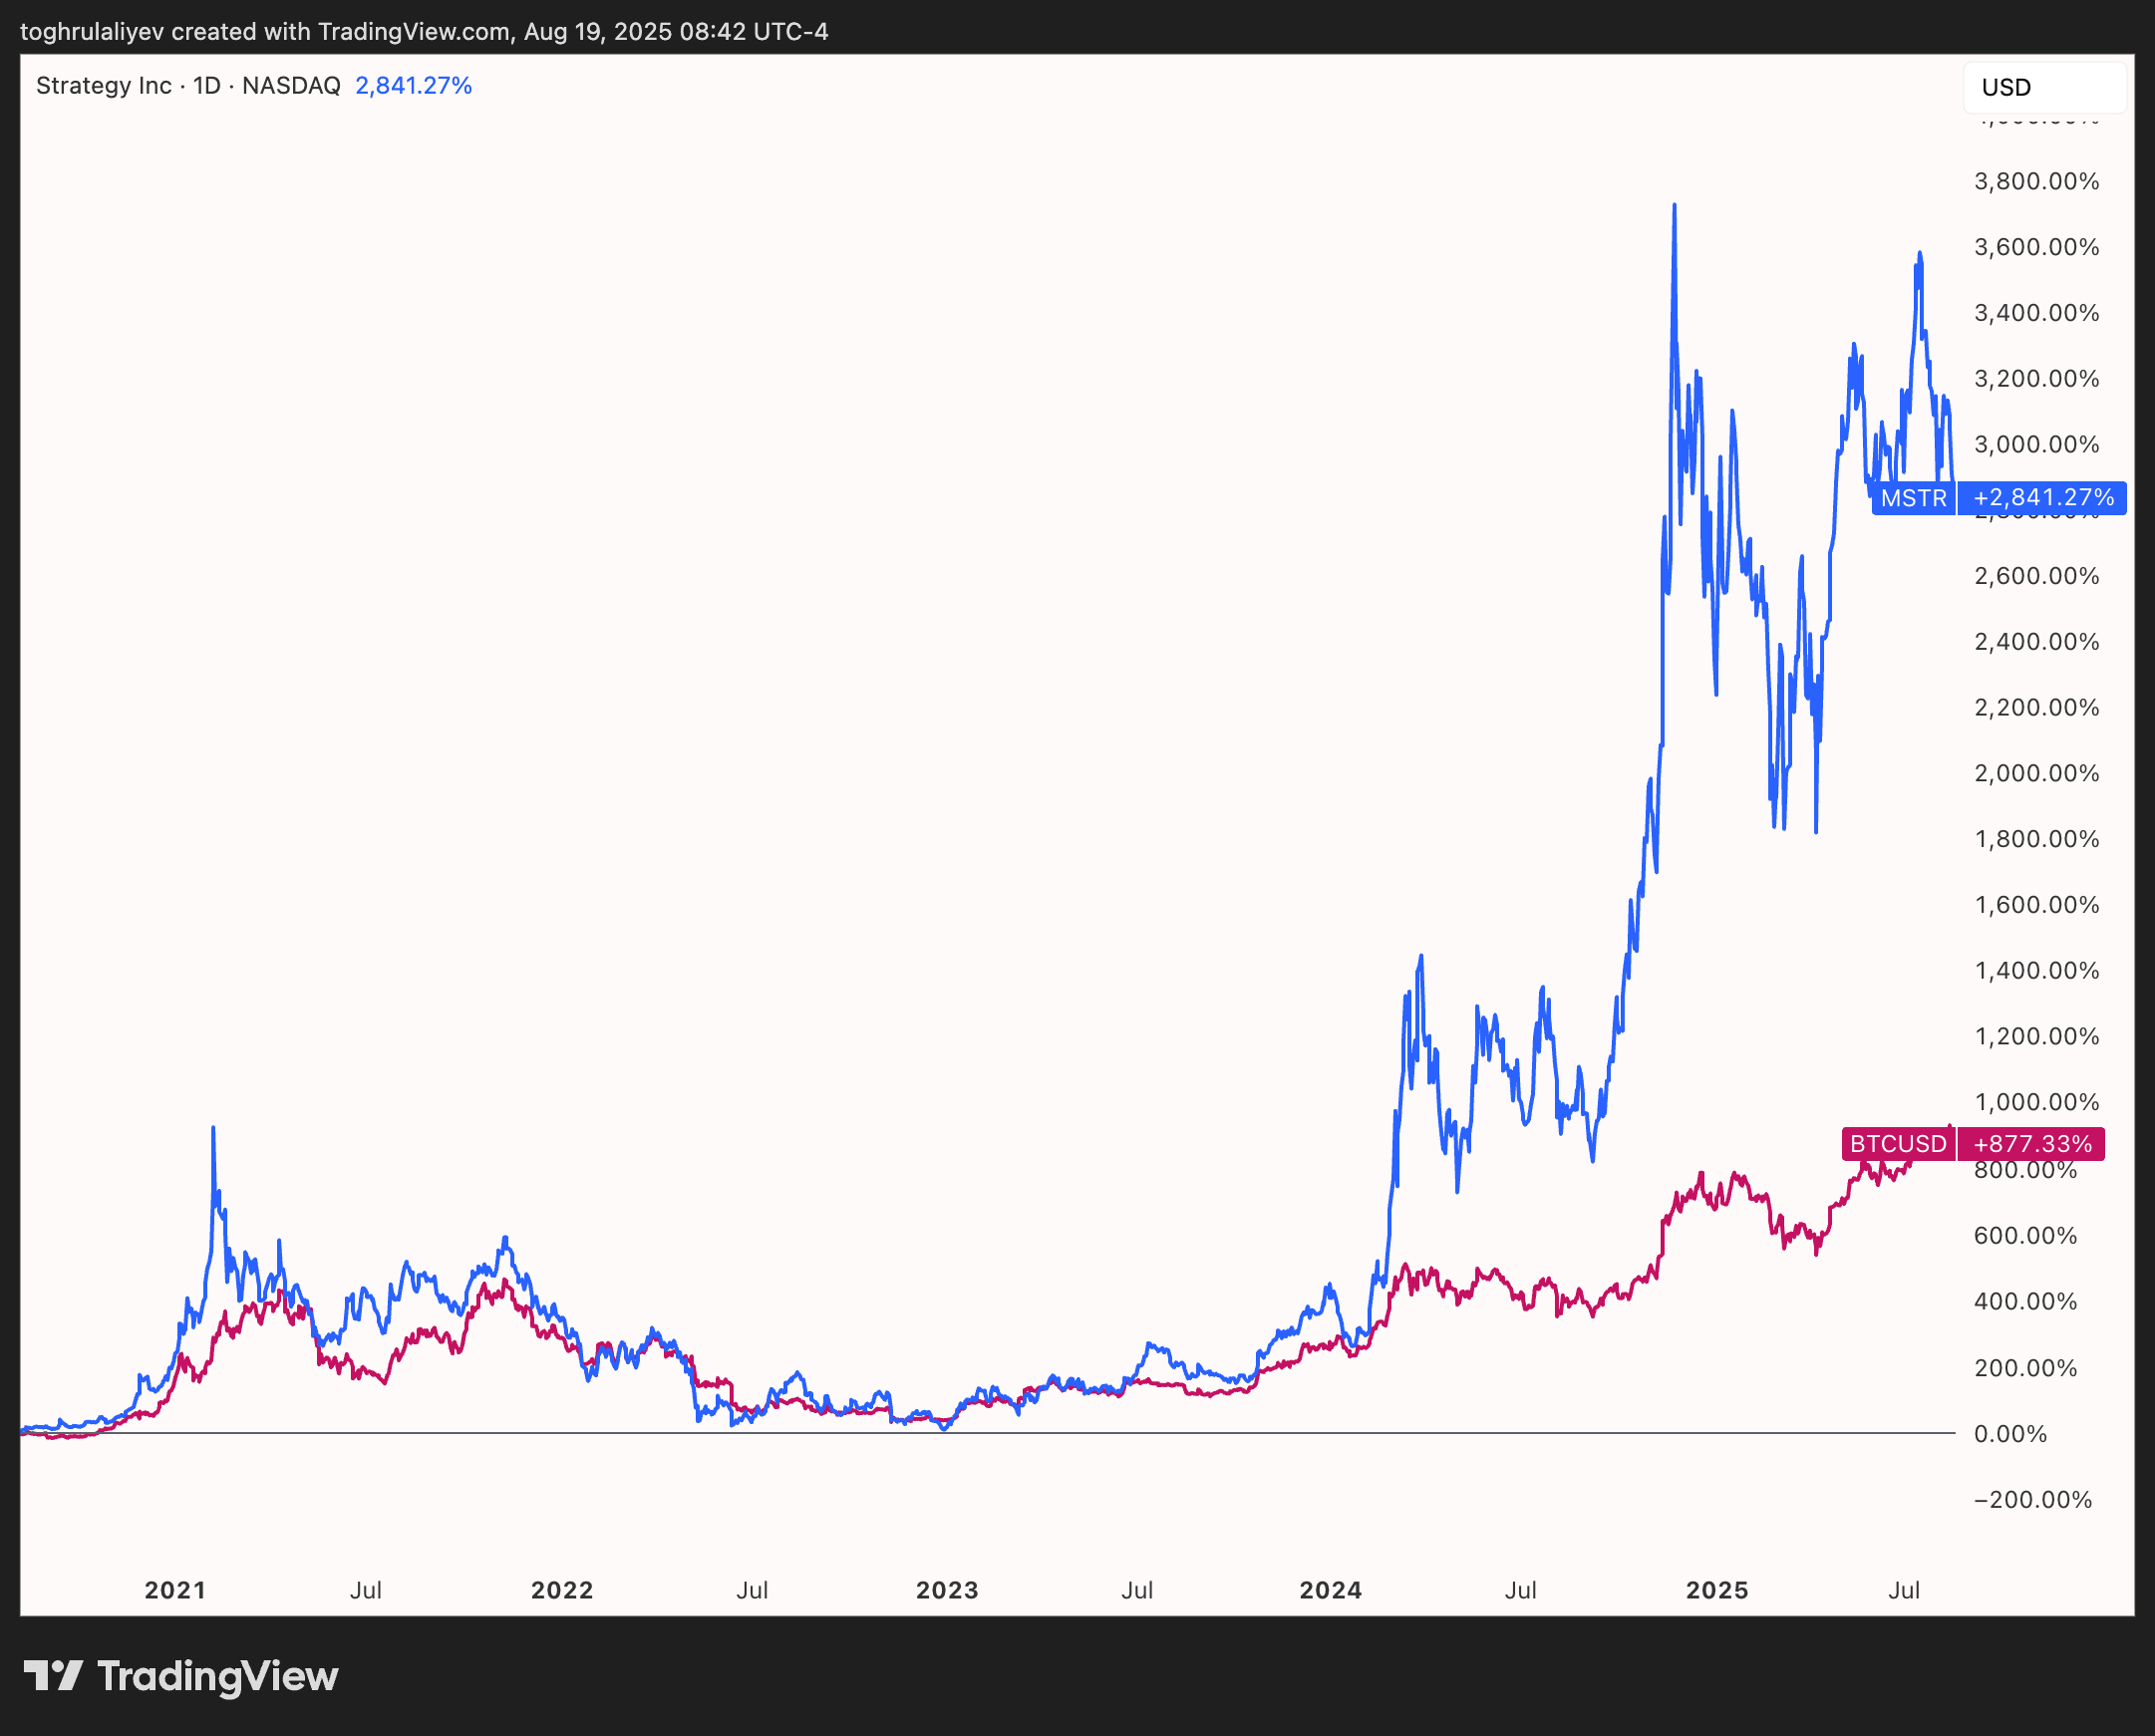
While the perception that MSTR consistently underperforms Bitcoin is largely misguided and highly dependent on the chosen timeframe, it can appear true due to how investors process and interpret market data. At its core, this belief is shaped by psychological biases that heavily influence real-time perceptions of asset performance.
Research demonstrates that behavioral biases and cognitive shortcuts create systematic errors in how investors process and evaluate investment performance in real-time market conditions. Psychological factors mediate the relationship between an investor’s perception of risk and their assessment of portfolio returns. During periods of heightened market volatility, these tendencies are amplified, which increases the likelihood that investors will make decisions based on emotion rather than objective analysis.
Among the most common of these distortions is recency bias, the tendency to overweight recent events and ignore longer horizons.
For example, when looking at the ATH perspective, Bitcoin set new records throughout 2025 — in January, May, and July, and most recently on August 14, 2025, when it reached $124,277.5. On the other hand, Strategy reached its last peak in November 2024, at $543 per share, but hasn’t touched those levels again, even after eight months.
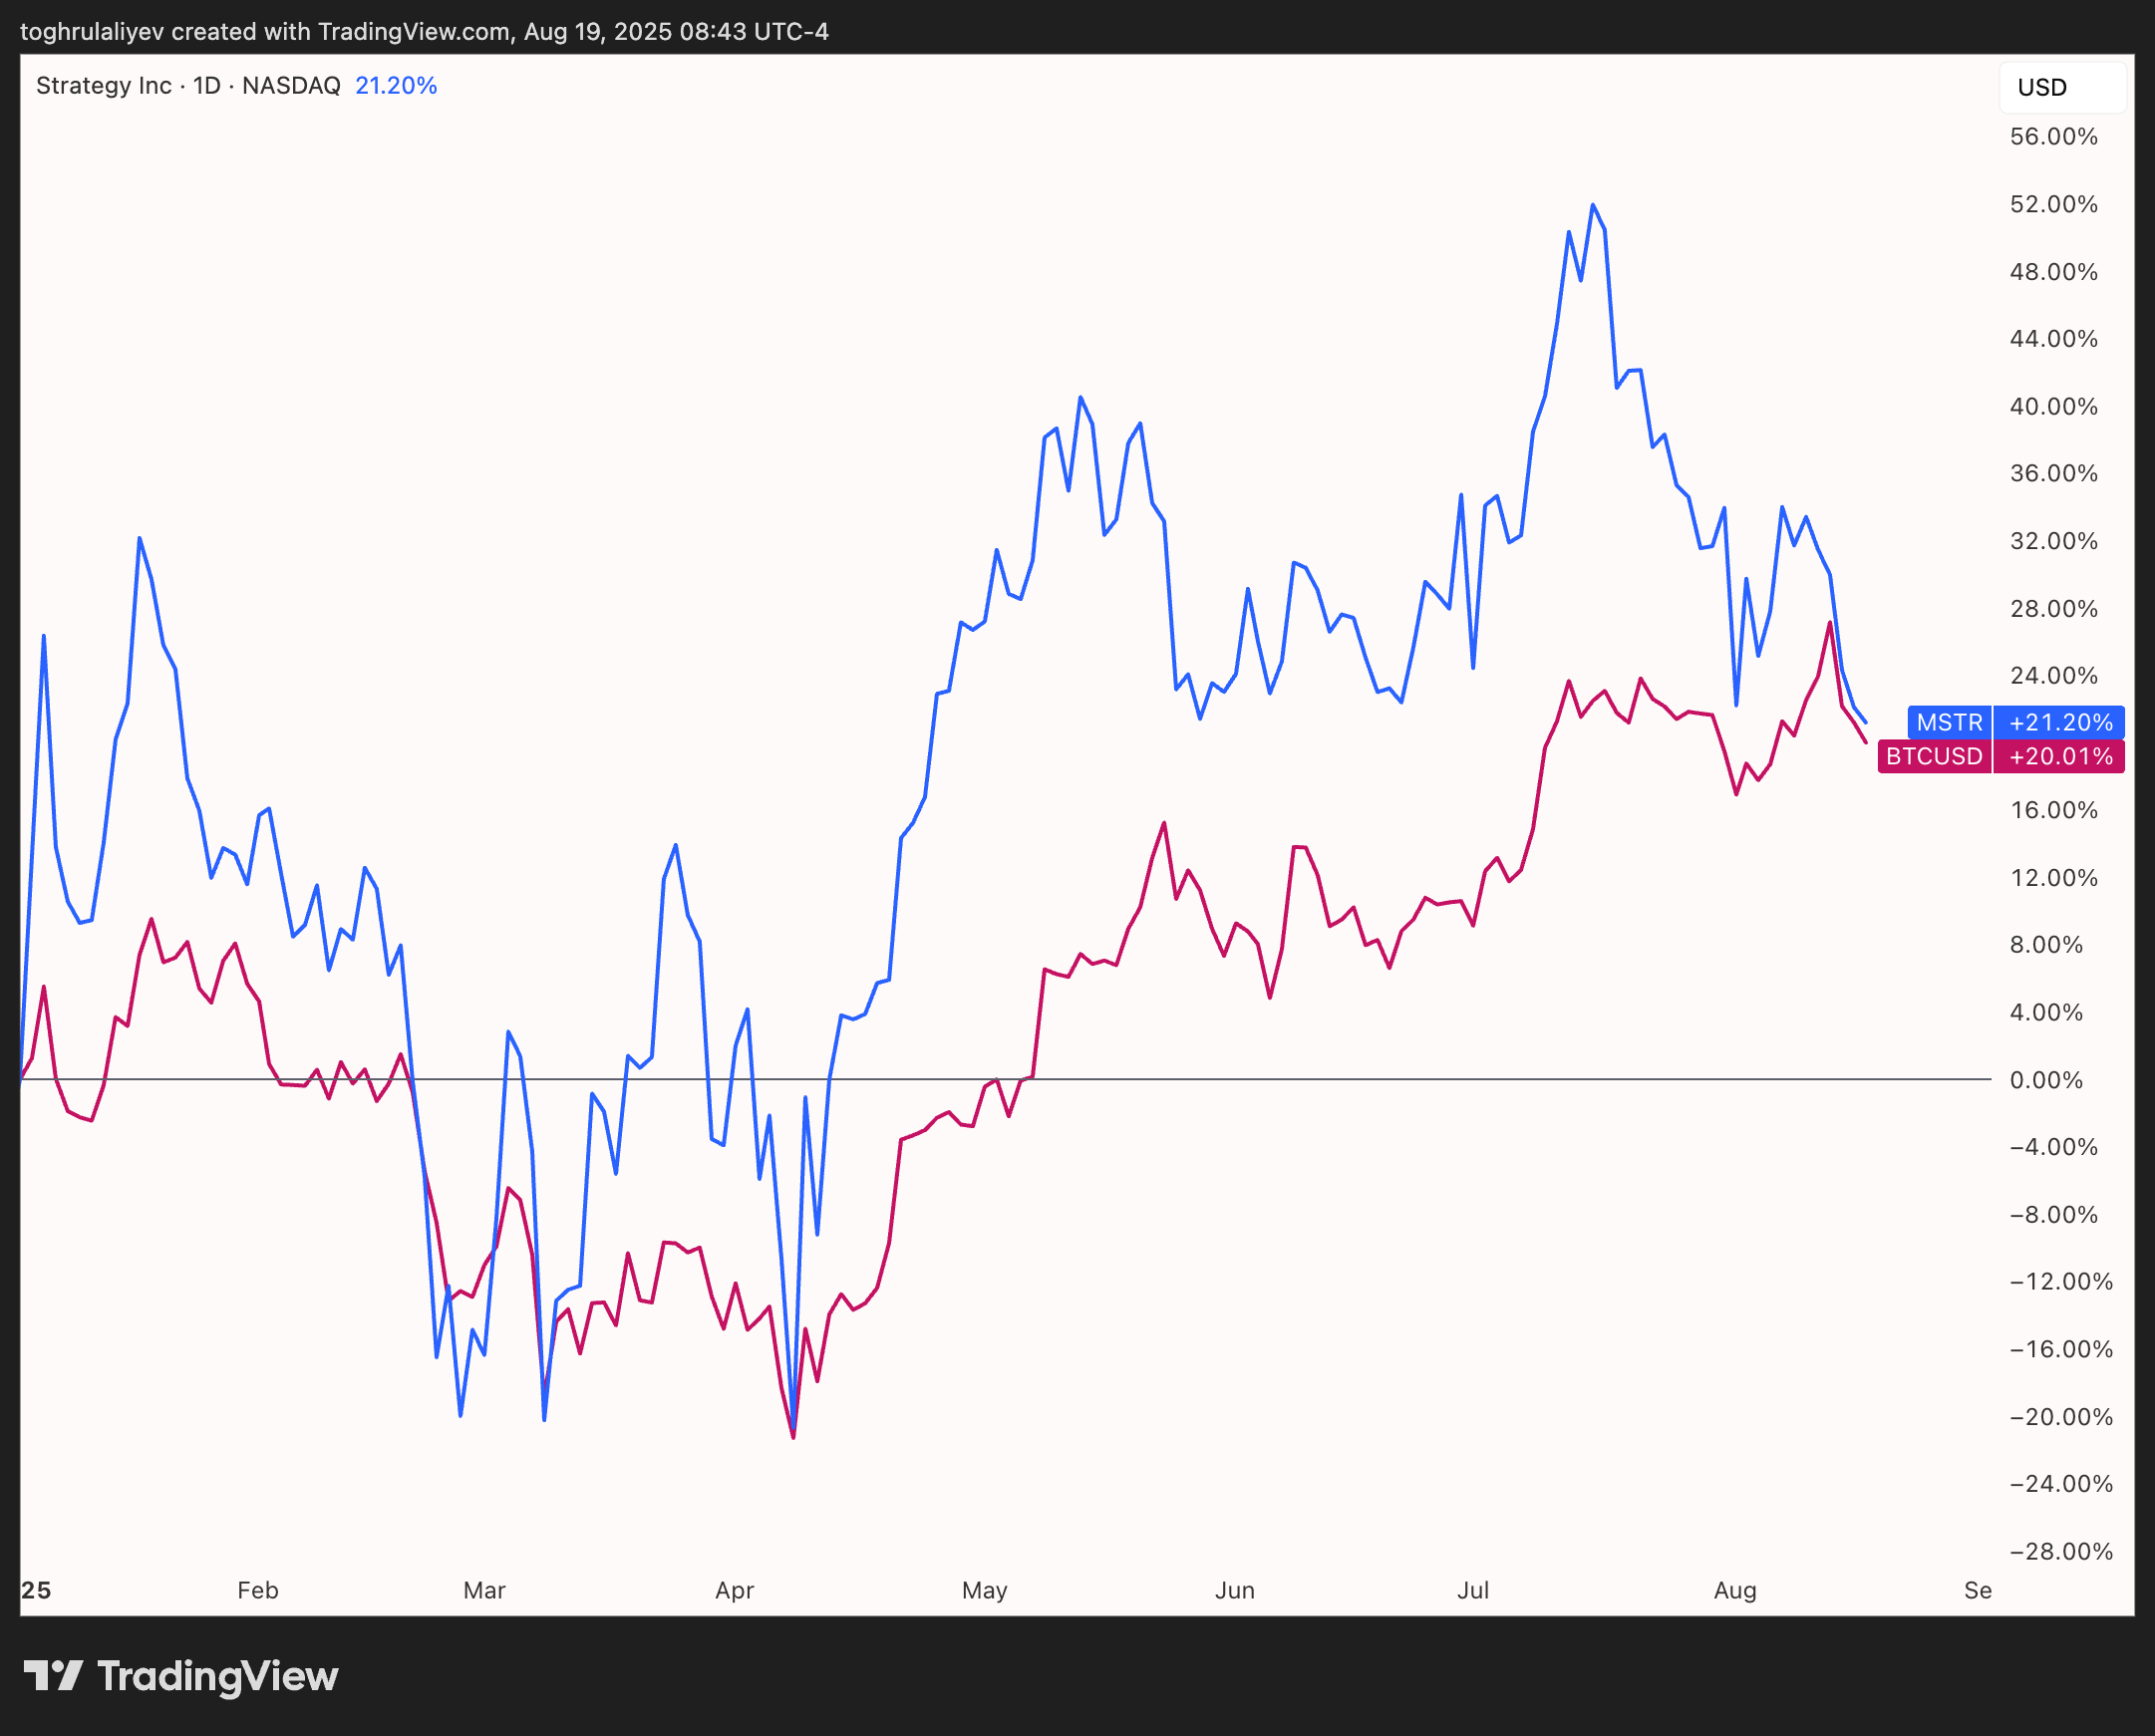
The table below demonstrates the reality. Based on data from TradingView as of August 18, 2025, MSTR has consistently outperformed Bitcoin on longer timeframes, including the 1-year, year-to-date, and full-year 2024 periods. On shorter windows such as 1-month, 3-month, and 6-month timeframes, however, the picture is less pronounced, which helps explain why many investors believe MSTR is lagging behind.
Asset
1M
3M
6M
1Y
2025 (YTD)
2024
MSTR
-1.27%
-7.45%
7.63%
171.95%
318.23%
21.16%
BTC
11.18%
12.65%
21.80%
95.44%
107.81%
20.01%
Another factor contributing to the underperformance perception is the behavior of many investors, both new and occasionally even seasoned professionals, who tend to buy at market tops driven by FOMO (fear of missing out). Once the stock experiences a decline, the next psychological bias that comes into play is loss aversion.
Loss aversion occurs when losses are perceived as more severe than equivalent gains, leading to disproportionate emotional reactions. It can cause investors to overlook long-term potential in favor of short-term price movements.
Figure 9: Loss Aversion | Credit: Toghrul Aliyev (@itsToghrul)
In the case of Strategy, when the stock underperforms relative to Bitcoin for a brief period, loss-averse investors may panic and sell, even though nothing material has changed with the company itself to justify that reaction. The emotional pain of being left behind by Bitcoin fuels the belief that MSTR is a poor investment, even when the broader data indicates otherwise.
Many of these behavioral patterns are reinforced by hyperbolic discounting, a cognitive bias that drives preference for immediate rewards at the expense of larger future gains.
As already mentioned, the retail investor boom, combined with the rise of assets that deliver extreme returns in very short periods, has created a market psychology centered on speed. Investors are now accustomed to fast gains, if not from Bitcoin, then from altcoins and memecoins that double overnight (e.g., ENA, MOODENG, PENGU, FWOG, HAEDAL), which fostered an expectation of instant gratification.
An investor affected by this mindset might think: “Why wait two years for MSTR to double when some new coin could give me 50% this month?” That way of thinking undervalues MSTR’s long-term strength. Instead of seeing its steady outperformance, they focus only on the fact that it hasn’t jumped as fast as whatever coin spiked last week, and they lose interest.
Last but not least is anchoring bias, a cognitive distortion that shapes investor behavior through fixation on specific reference points. Anchors can include an entry price, a previous ATH, or a forecast encountered online. Anchoring bias can lead to rigid or even unrealistic expectations. When price movements fail to align with a predetermined target, investors interpret the deviation as a failure of the asset rather than a reflection of normal volatility.
For MSTR, anchoring frequently takes the form of reliance on simplified forecasting models circulating in online communities. One of the more well-known forecast examples in the case of MSTR is the ballistic acceleration model, which is often shared online but lacks a solid analytical basis. The structure and assumptions behind that model will be examined in detail in a later section.
Why MSTR Is Not Going Up With BTC’s Upside Movement
MSTR–BTC Correlation and Volatility Profile
Beyond just examining raw performance, as explained above, the common belief that MSTR underperforms Bitcoin can be challenged using straightforward statistical metrics, such as correlation, volatility, and risk-adjusted returns.
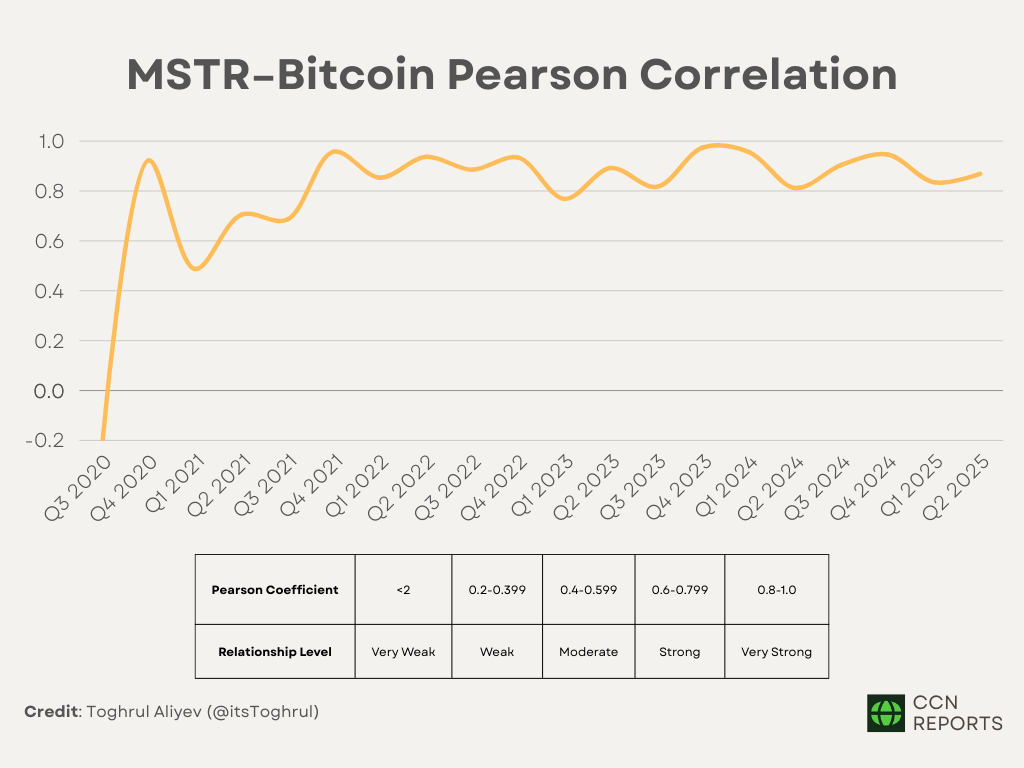
Strategy maintains a high historical correlation with Bitcoin. Many are aware of the relationship, but few consider how strong it actually is. Using daily closing prices for MSTR and BTC from TradingView, the daily Pearson correlation coefficient has stayed above 0.8 for years. In statistical terms, a value above 0.8 indicates an unusually tight relationship between two assets, where prices tend to move in the same direction most of the time.
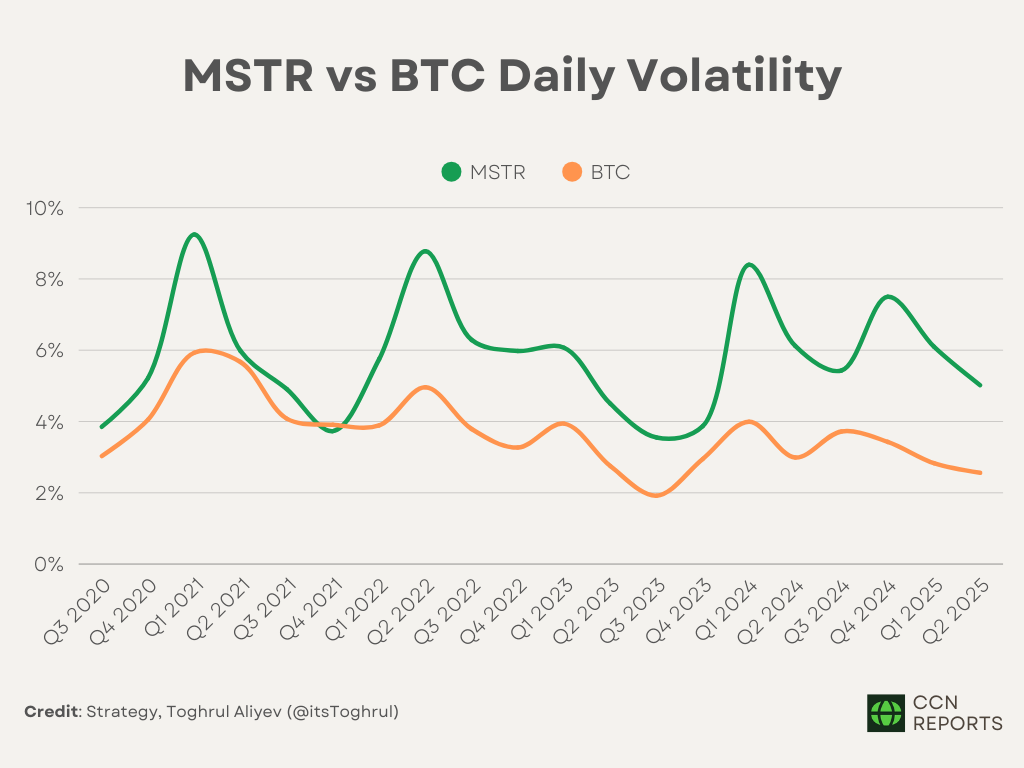
However, correlation does not imply that the two assets move in equal proportion. Volatility affects how that relationship works in practice. Since Strategy adopted Bitcoin as its treasury asset on August 10, 2020, MSTR’s daily volatility has been consistently higher than Bitcoin’s. Using daily standard deviations calculated from closing prices and then averaging the results, MSTR’s volatility exceeds that of Bitcoin by a factor of approximately 1.57. As a result, when Bitcoin enters a correction, Strategy tends to experience a deeper drawdown. On the other hand, during a strong upward trend, MSTR typically delivers higher percentage returns.
Figure 13: MSTR vs BTC Daily Volatility
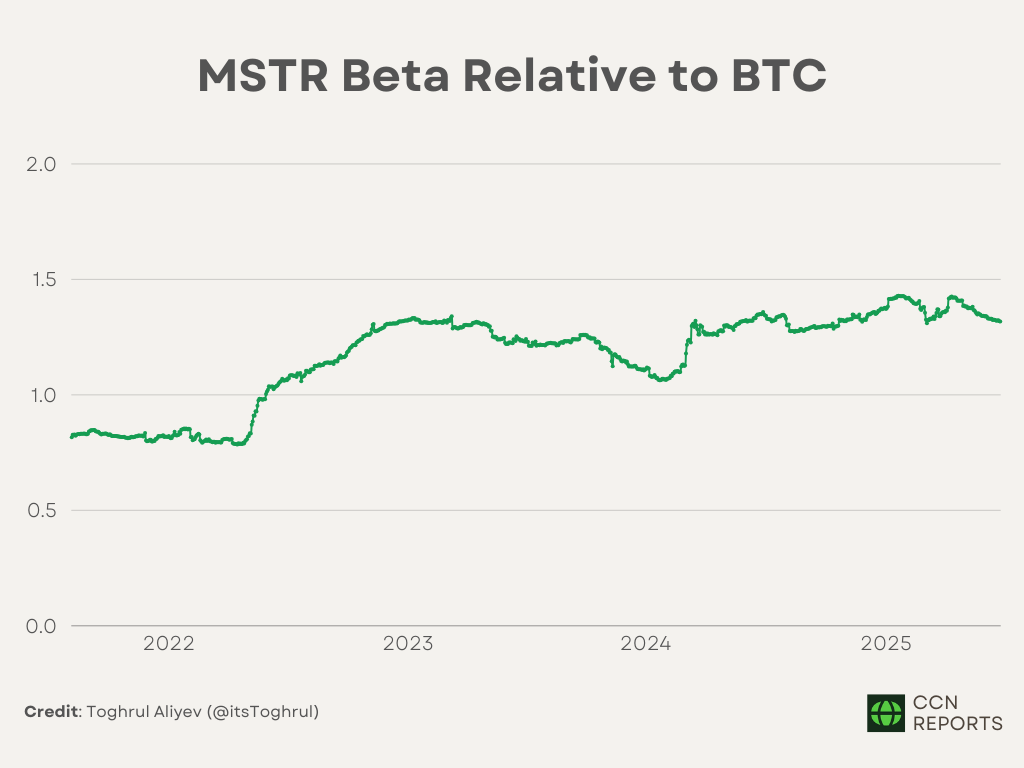
The stronger move of MSTR relative to Bitcoin also shows up in its beta, derived from one-year returns rolled forward one day at a time. In 2025, MSTR’s rolling annual beta sits between 1.31 and 1.41. That means if Bitcoin goes up 1%, MSTR usually goes up 1.31%-1.41%. The reverse also happens on the downside.
But how does MSTR’s sensitivity to Bitcoin change depending on the type of move?
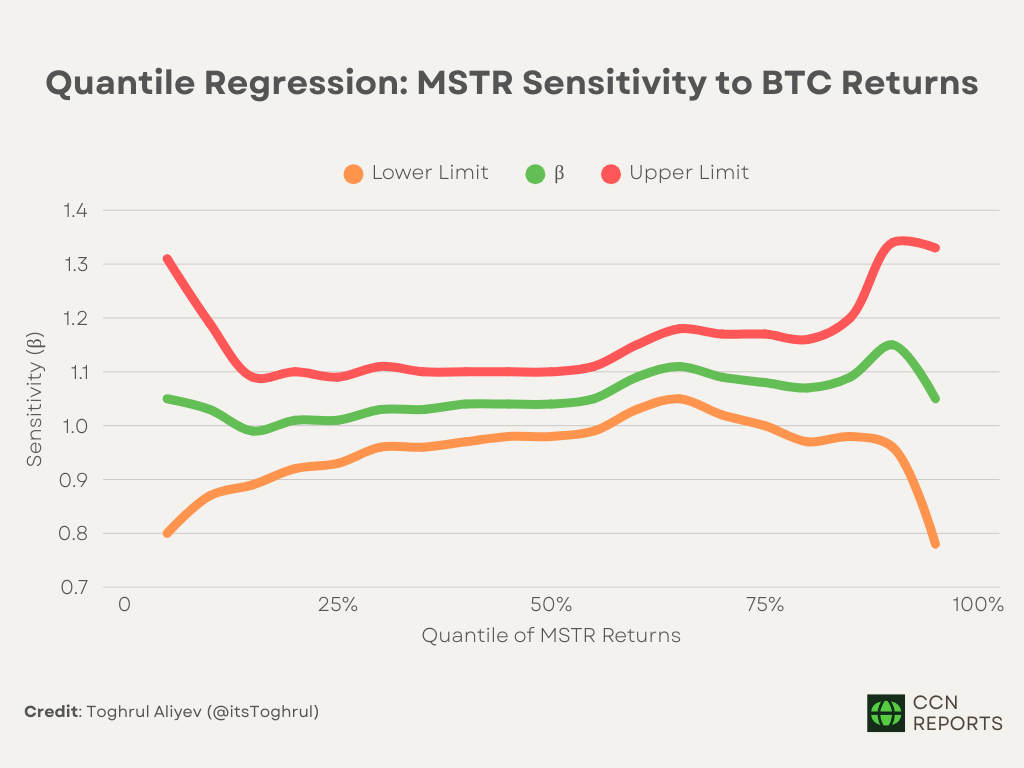
Quantile regression breaks the relationship into percentiles. Using daily log returns for MSTR and Bitcoin from August 10, 2020, to July 10, 2025, the model sets MSTR returns as the dependent variable and Bitcoin returns as the independent variable. Quantile regression reveals how MSTR’s sensitivity to Bitcoin shifts across the entire return distribution instead of a single average estimate. It asks whether MSTR reacts the same during a dip as it does during a rally. It doesn’t.
When returns are weak, around the 25th percentile, MSTR’s beta sits near 1.01. At stronger return levels, such as the 75th or 95th percentile, the beta rises to about 1.1 to 1.15.
In other words, MSTR rises more than Bitcoin during strong uptrends and falls roughly in line or slightly more during downturns, though the upside amplification is still stronger than the downside.
To see how reliable these numbers are, the model includes two extra lines above (red) and below (orange) the main result (green). They show a range where the beta is likely to fall 95% of the time. The range is tighter in the middle due to more data and wider at the edges, where data is limited, making those numbers less certain.
Despite some uncertainty at the tails, the pattern remains visible across the full range: MSTR becomes more reactive to Bitcoin during rallies.
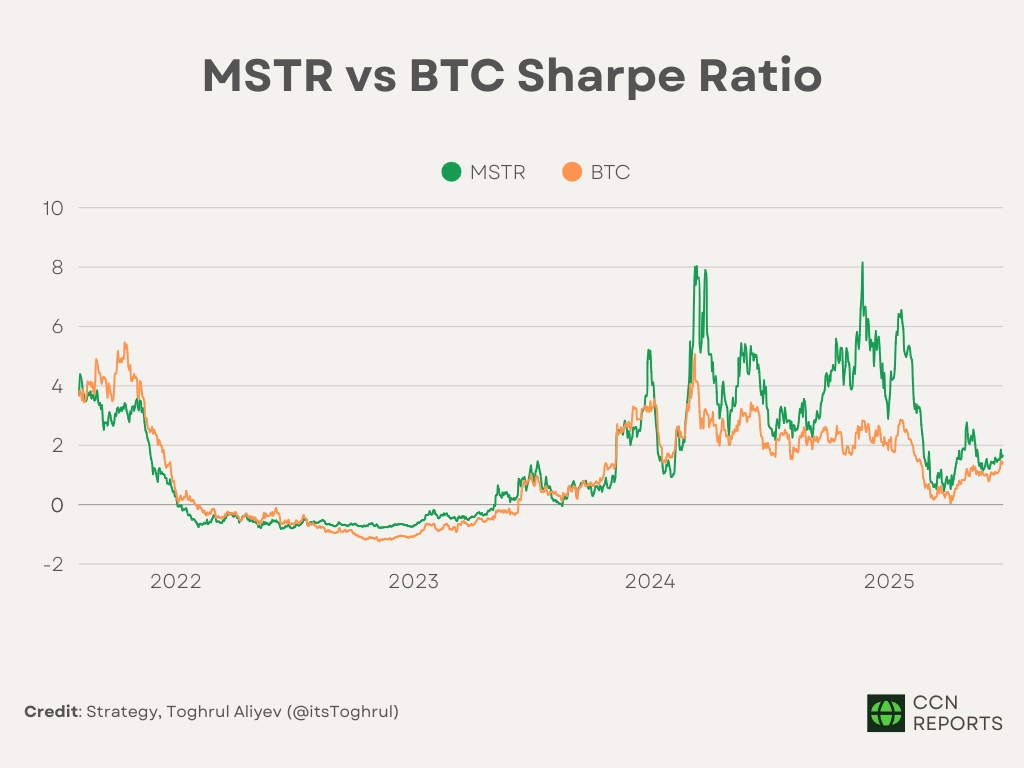
The same relationship holds when measured through risk-adjusted return metrics. From August 10, 2020, through July 10, 2025, MSTR shows a higher Sharpe ratio on a rolling annual basis. The calculation takes 1-year returns, rolled forward one day at a time, and applies the daily 3-month U.S. Treasury yield, which ranged from 0.03% to 5.36% over the period, as the risk-free rate.
Analysis records a Sharpe ratio of 1.57 for MSTR, compared to 1.09 for Bitcoin. The Sharpe ratio evaluates the return of an asset relative to its total volatility. A higher ratio indicates more return per unit of risk. Despite exhibiting greater price variability, MSTR has delivered superior returns relative to that volatility.
Figure 16: MSTR vs BTC Sharpe Ratio | Credit: Strategy, Toghrul Aliyev (@itsToghrul)
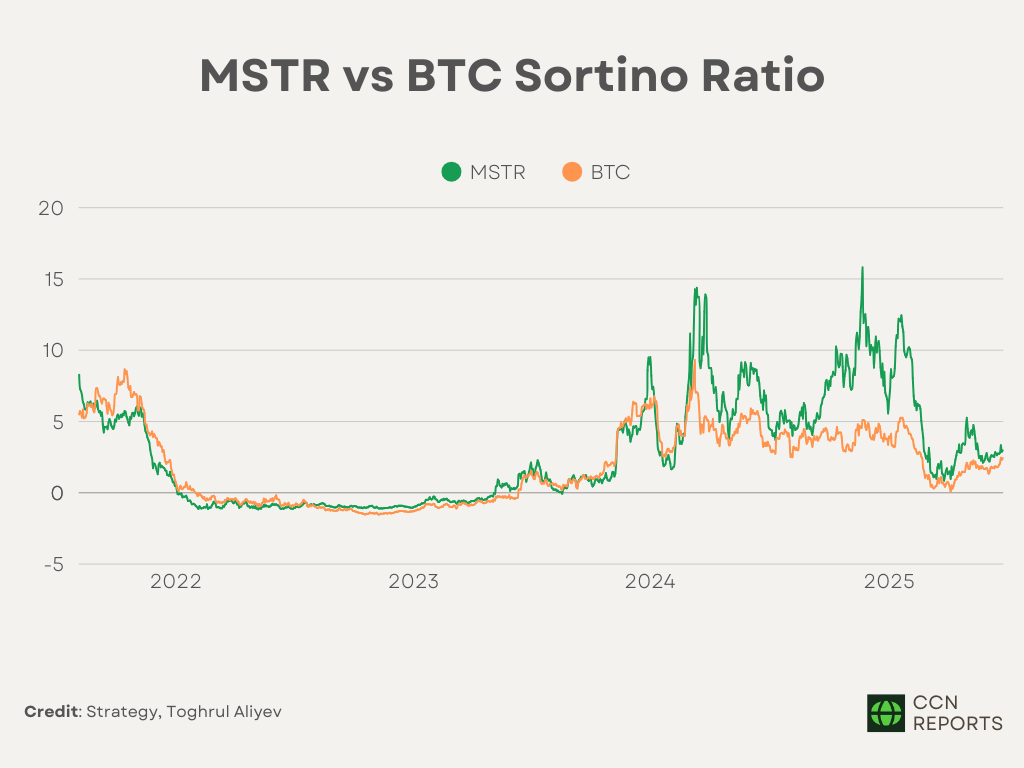
The Sortino ratio isolates downside volatility, measuring returns adjusted only for negative deviations. Using the same method of daily returns, averaged into rolling 1-year returns, and the daily 3-month Treasury yield as in the Sharpe ratio, the Sortino ratio for Strategy also shows stronger results. Its average annual Sortino ratio stands at 2.84, compared to 1.94 for Bitcoin. The result suggests that MSTR, while more volatile in absolute terms, has compensated for that risk with higher efficiency in producing positive returns. The magnitude of price swings does not undermine the underlying reward structure when adjusted for risk.
Figure 17: MSTR vs BTC Sortino Ratio | Credit: Strategy, Toghrul Aliyev (@itsToghrul)
Recurring Underperformance Phases of MSTR/BTC
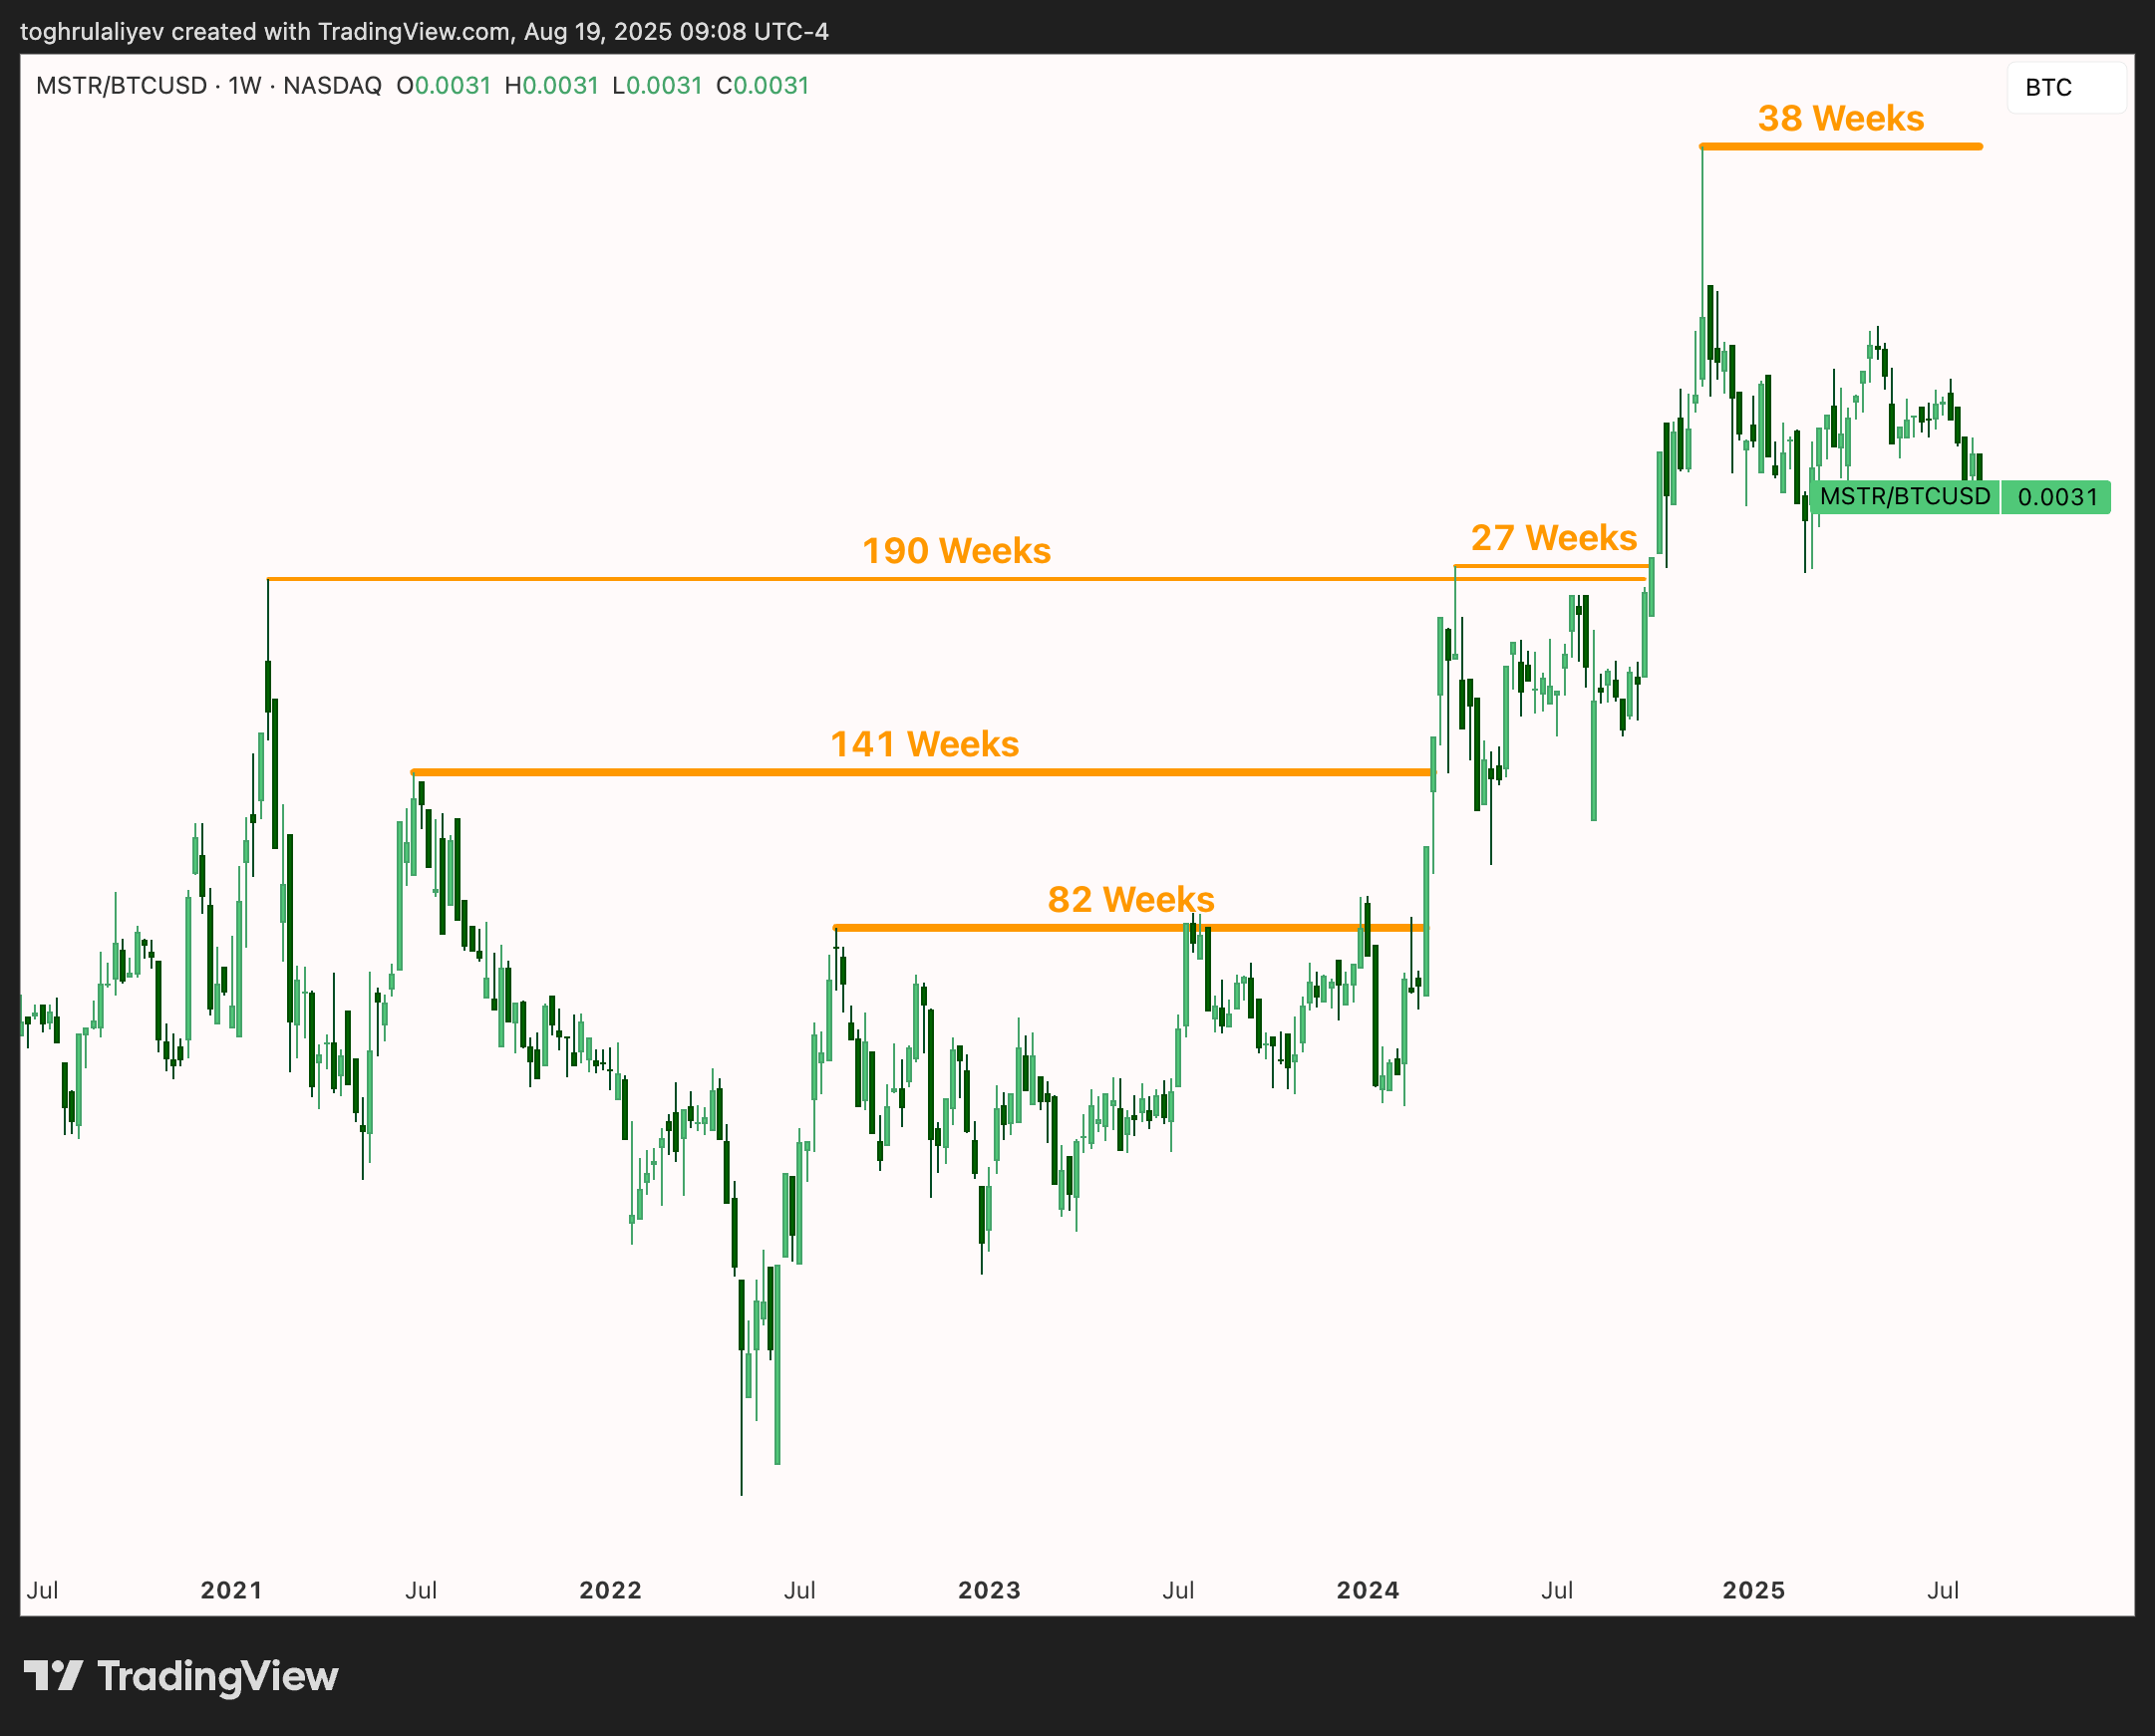
One point often overlooked is that Strategy’s recent slump relative to Bitcoin is not unprecedented. Over the five years since the company adopted its Bitcoin reserve strategy, the MSTR/BTC price ratio has gone through multiple cycles. The ratio measures relative performance: when rising, MSTR outperforms Bitcoin; when falling, it underperforms. Historically, brief periods of outperformance near Bitcoin’s bull market peaks are followed by prolonged phases of underperformance.
February 2021: The MSTR/BTC decline lasted 190 weeks until late 2024 when it finally broke higher.
June 2021: MSTR briefly outpaced BTC after Bitcoin’s drop from about $65k in April. Afterward, it underperformed for 141 weeks until early 2024.
August 2022: After Bitcoin’s relief rally, MSTR peaked relative to BTC. It then underperformed for 82 weeks, lasting through late 2022 market lows and into early 2023’s recovery. MSTR struggled more than Bitcoin during the bear market phase.
March 2024: Bitcoin ETFs, the halving, and peak euphoria pushed both assets higher. MSTR outpaced BTC briefly before the market topped. Over the next 27 weeks, it underperformed.
November 2024: Bitcoin rallied again in late 2024 following Donald Trump’s presidential election victory. MSTR outpaced Bitcoin during that surge and peaked relative to it in November. Since then, it has lagged and remains behind as of August 2025.
Looking at past cycles, long stretches of underperformance are normal for MSTR. It peaks ahead of Bitcoin during early rally phases, then underperforms during sideways or weak markets. As discussed earlier, MSTR’s price moves are amplified both on the way up and on the way down.
Since Strategy adopted its Bitcoin strategy only five years ago, and much of that period fell within a bear market or early-stage recovery, the available data is limited. Still, the pattern is consistent.
It would be convenient to have a crystal ball and always time the entry before the acceleration, but markets don’t work that way. They are a complex and unpredictable mix of economic data, human emotion, and unforeseen global events, making it not only impossible to know when a peak or bottom has been reached, but also extremely hard and unlikely to predict on a continuing basis successfully with a repeatable framework. Without the foresight, investors caught near the top must endure long periods of drawdown or stagnation before performance rebounds.
Hence, it is understandable why many conclude that their investment is underperforming, especially if they entered during local tops or, worse, pursued aggressive positions through leveraged ETFs or short-dated options. The timing error could explain much of the negative sentiment.
Capital Raising via ATM Issuance: Dilution and Strategic Rationale
Any investor following Strategy knows that at-the-market (ATM) offerings have been the company’s primary method of raising capital to acquire Bitcoin. An ATM offering is a mechanism by which a public company can sell newly issued shares gradually into the open market at prevailing market prices.
The problem with this approach is equity dilution. When a company issues new shares, the ownership percentage and claim on assets or future profits of existing shareholders are reduced.
But this is where most investors overlook the core of Strategy’s capital structure. The company does not aim to improve conventional metrics such as earnings per share. Instead, it focuses on increasing Bitcoin per share, which is quite an unconventional but essential metric for a Bitcoin treasury company.
Each ATM equity issuance allows the firm to raise fiat capital and immediately convert it into additional Bitcoin. While issuing new shares technically dilutes existing equity, the company offsets this by adding more Bitcoin, an appreciating asset, to the balance sheet than the dilution implies. As a result, each share represents a larger claim on Bitcoin over time.
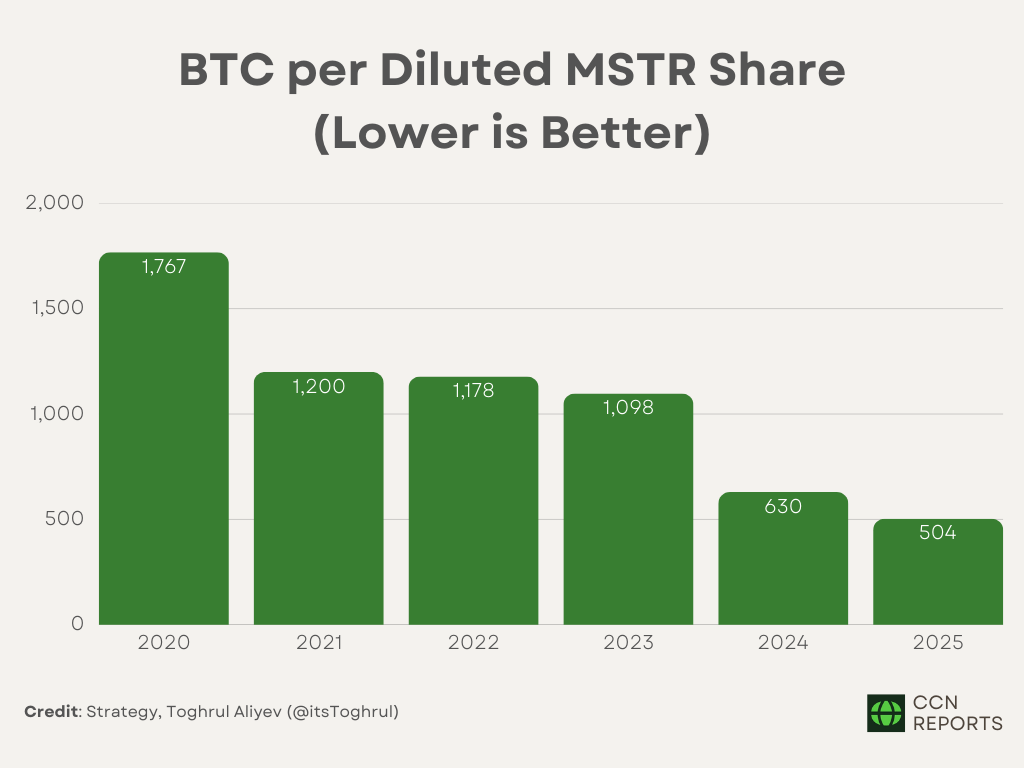
As of August 2025, Bitcoin per share stands at 504. Using Bitcoin reserve data and diluted share counts disclosed on Strategy’s official website, the calculation shows year-over-year decreases of 72% in 2020, 58% in 2021, 57% in 2022, 54% in 2023, and 20% in 2024. On average, the year-over-year decrease is roughly 21%.
Figure 20: BTC per Diluted MSTR Share (Lower is Better) | Strategy, Toghrul Aliyev (@itsToghrul)
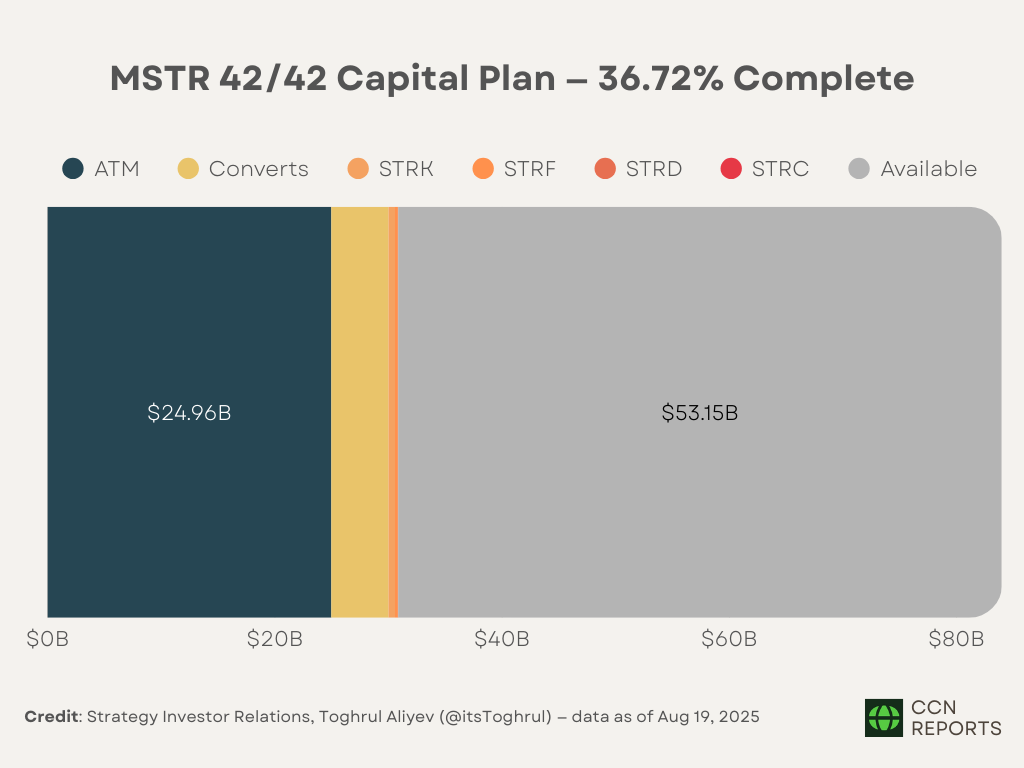
Unfortunately, the pace and scale of Strategy’s capital issuance have drawn scrutiny. In October 2024, the company announced the 21/21 plan, a financing initiative comprising an ATM equity program of up to $21 billion alongside a $21 billion program for fixed-income securities. In May 2025, the company expanded the framework further by introducing the 42/42 plan, which doubled the authorized capacity for both equity and debt offerings. As of August 2025, Strategy has completed 36.72% of the combined program.
Figure 21: MSTR 42/42 Capital Plan — 36.72% Complete | Credit: Strategy Investor Relations, Toghrul Aliyev (@itsToghrul) — data as of Aug 19, 2025
The fixed-income securities program serves as one way Strategy has attempted to limit ATM issuance and support shareholder value. It includes four classes of preferred stock: STRK, STRF, STRD, and STRC.
Out of the four, only STRK can convert into common shares if certain conditions are met, which makes it the only one that introduces direct dilution risk. STRF, STRD, and STRC are non-convertible and leave the common share count unaffected. All four instruments carry dividend obligations, but the combined annual cost is around $600 million. Given Strategy’s Bitcoin holdings exceed $70 billion, the burden is modest in proportion to the company’s asset base.
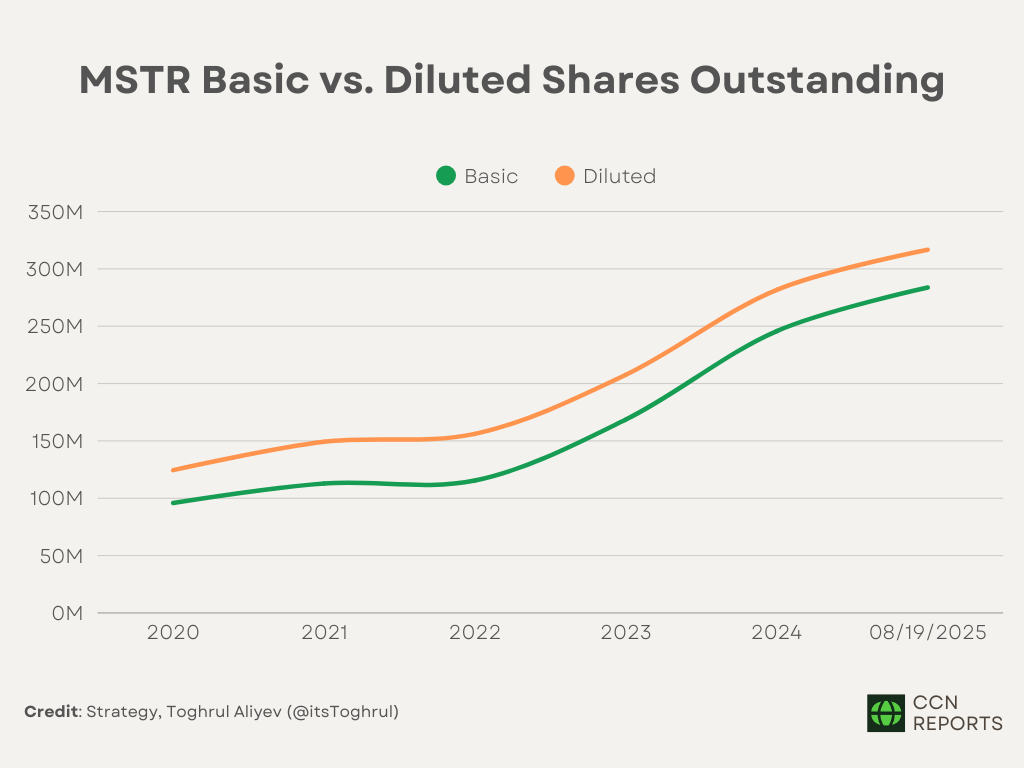
Even with those limits in place, over the nine-month period since October 2024, the number of basic shares outstanding rose from 202.6 million to 283.76 million, an increase of 40%. Diluted shares climbed by 12.44%, from 281.7 million to 316.73 million.
What is interesting is not just the scale of issuance but how the market responded. Any other company issuing a significant amount of shares like Strategy would have seen its stock collapse. It is basic mathematics.
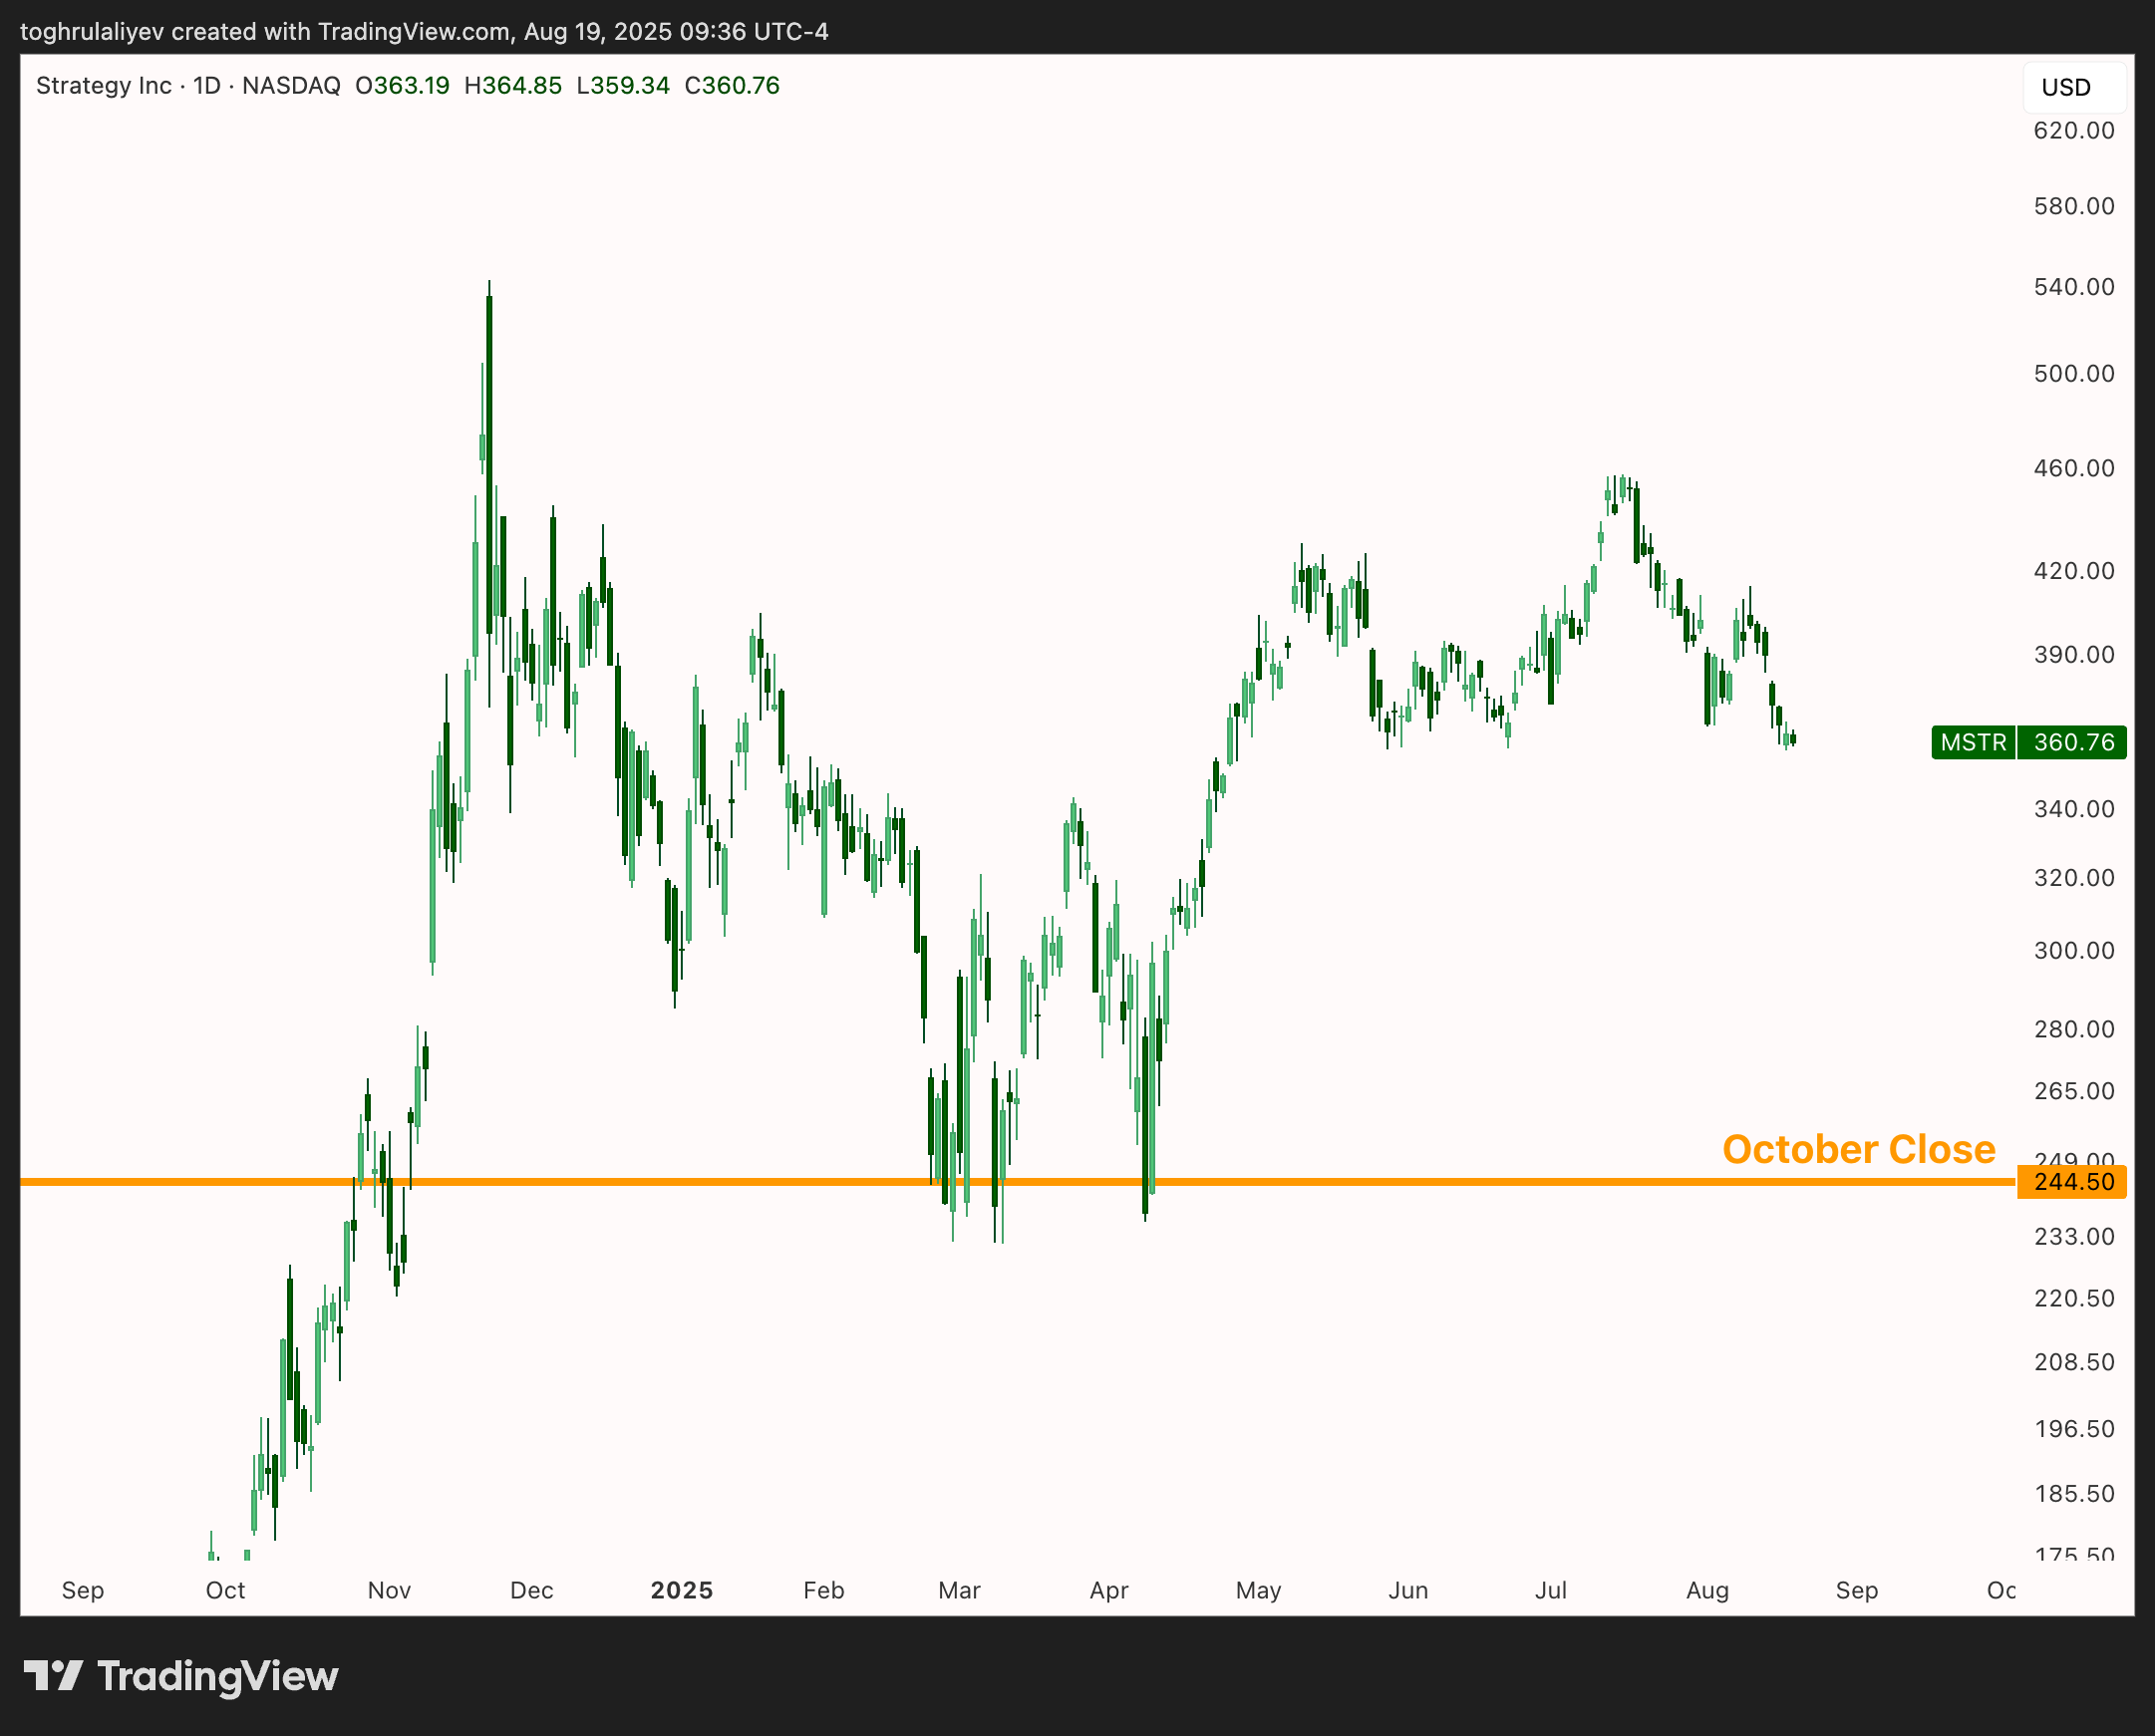
Yet Strategy’s stock held steady, trading between $221–$543. When the 21/21 plan was first announced, the stock closed in October at $244.5. From that point forward, the price rarely dropped below that level and instead was treated as a support zone.
Figure 23: MSTR Support Zone Amid Massive Share Issuance | Credit: TradingView, Toghrul Aliyev (@itsToghrul)
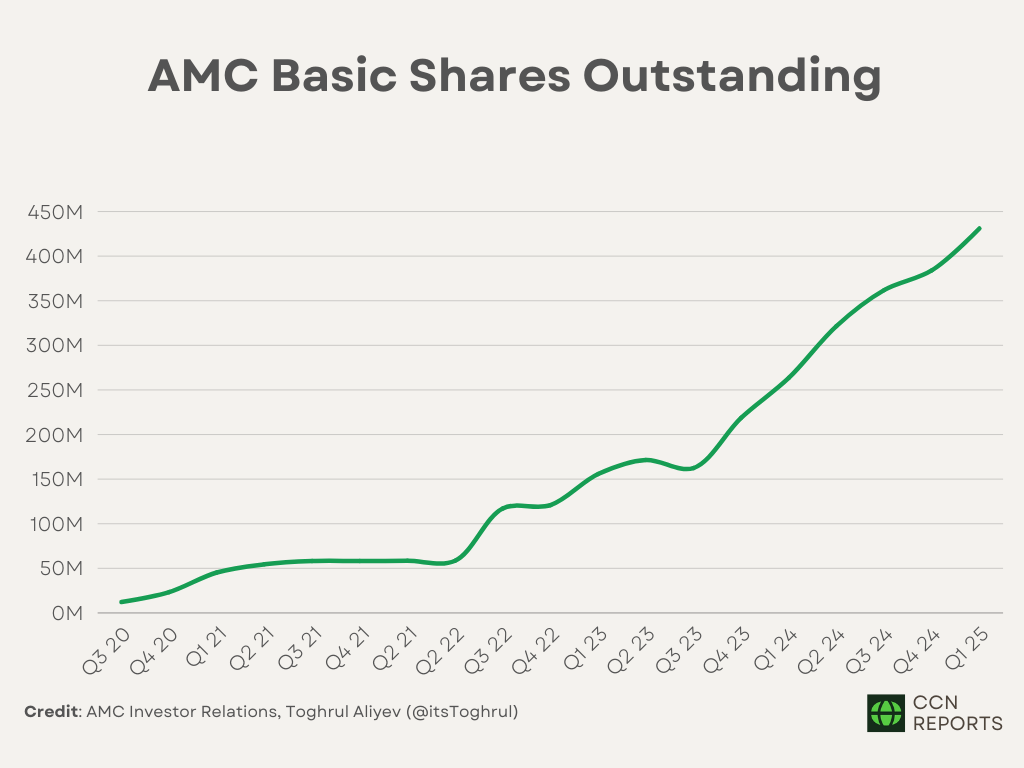
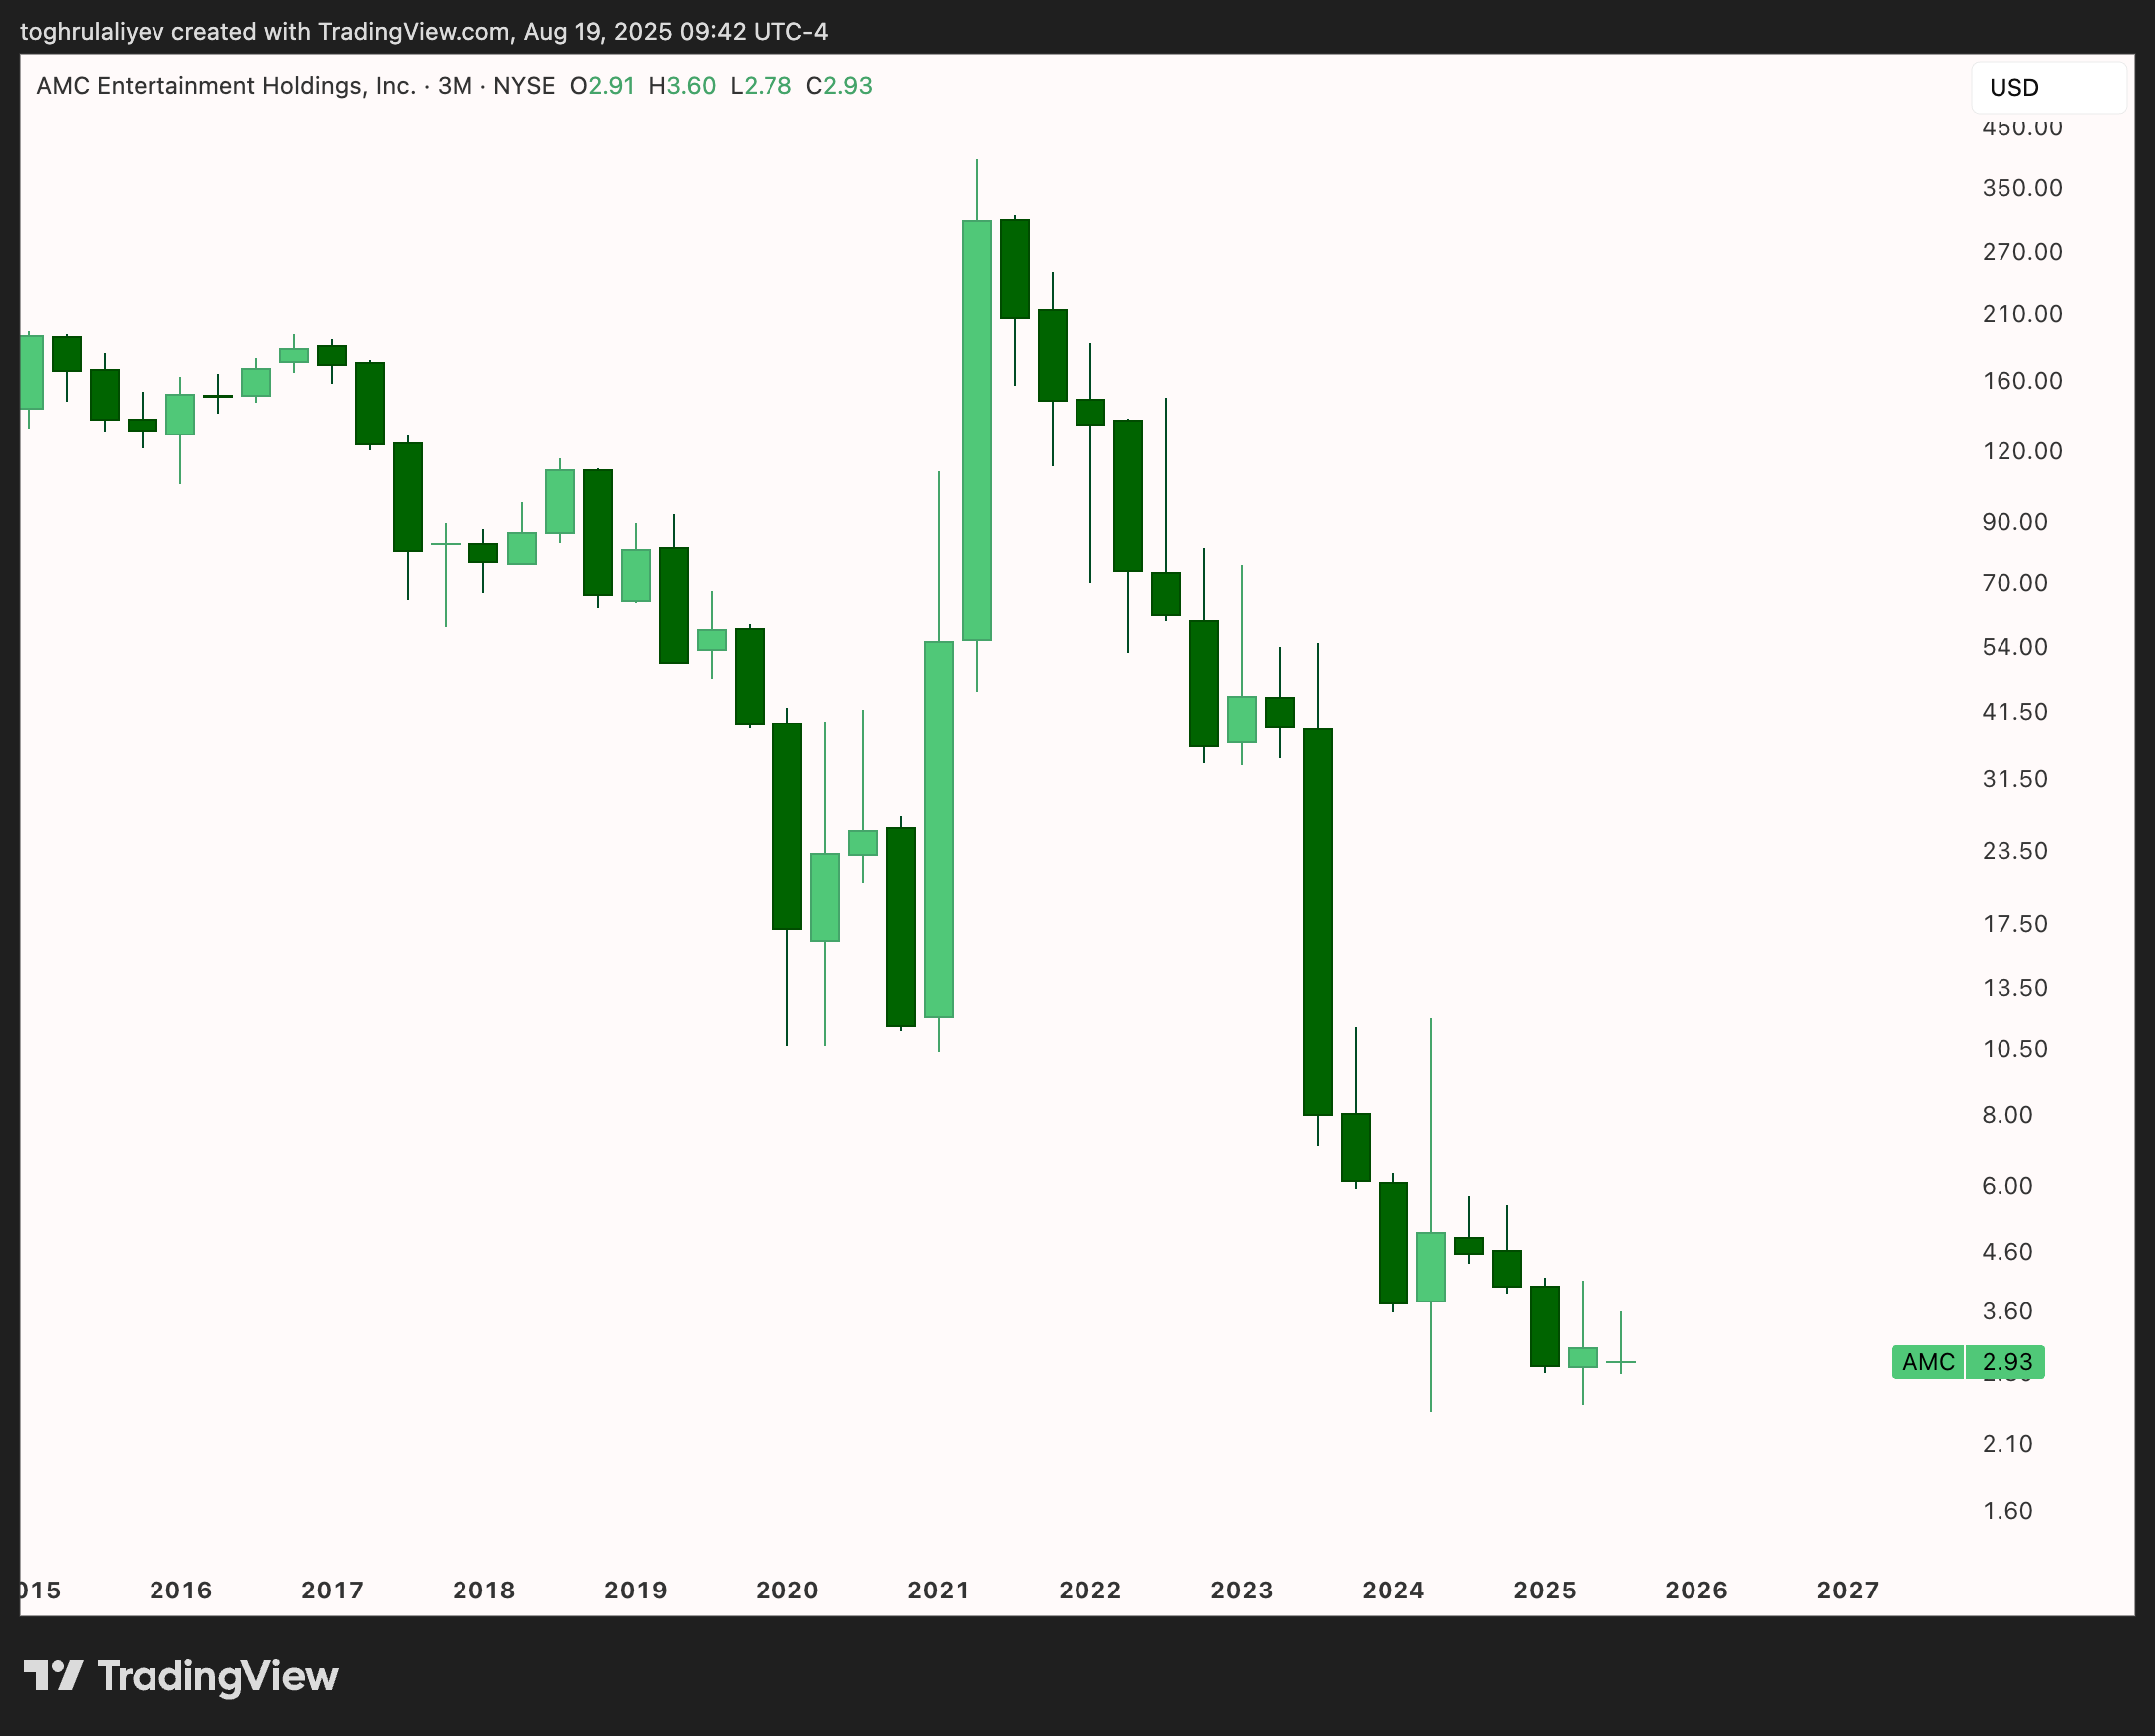
Compare that with what happened to AMC. Over the past five years, AMC increased its share count by more than 3,000%, including 97% in just the last two.
However, the capital raised didn’t translate into productive assets or higher intrinsic value. As a result, the stock price fell by 99%, tracking the dilution almost one-to-one.
This outcome exemplifies a core financial principle: the Modigliani–Miller theorem. The theorem states that a company’s value is determined by its assets and future cash flows, rather than by how its capital is structured. AMC’s issuances simply divided the same value into a larger number of shares without expanding the underlying pie. So, dilution functioned as a mechanism to delay insolvency instead of creating value.
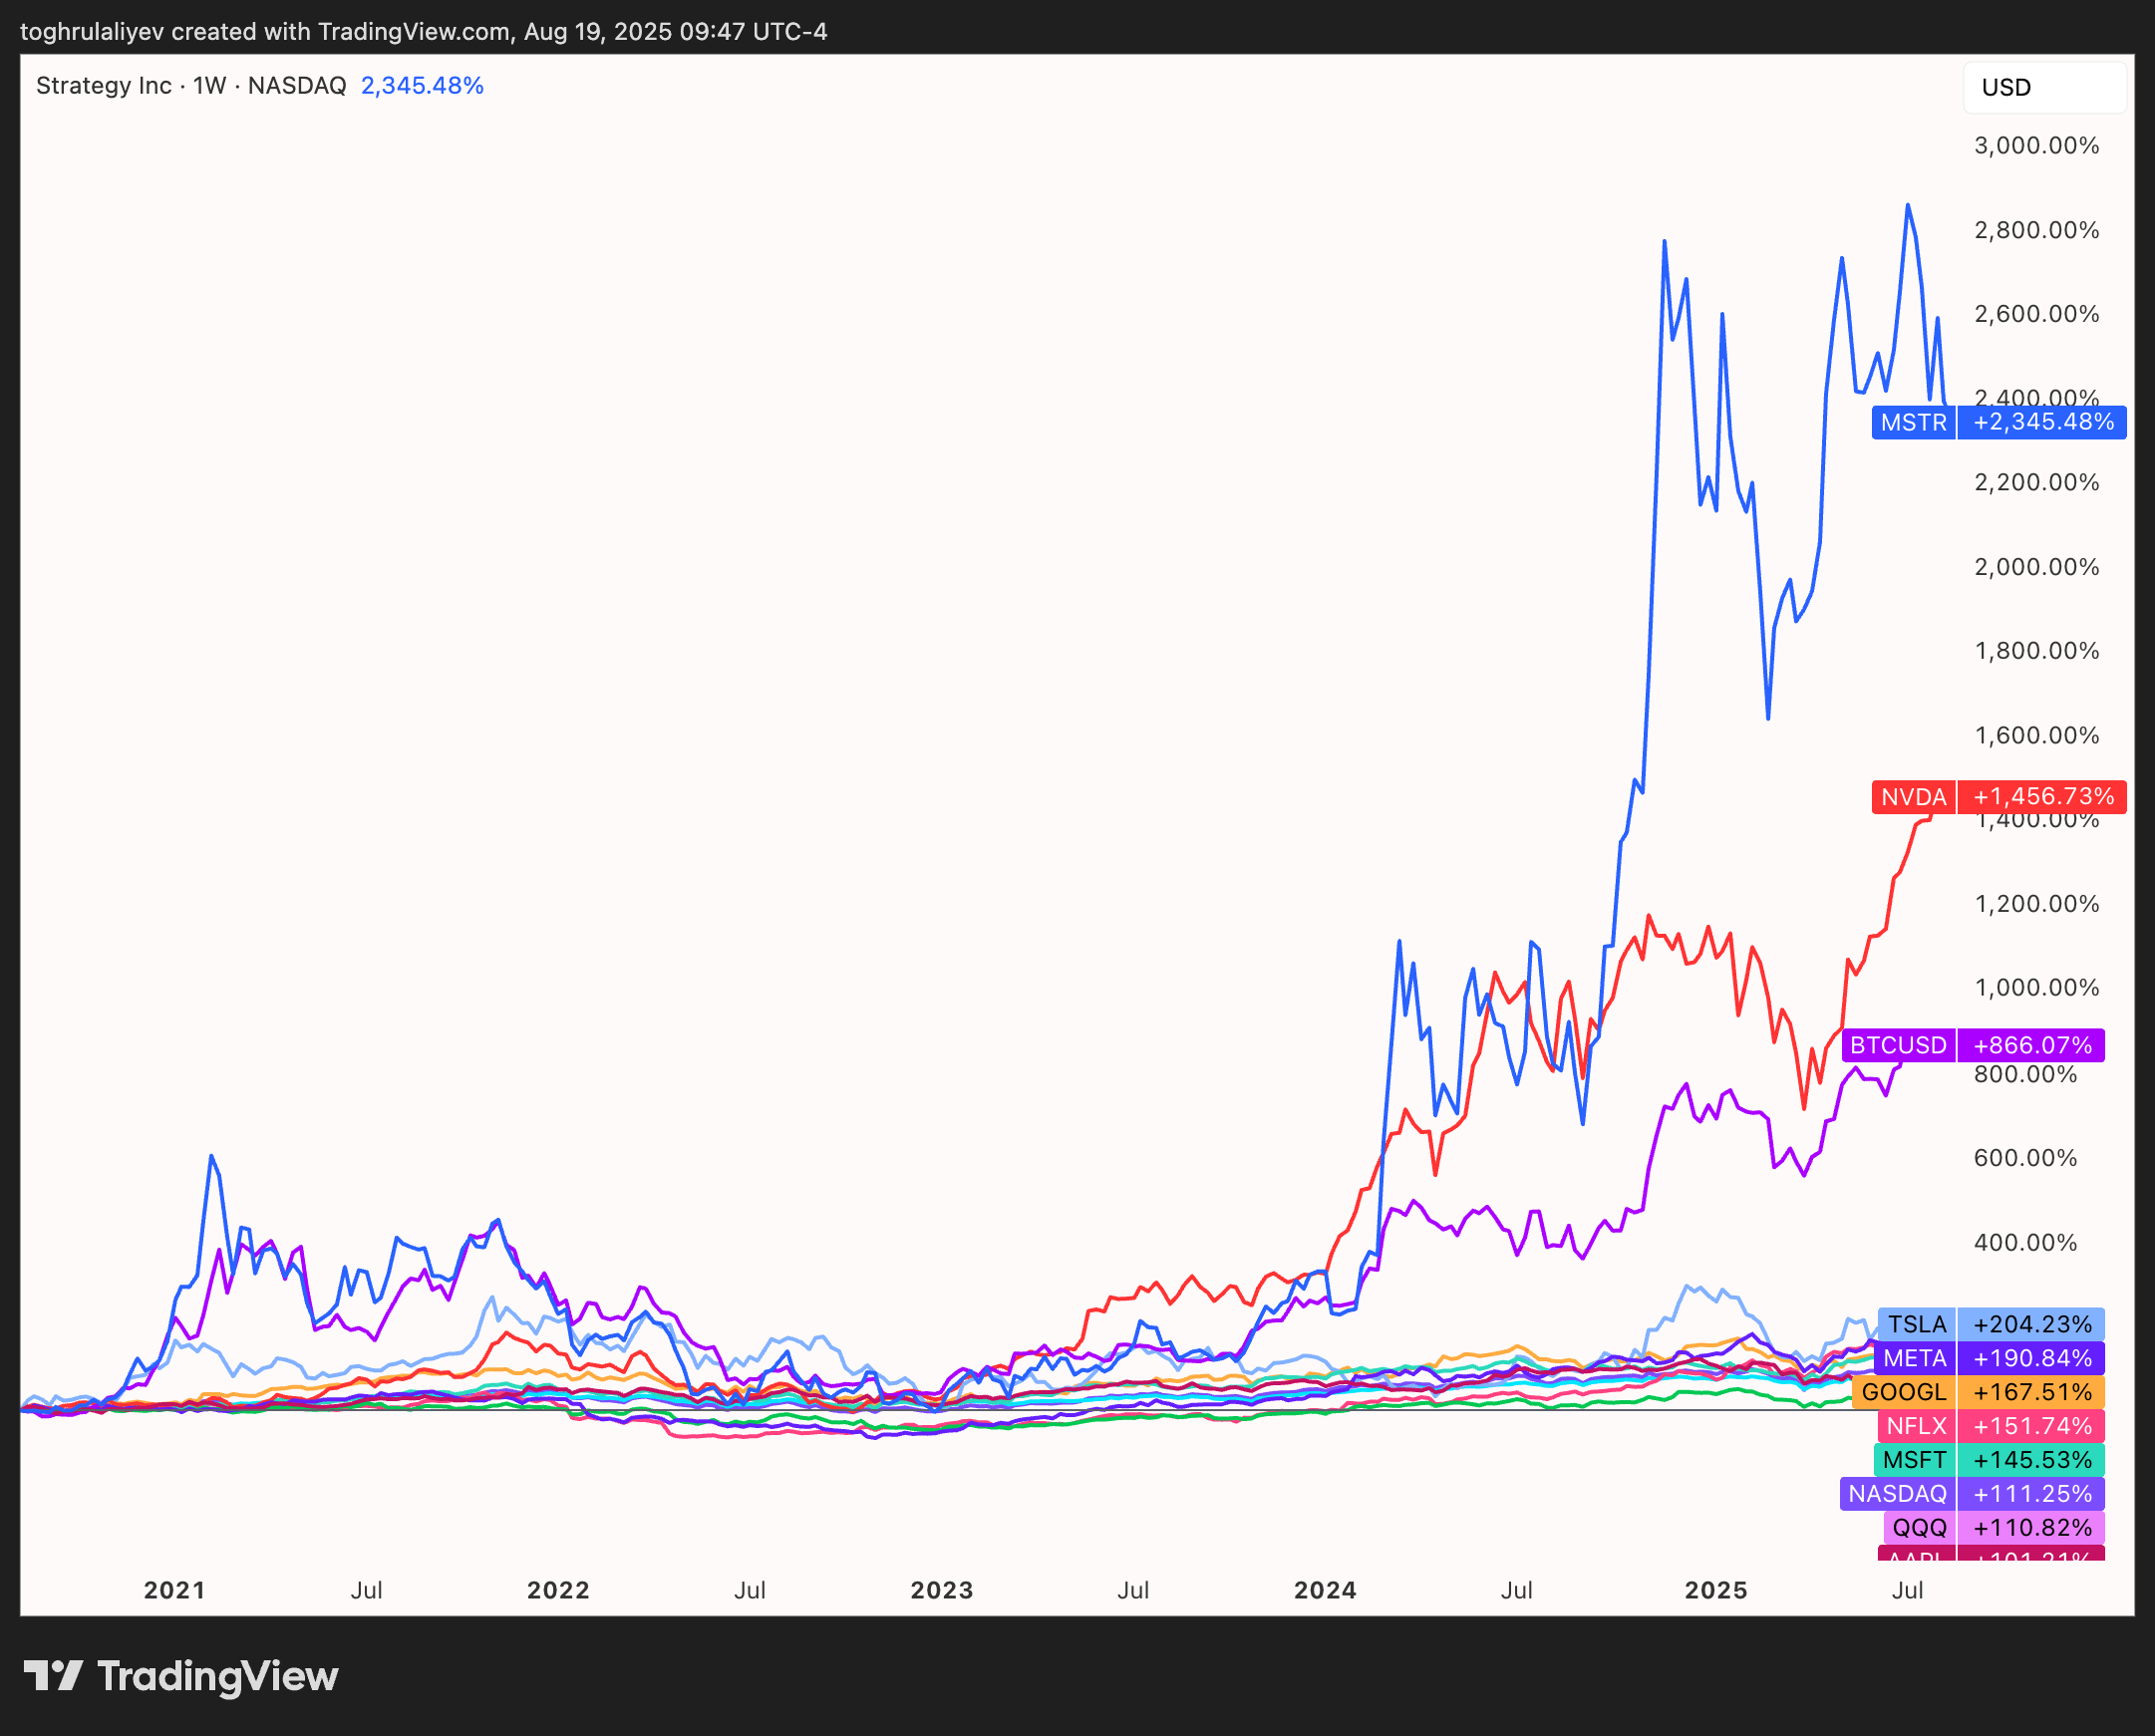
Meanwhile, Strategy’s approach was fundamentally different. When it issued shares, the company immediately used the capital to acquire an appreciating asset, Bitcoin
Figure 26: MSTR Performance vs. Major Benchmarks (2020–2025) | Credit: TradingView, Toghrul Aliyev (@itsToghrul)
The company even raised its share count by 188% over five years and 92% in the last two years. Yet MSTR surged over 3,900% during that time, outperforming the S&P 500, Magnificent Seven, and even Bitcoin.
The market can, does, and will distinguish between dilution that funds value creation and dilution that merely delays insolvency. MSTR falls into the former category. And sooner or later, the stock price will reflect that.
The Arbitrage Effect: How Convertible Debt Creates Selling Pressure
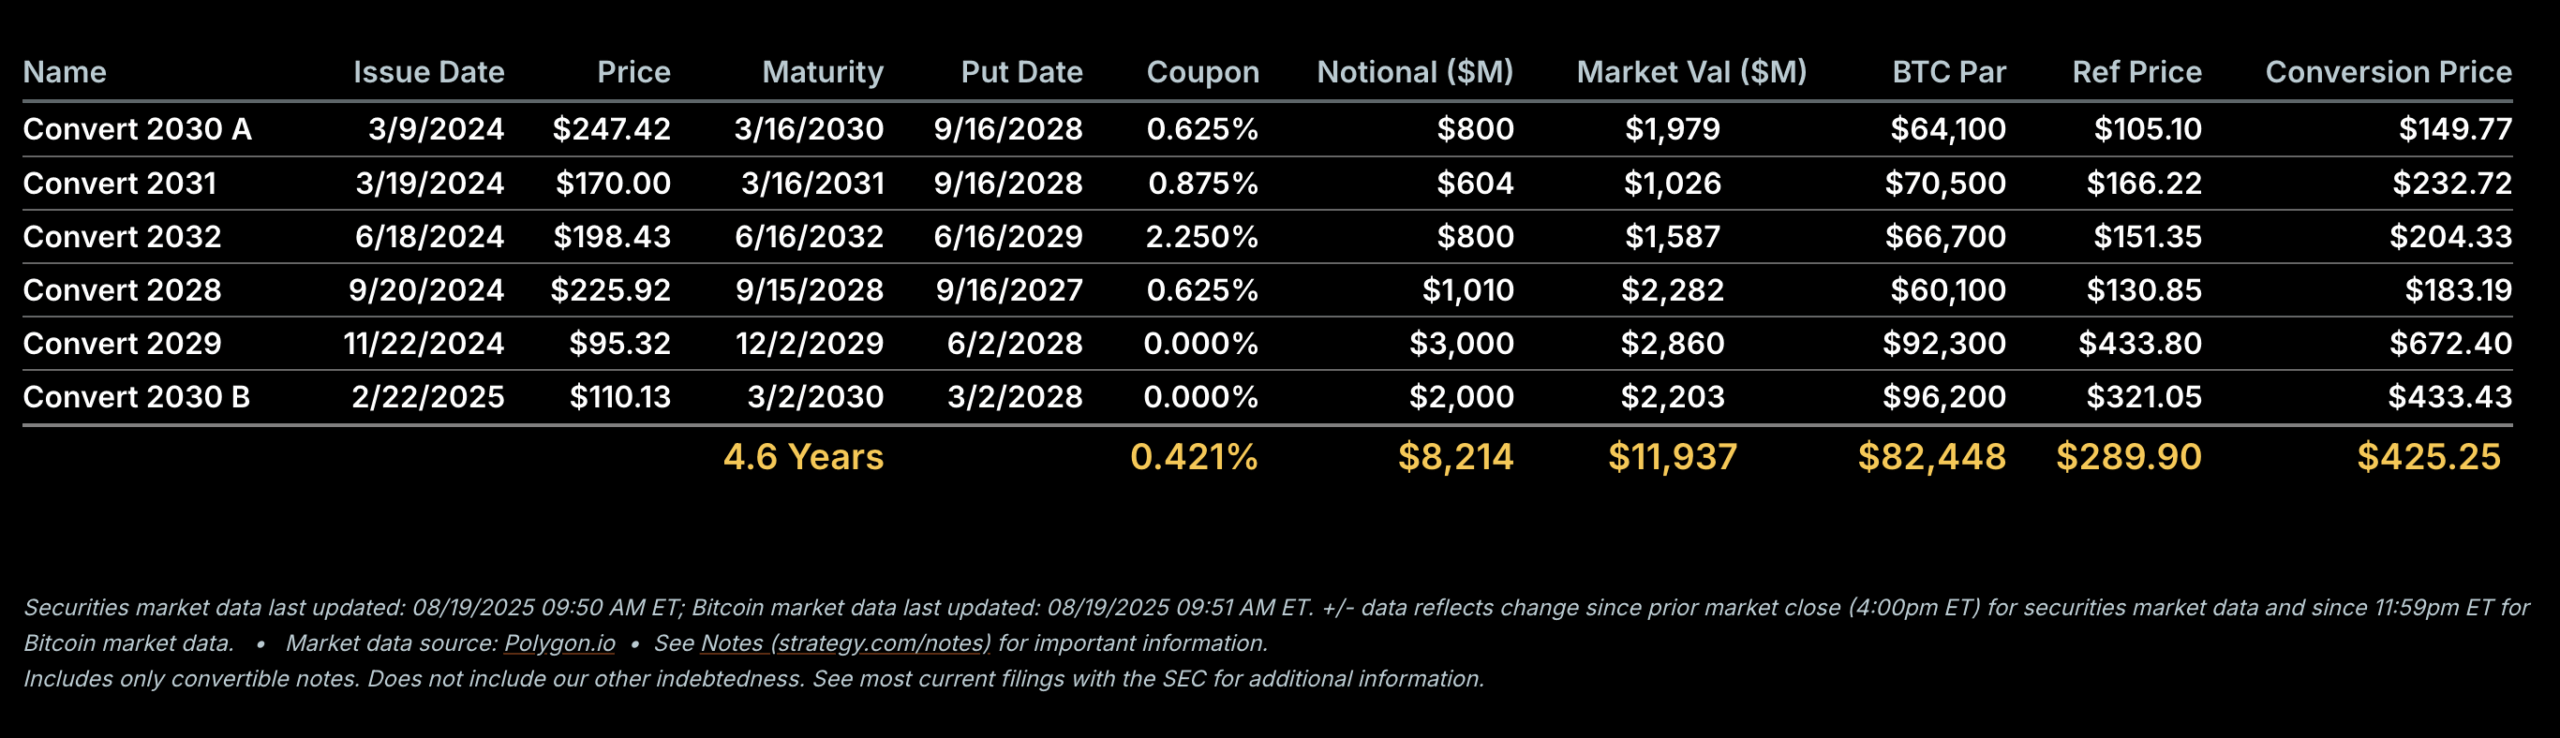
Another factor contributing to MSTR’s underperformance is the company’s use of convertible debt for financing. Following the announcement of its “21/21” plan, Strategy executed three large offerings.
The company’s financing included a $3.0 billion issuance in November 2024 of 0% convertible senior notes due in 2029, carrying a conversion price of $672.4
A subsequent offering in February 2025 added another $2.0 billion through a 0% convertible note due in 2030, with a $433.43 conversion price.
In addition to the notes, Strategy introduced a convertible preferred stock in January 2025, the 8% yielding Series A “STRK” perpetual preferred, with a conversion price of $1,000 per share.
While these convertible instruments allow Strategy to raise capital to buy Bitcoin, they also create persistent selling pressure on the stock through convertible arbitrage.
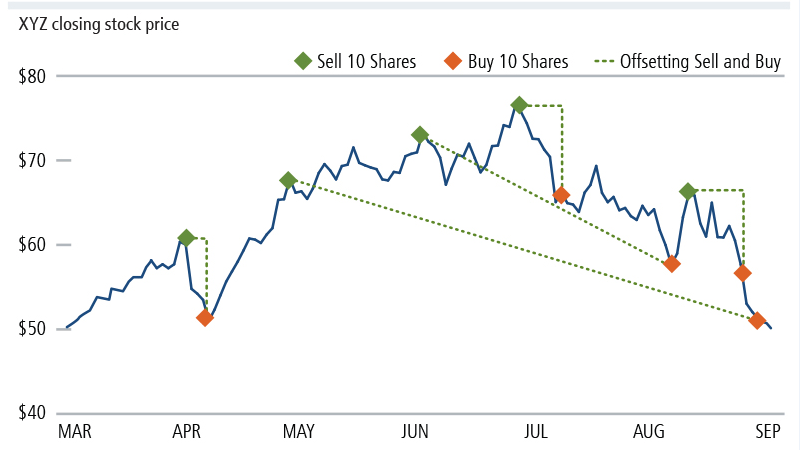
Convertible arbitrage involves the simultaneous purchase of a convertible security and the short sale of the same issuer’s common stock. The goal is to stay market-neutral, so gains from one side offset losses from the other, allowing the trader to profit from pricing gaps and volatility rather than betting on the stock’s direction.
The strategy’s efficacy comes from the hybrid nature of the convertible security itself, which is either a bond or a preferred stock that can be converted into a predetermined number of common shares at a specified price (the conversion price).
A convertible security can be deconstructed into two primary components:
A debt component: The convertible security functions as a standard corporate bond, providing the holder with periodic coupon payments and the promise of principal repayment at maturity. This creates a “bond floor,” a theoretical minimum value below which the security should not trade, based purely on its fixed-income characteristics and the issuer’s creditworthiness. The bond floor offers downside protection because if the company’s stock price falls significantly, the convertible’s price should decline less than the stock, as its value is supported by this bond floor.
Embedded equity call option: The conversion feature works like a long-dated call option on the underlying common stock. It gives the bondholder the right, but not the obligation, to exchange the bond for a predetermined number of shares at the conversion price. If the stock trades above that level, the bondholder can convert and capture the equity upside. As the stock price climbs further above the conversion price, the convertible’s value increasingly reflects its equity component and moves more in step with the stock.
The main reason arbitrageurs buy this “package”, meaning Strategy’s 0% convertible senior notes, is that those notes embed a long-dated call option on MSTR stock that can be acquired at a lower cost than in the listed options market.
In other words, they are getting a volatility-rich option on one of the market’s most volatile large-cap stocks without paying option-market prices. At the same time, arbitrageurs maintain a credit-protected position that can still produce a modest positive carry through short-sale rebates and bond floor protection, even without a coupon.
A similar arbitrage applies to Strategy’s 8% perpetual convertible preferred, STRK. Its fair value consists of two parts:
The equity part, 0.1 times the MSTR share price
The income part, which is the present value of the $8 annual dividend, discounted at a rate reflecting credit risk, interest rates, and its perpetual nature.
On top of those, call provisions and limited liquidity both put a ceiling on how much investors are willing to pay for STRK. The possibility of the issuer redeeming the preferred at a fixed price caps upside potential, while thin trading and wider bid–ask spreads raise transaction costs, so the market price sits slightly below its theoretical equity-plus-income value. When STRK drops below that model value, its effective yield spikes and signals a mispricing ripe for arbitrage.
Arbitrageurs act by buying STRK for its inflated yield and simultaneously shorting 0.1 MSTR per STRK held. The purchase pushes STRK’s price upward while the shorting adds downward pressure on MSTR. Once yields normalize and the price gap closes, arbitrageurs unwind both legs of the trade. The process then repeats whenever the balance gets disrupted. Over time, this back-and-forth narrows the gap between STRK’s market price and what its combination of dividend yield and equity conversion value would suggest. In effect, the arbitrage smooths volatility across both instruments.
The strategy is simple, but keeping it balanced is not. Delta measures how much a convertible’s price moves for each dollar change in the stock. As the stock rises or falls, delta changes, which forces arbitrageurs to constantly rebalance their positions to remain market-neutral. In practice, this means selling more shares when the stock climbs and buying them back when it drops, a pattern known as dynamic delta hedging or gamma trading. Such adjustments can cap upward momentum and cushion declines, acting as a soft “ceiling” or a “floor”.
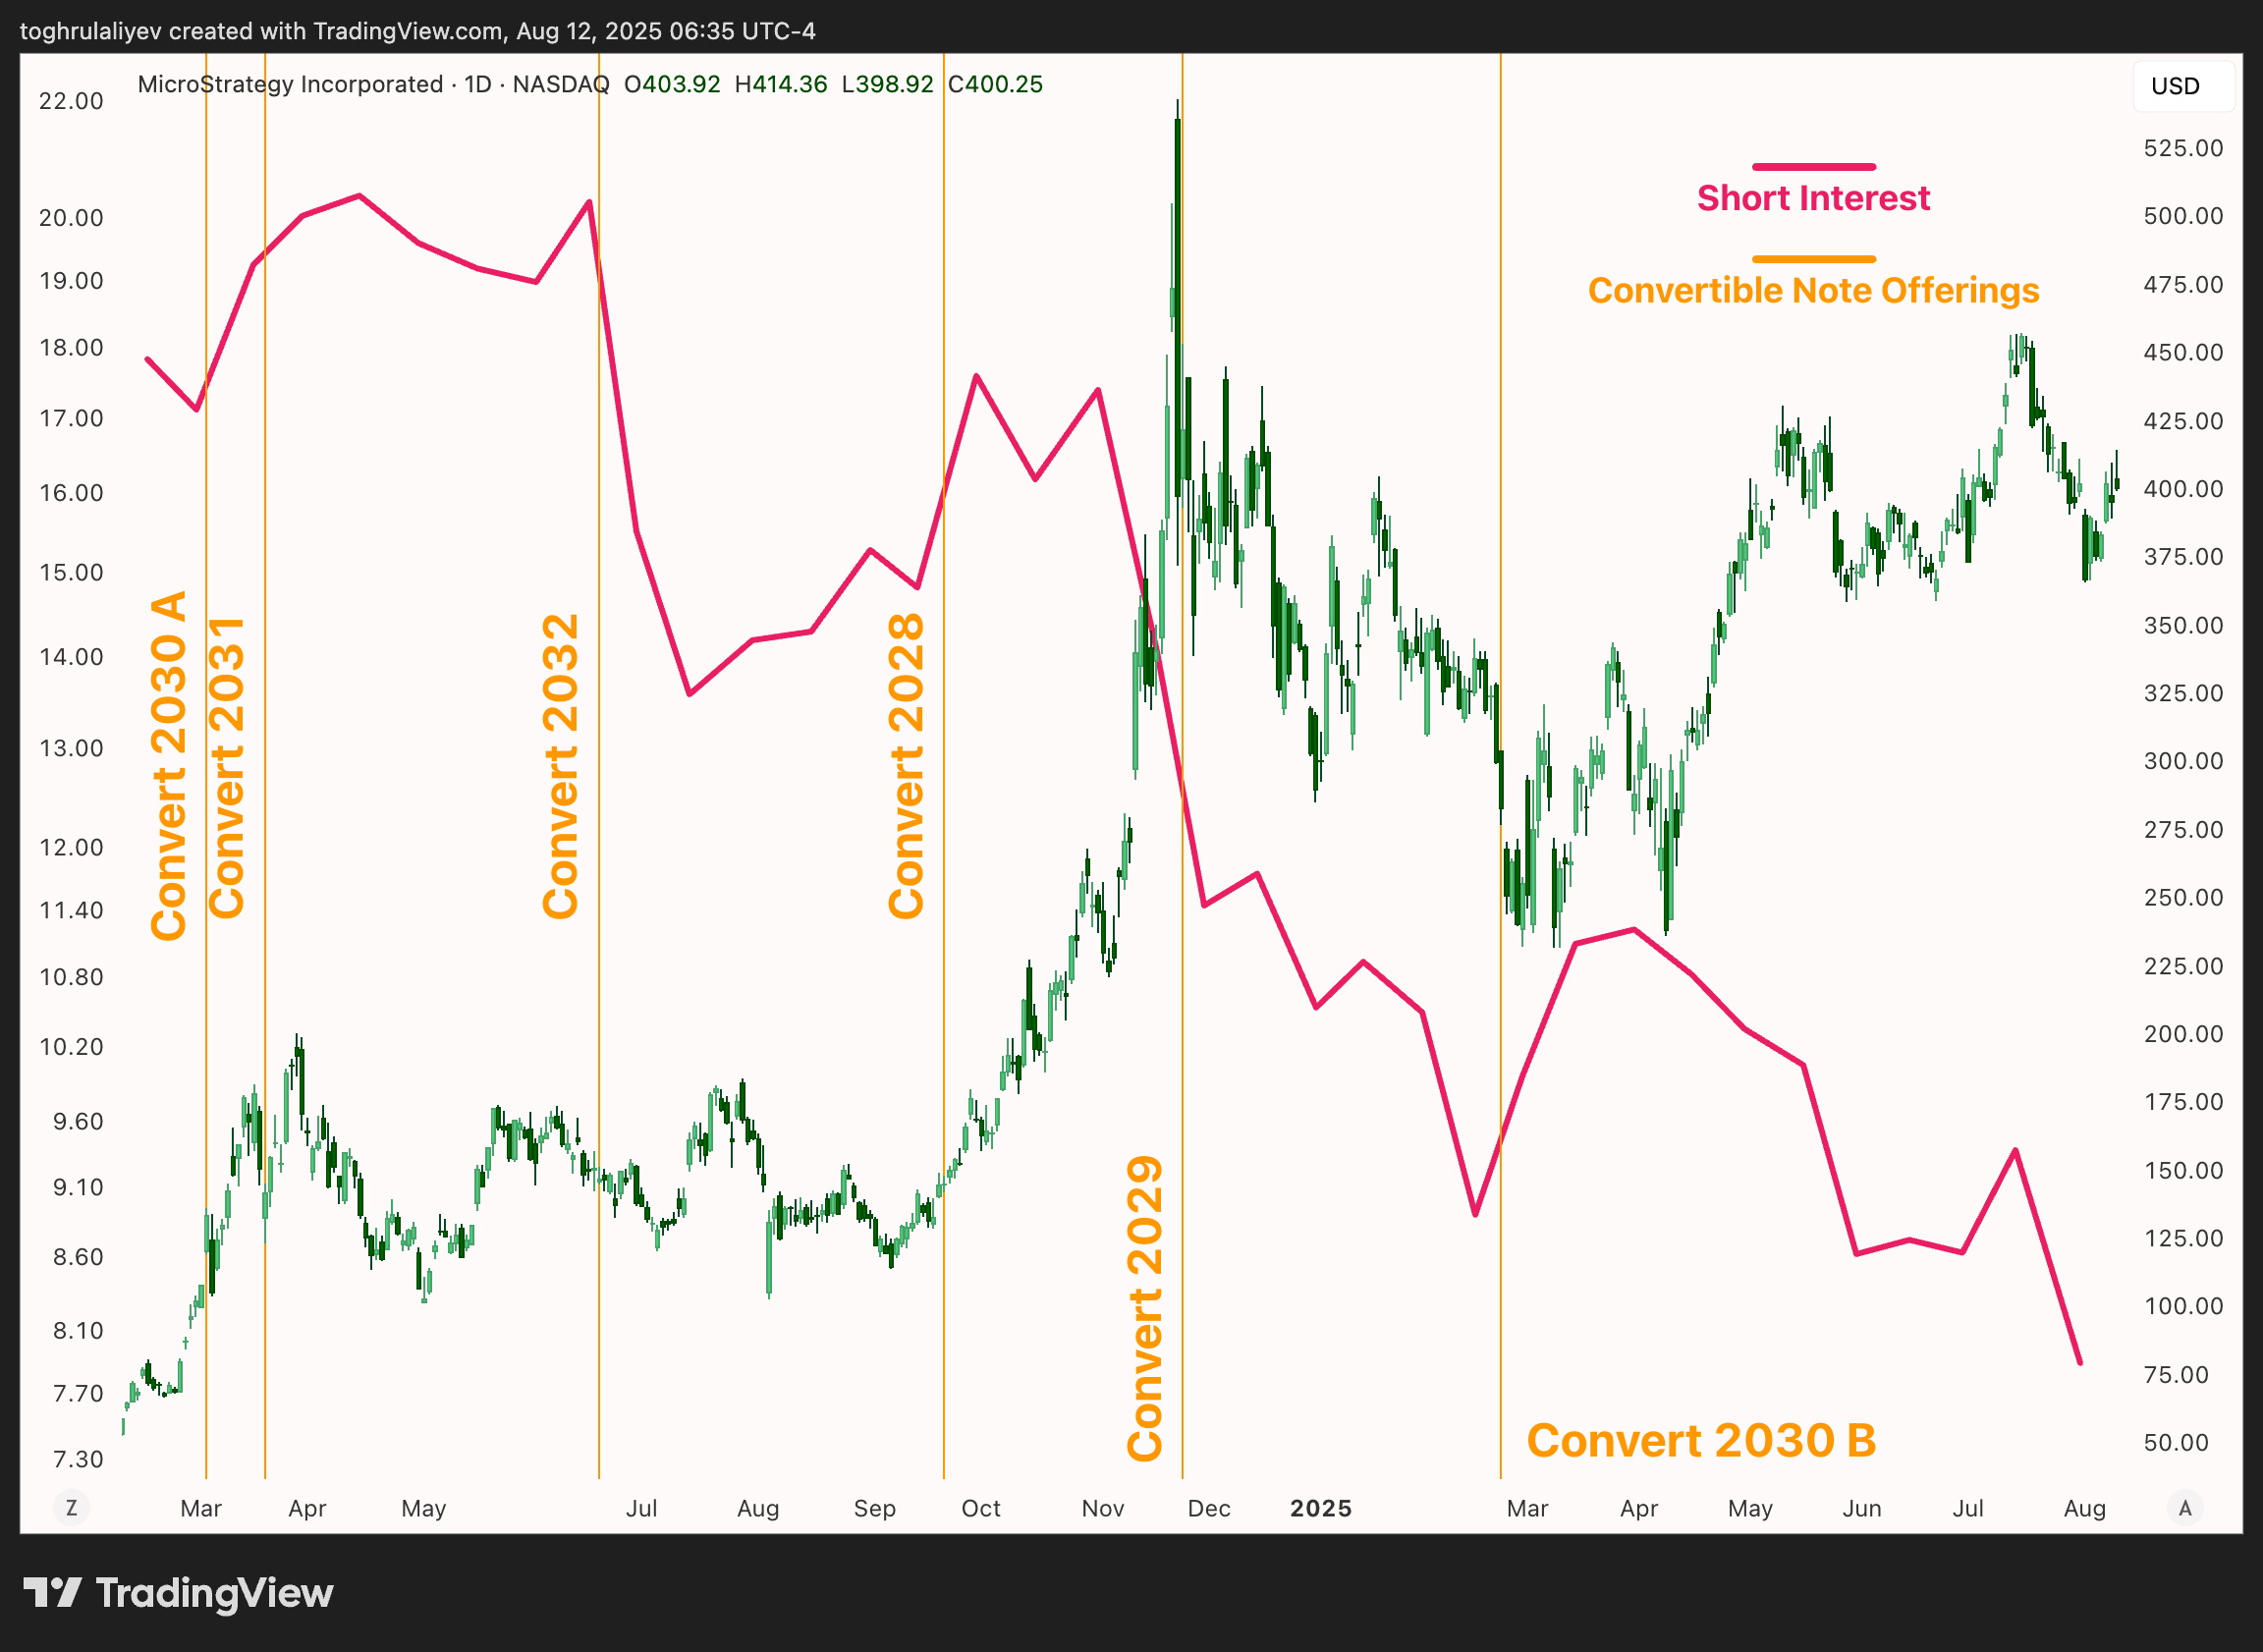
For example, an analysis of market data reveals a recurring pattern following Strategy’s convertible note offerings, where an increase in short interest is the typical outcome. The instances where this trend deviates can be attributed to an unfavorable risk/reward profile for arbitrage strategies.
Figure 30: MSTR Price, Convertible Note Issuance, and Short Interest | Credit: TradingView, Toghrul Aliyev (@itsToghrul)
Furthermore, it is essential to recognize that the aggregate short interest data includes not only arbitrage positions but also directional bets from other market participants. Nonetheless, the overall pattern is still visible.
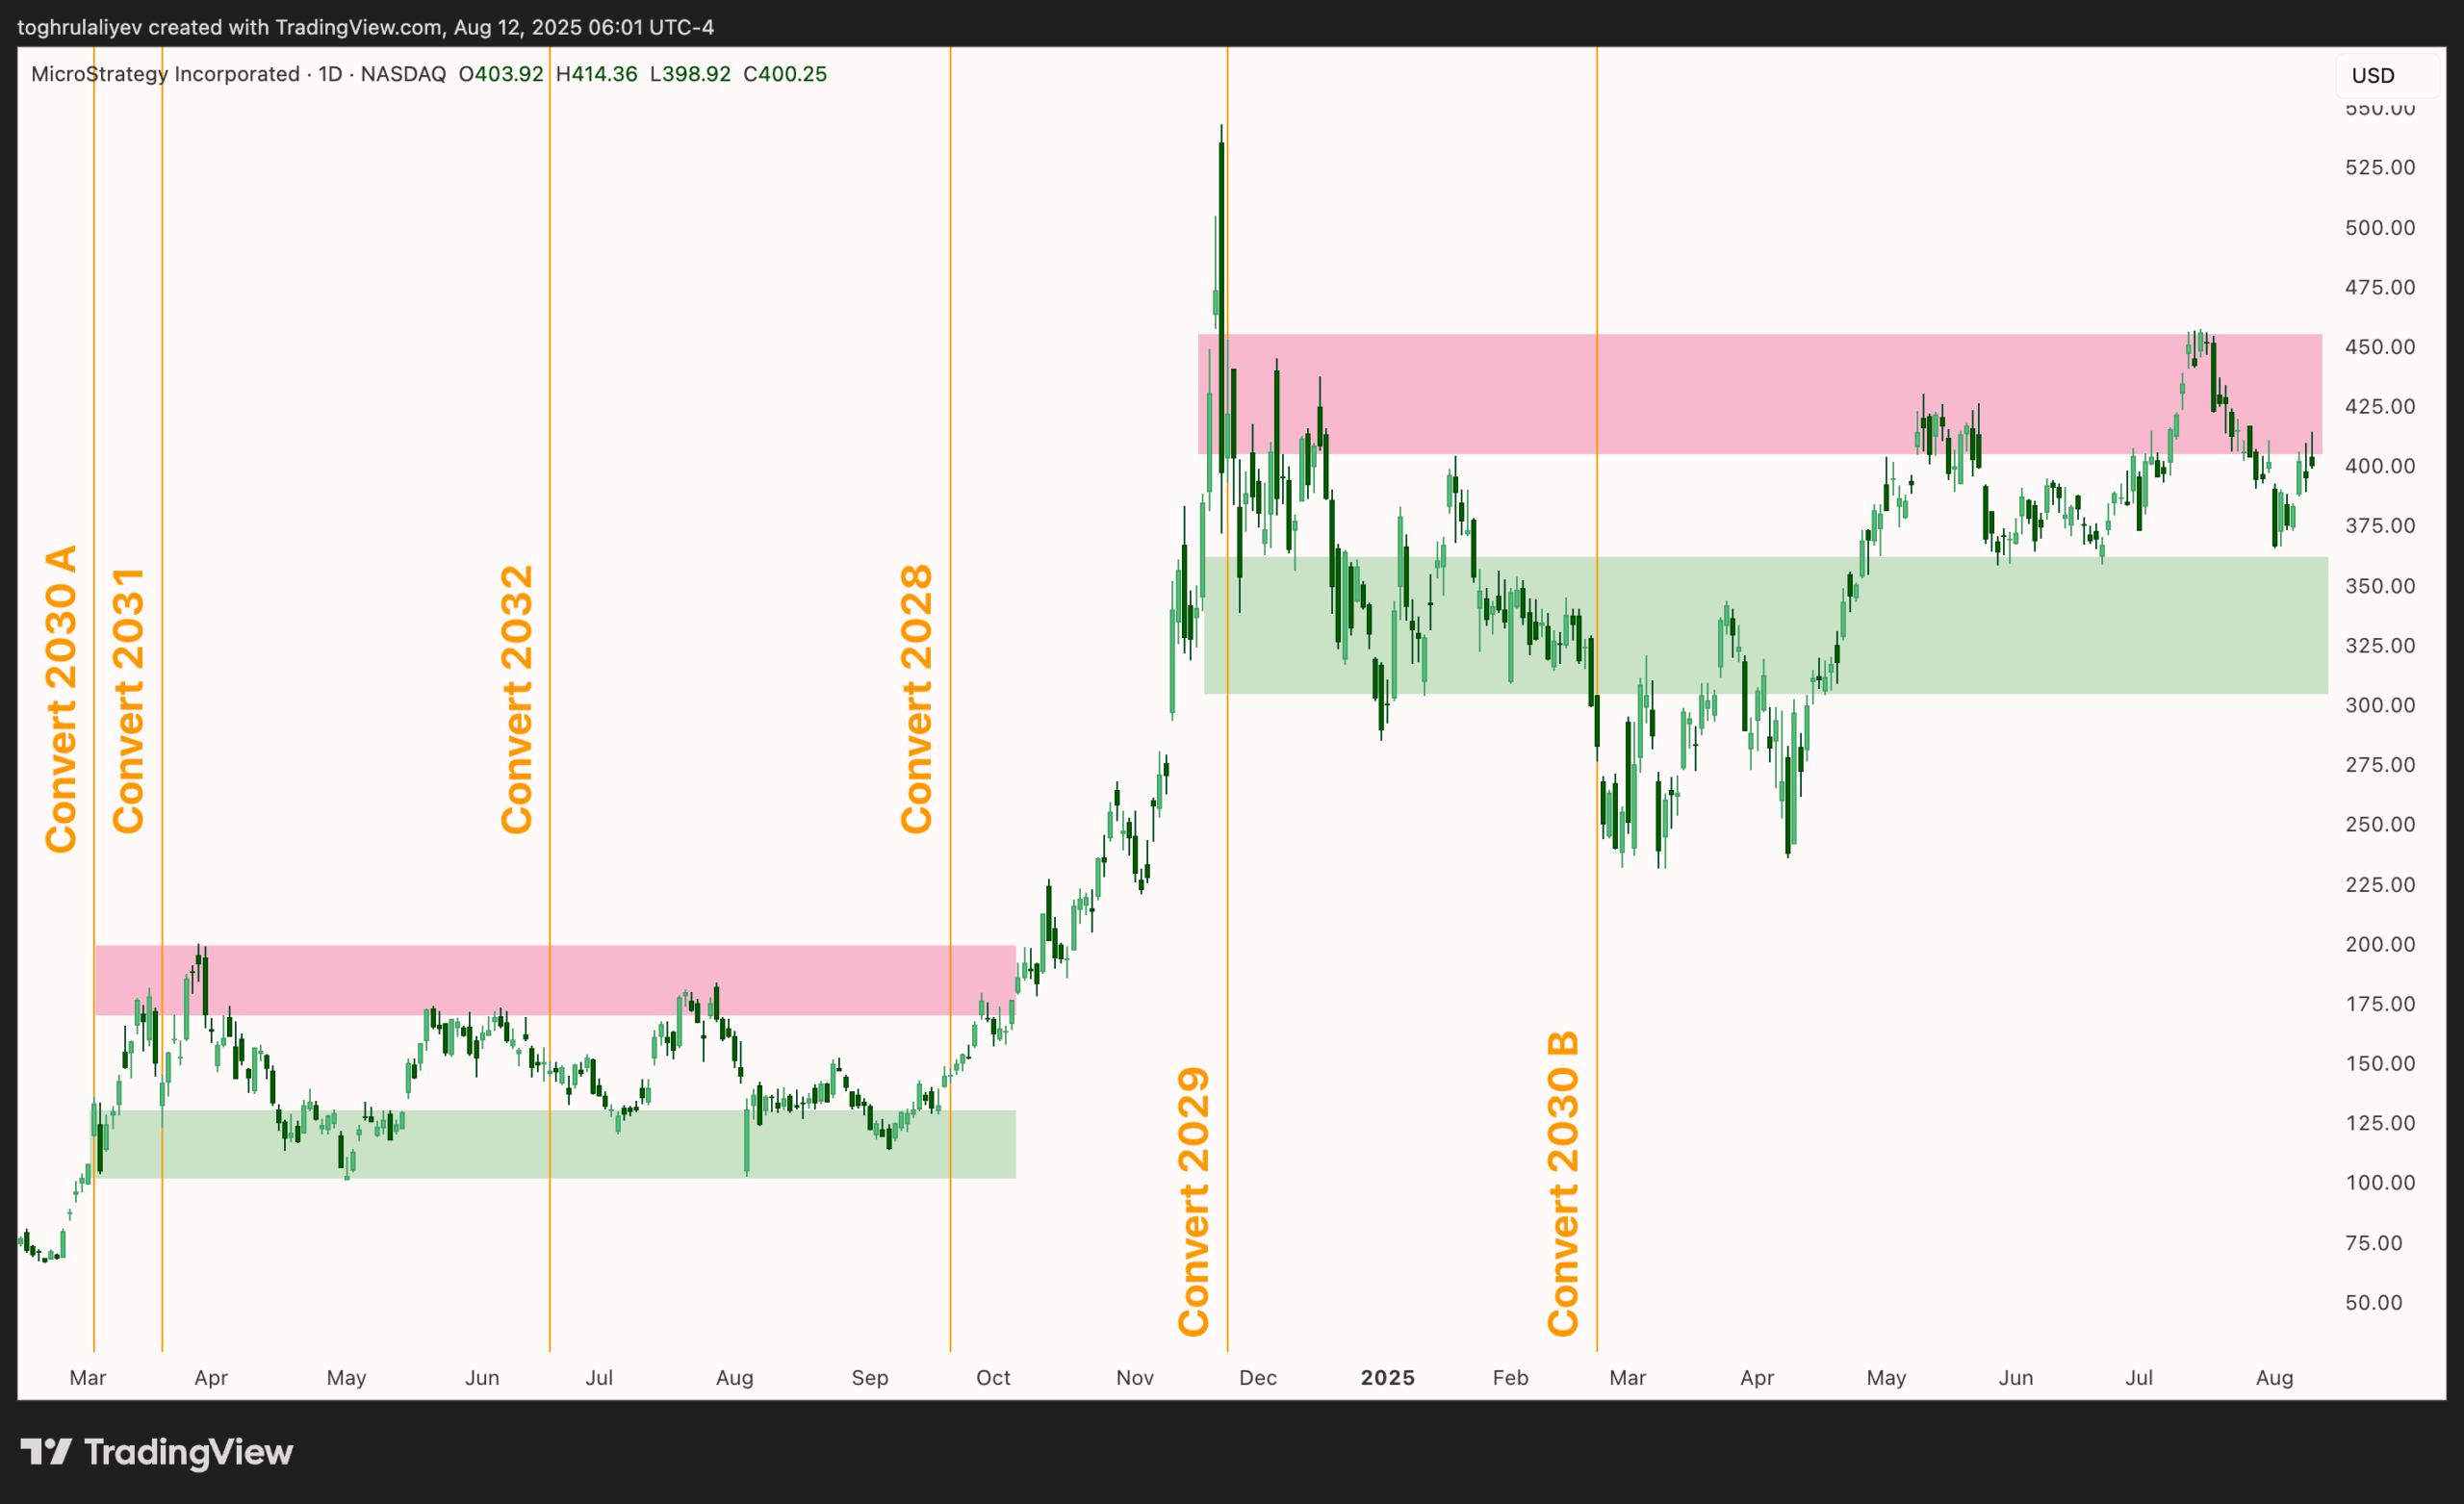
Dynamic hedging by a large contingent of market participants reduces MSTR’s volatility. Arbitrageurs are systematically selling into strength and buying into weakness, which smooths out the stock’s price action compared to what it would otherwise be.
Looking at Figure 31, the effect is evident. There’s a period from around March to October 2024 where MSTR’s price moves sideways in a fairly clear channel. Then, a new channel seems to form from December 2024 to August 2025. The aggressive move out of that channel in February–April 2025 lines up with the Trump tariff shock, but even with that major event, the price eventually reverted to trading back within the channel’s range.
The company deliberately designed its convertible offerings to appeal to arbitrageurs. It set conversion strikes well out of the money and added capped call features to reduce initial delta, which makes hedging less capital-intensive. By structuring the securities this way, Strategy attracted strong demand and easily secured capital.
Unfortunately, that advantage comes with a cost, as discussed above: each issuance introduces latent short interest into the market. It is a perpetual tug-of-war in which Strategy’s pursuit of cheap financing meets arbitrageurs’ appetite for volatility, and the result is a persistent headwind for the equity.
Competitive Pressures in the Bitcoin Treasury Sector
Back in 2020, Strategy was virtually one-of-a-kind, a publicly traded company using its balance sheet to buy Bitcoin. The rarity gave it a sort of scarcity premium. It was a radical departure from the orthodoxy of corporate treasury management, which has traditionally been anchored in the principles of capital preservation, liquidity management, and risk mitigation through holdings of cash, cash equivalents, and low-yield government debt.
In a market where regulated, institution-friendly avenues for Bitcoin exposure were virtually non-existent, Strategy became the de facto public equity proxy for the world’s largest cryptocurrency. For institutional investors constrained by mandates, retail investors using traditional brokerage accounts, and anyone wary of the complexities of direct crypto custody, buying MSTR stock became the simplest and, for a time, the only viable way to gain exposure to Bitcoin’s price movements. The unique market positioning laid the groundwork for the valuation dynamics that would define the company for the next several years.
However, the success of its Strategy’s capital allocation model and the broader maturation of the cryptocurrency market have inevitably attracted a wave of competitors. By 2024–2025, the industry pivoted to a new reality as dozens upon dozens of companies adopted the Bitcoin Reserve Strategy (BSR). The change was so dramatic that sooner or later, an index such as BSR100 could be created to track 100 public companies following that approach.
The investment arena is no longer a monolith centered on MSTR but a crowded, fragmented field of varied players. Overcrowding has taken shape on three fronts.
Impact of Spot Crypto ETFs on MSTR Demand
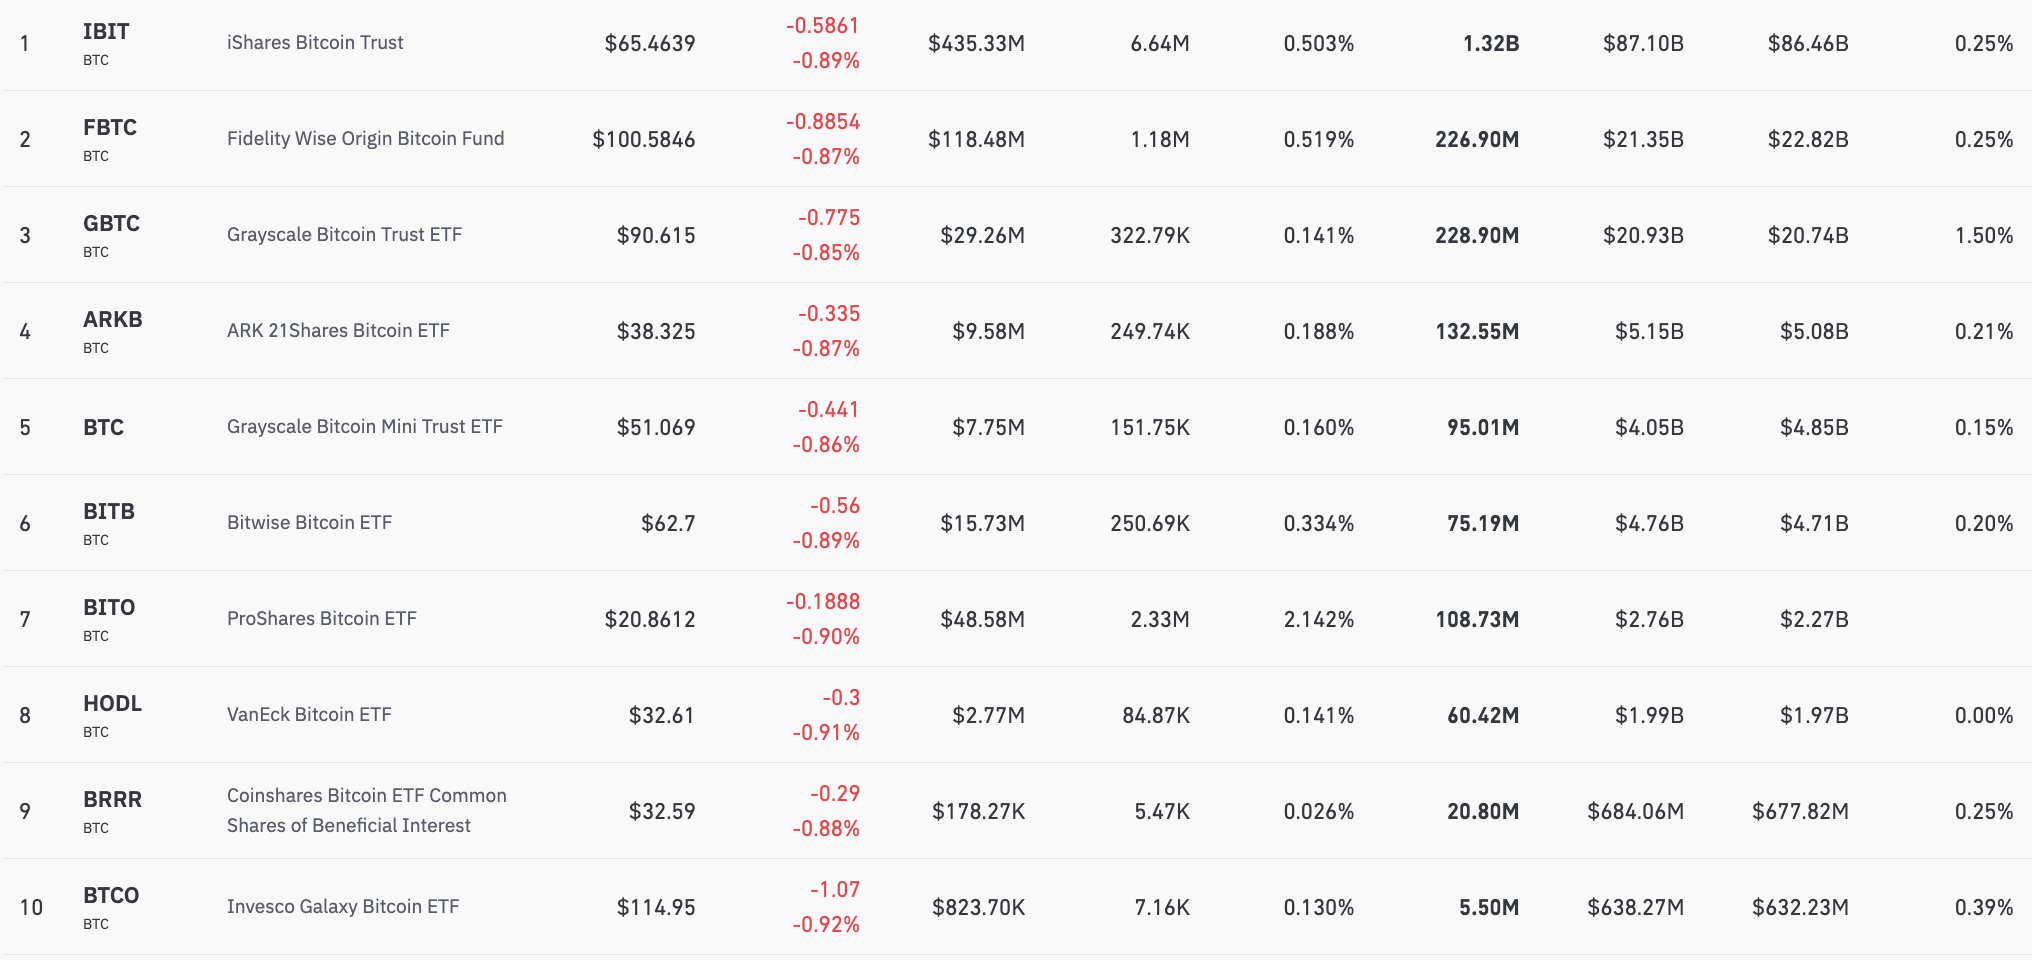
The most direct challenge to Strategy’s proxy status came with the regulatory approval of spot crypto ETFs. For investors whose sole objective is exposure to cryptocurrency prices, ETFs like BlackRock’s IBIT (Bitcoin) are a structurally more efficient vehicle. They offer direct, one-to-one tracking of the asset with high fidelity, low management fees, and none of the idiosyncratic risks associated with an operating company.
For example, IBIT manages $89.5 billion in AUM, with an expense ratio of 0.25% and a near one-to-one correlation with Bitcoin’s spot price. Fidelity’s FBTC offers similar terms with $21.3 billion in AUM and the same 0.25% fee. However, Strategy trades at a premium to its underlying Bitcoin holdings and functions more as a leveraged exposure vehicle than a pure tracker, thereby carrying higher risk.
The arrival of these regulated funds dismantled the very barriers that had once made MSTR the essential gateway for institutional and even retail capital.
Figure 32: Top Bitcoin ETFs | Credit: CoinGlass
The Rise of Bitcoin Treasuries
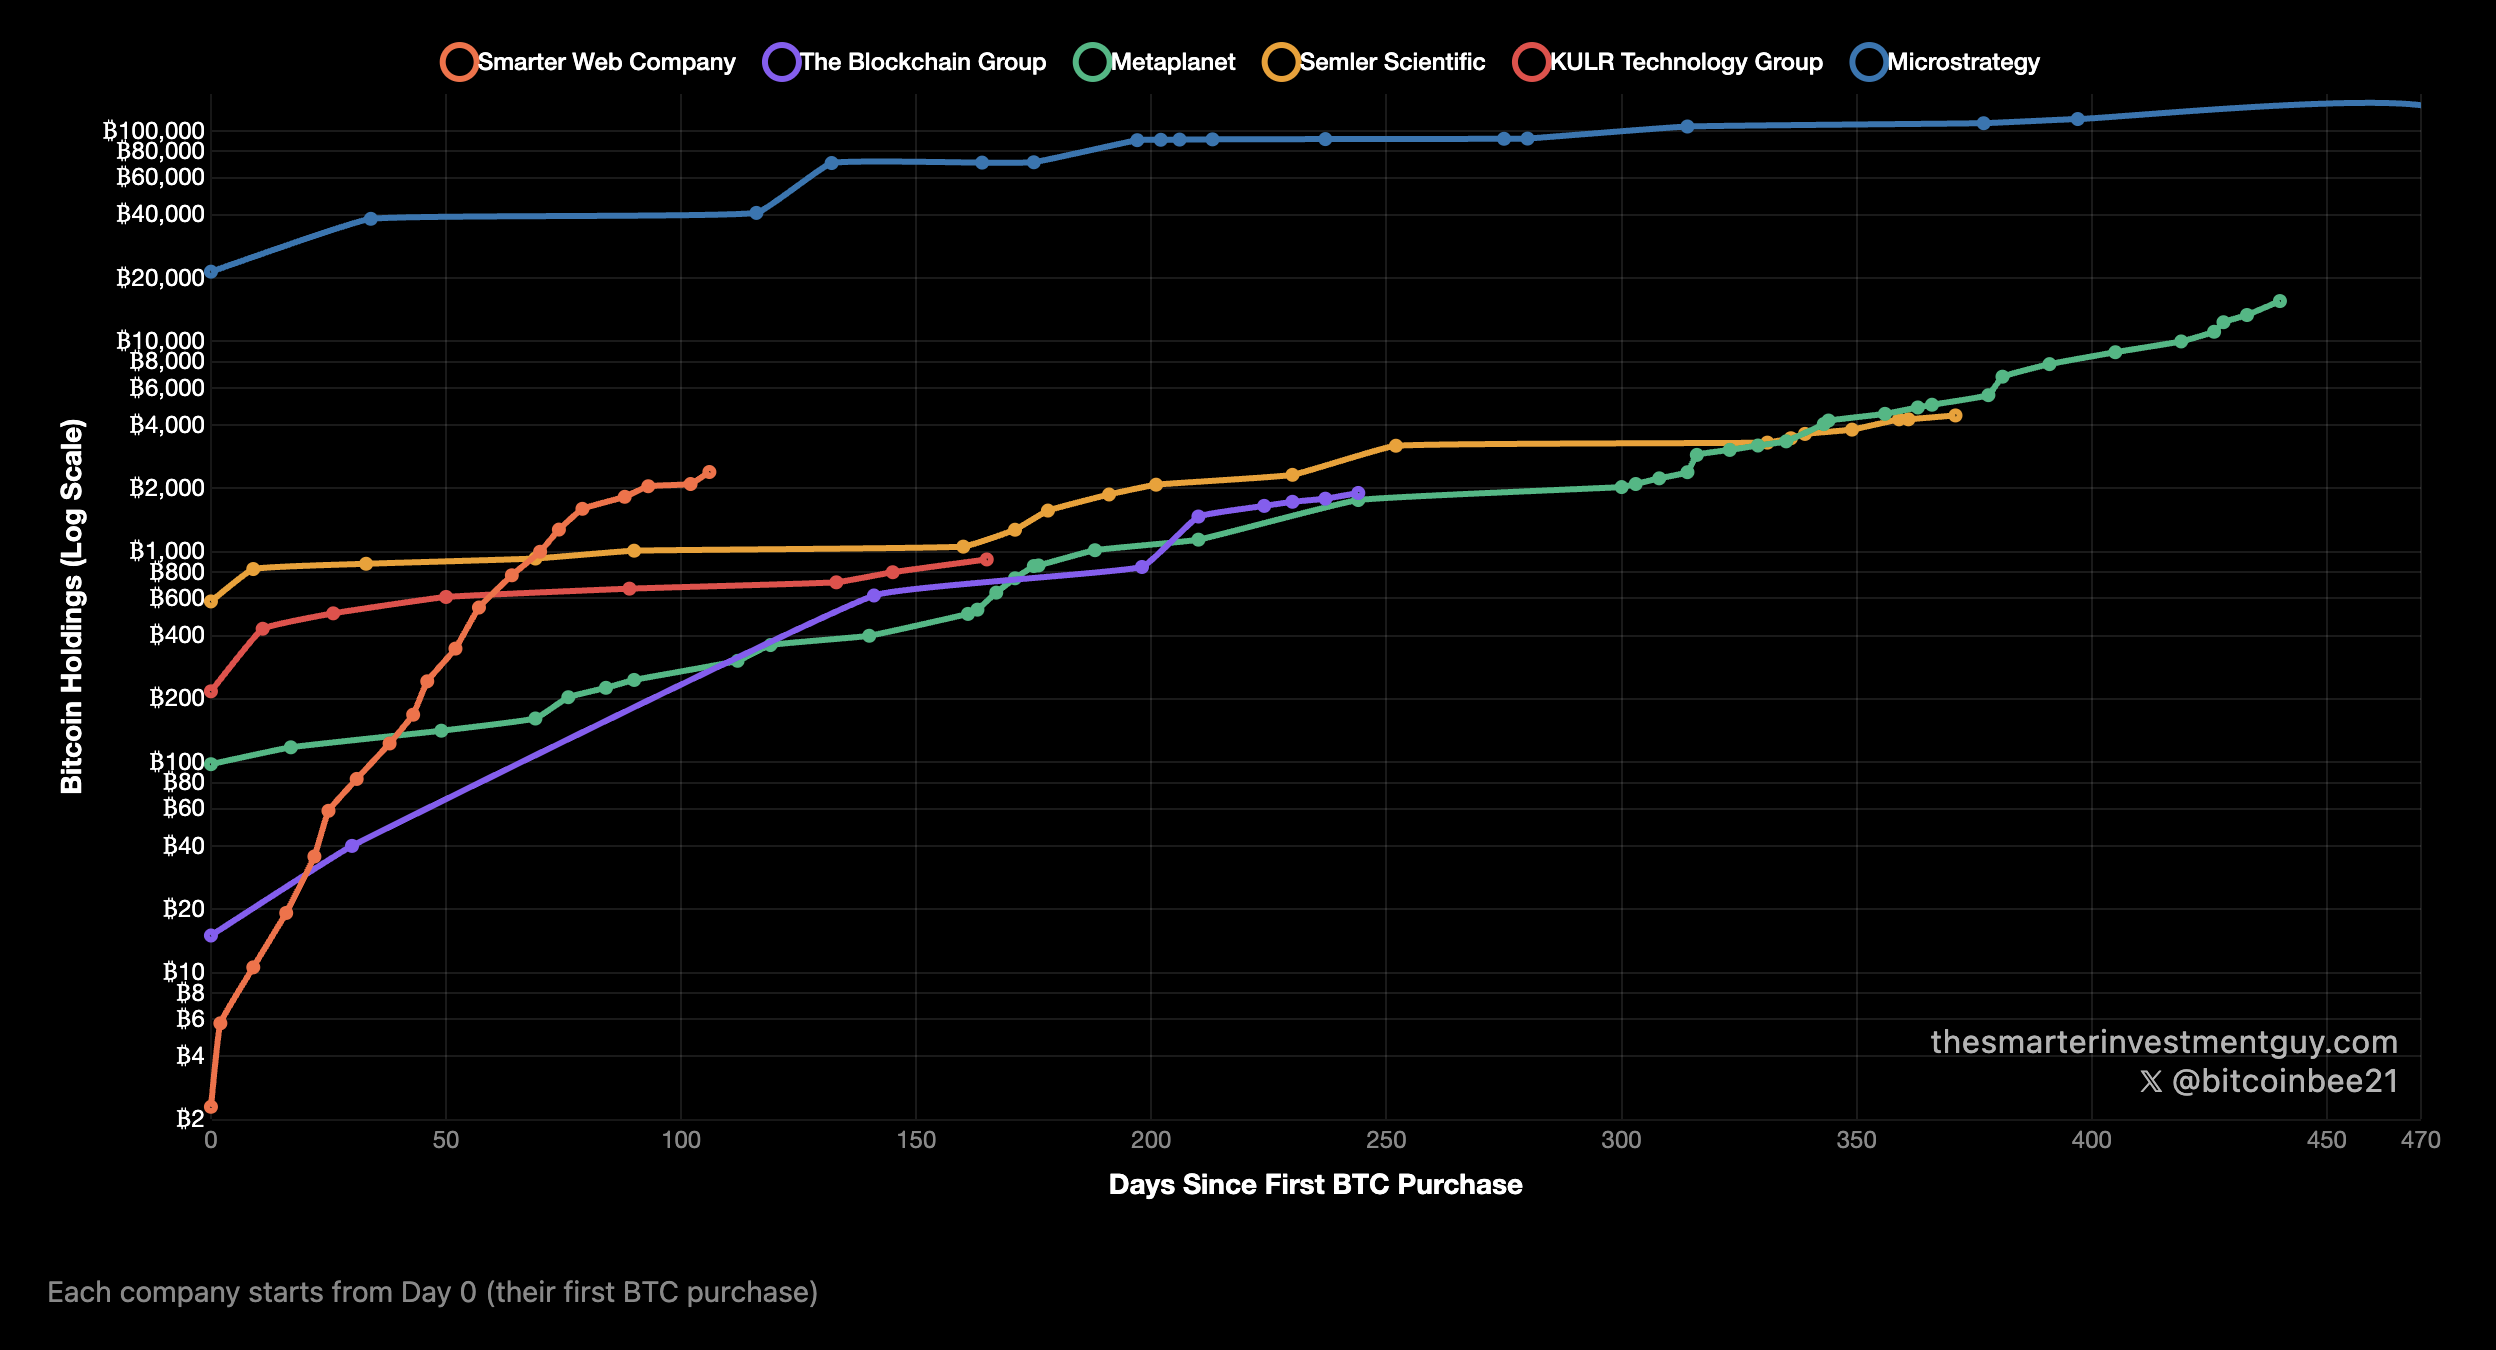
Extraordinary growth in Strategy’s share price and success of its approach inspired many companies to copy the playbook, especially firms with similar business models to MSTR that faced slow growth, stagnation, or decline.
The influx of new contenders like Metaplanet has drawn retail investors into a hunt for the “next MSTR,” capable of delivering exponential gains. Strategy’s market capitalization limits the scale of potential returns. Moving a $100 billion company twofold requires $100 billion of value creation, while moving a $5 billion firm requires only $5 billion. Capital flows now shift from MSTR toward smaller, higher-beta opportunities.
Figure 33: Top 100 Public Bitcoin Treasury Companies | Credit: BitcoinTreasuries.NET
The Altcoin Treasury Diversification
To stand out in an increasingly competitive industry, some firms diversified beyond Bitcoin entirely. Sharplink Gaming (SBET) and Bitmine Immersion Technologies (BMNR) pursued an Ethereum Treasury Strategy, while Upexi (UPXI) and DeFi Development (DFDV) adopted a Solana Treasury Strategy.
Such moves created entirely new categories of crypto-proxy stocks, forcing MSTR to compete not only with other Bitcoin plays but also with the appeal of different blockchain ecosystems.
These companies are highly relevant because they represent a direct fragmentation of the capital that once flowed primarily to Strategy. While the specific asset differs, the target audience is fundamentally the same: investors looking for crypto exposure through traditional equities or pursuing higher returns than the underlying asset itself. At the same time, even if the combined market capitalization of competing firms remains well below MSTR’s, diverting 20% of the flows that might otherwise have gone into Strategy still represents a meaningful shift in capital allocation.
The Consequences: A Diffusion of Capital
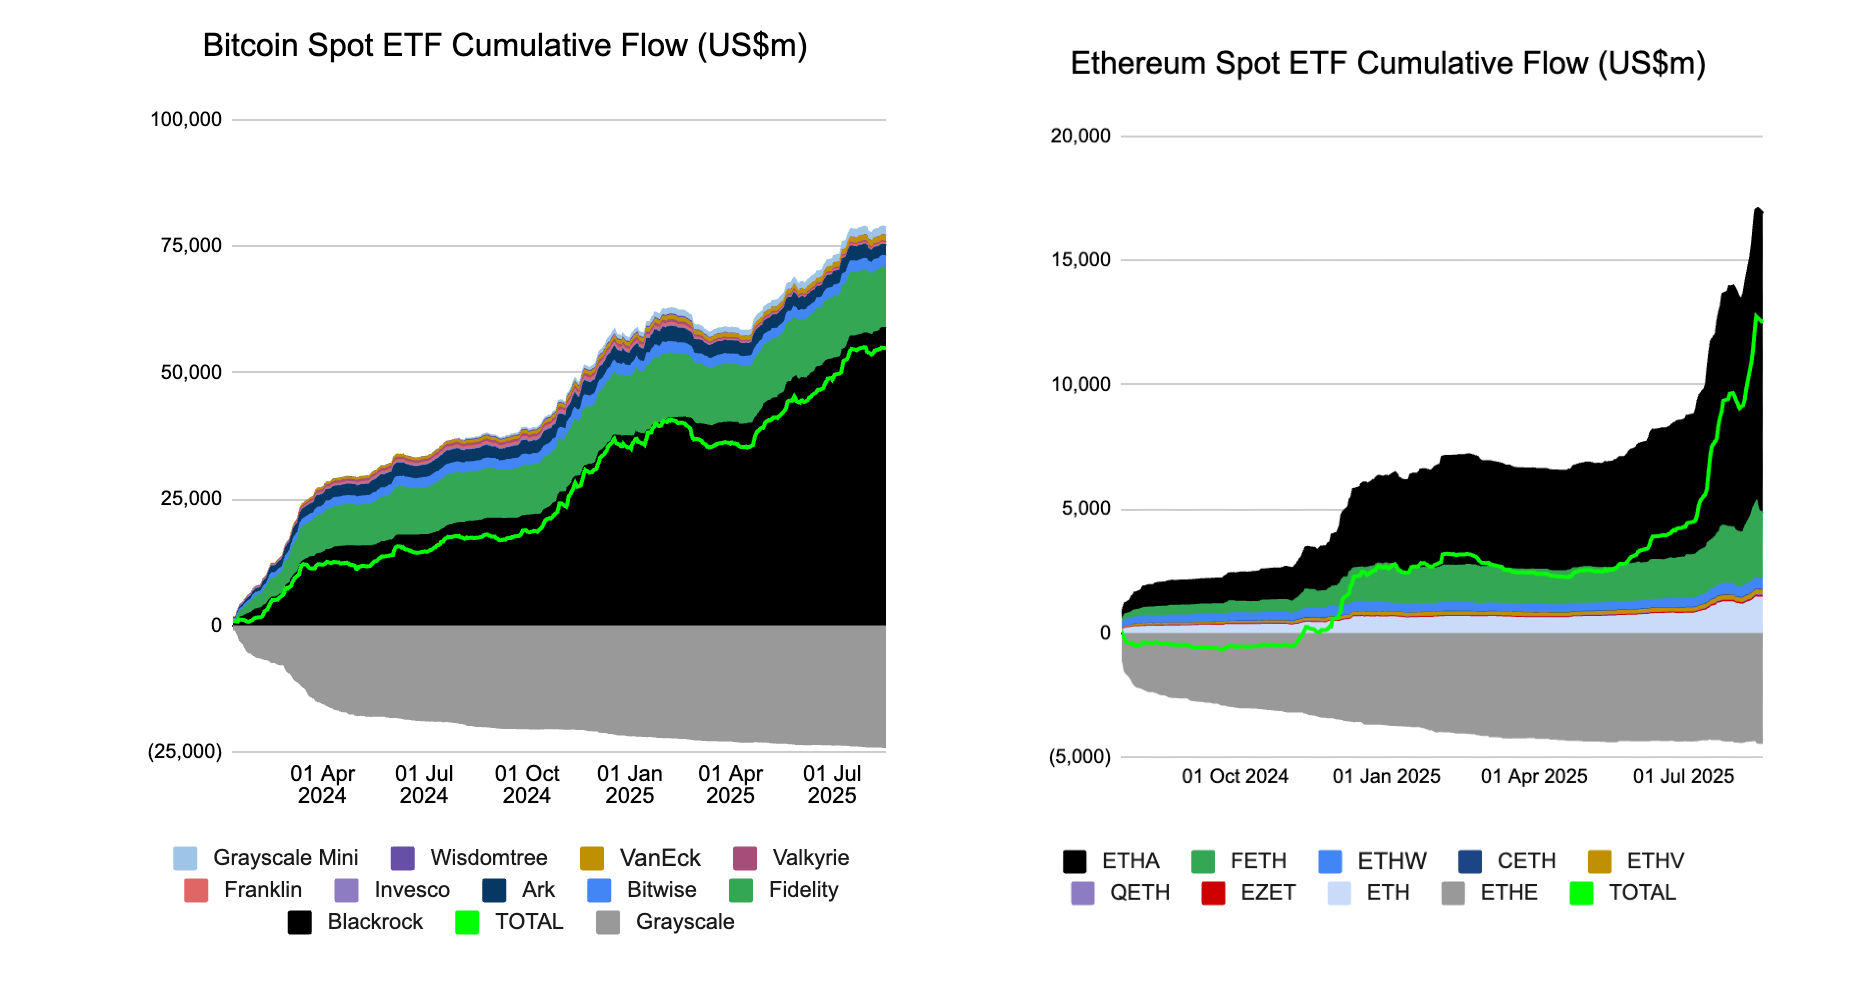
A trifecta of competition has shattered Strategy’s former monopoly on investor capital. As the range of treasury strategies expanded and competition intensified, both retail and institutional capital began to spread across a broader set of vehicles. Funds and investors who once depended on MSTR as their primary route to Bitcoin exposure now face little incentive to keep it at the center of their strategy. The clearest evidence of this shift comes from the surge of capital into crypto ETFs. By mid-August, Bitcoin and Ether funds had already absorbed almost $70 billion in inflows.
Consider an investor with $1,000 to allocate for crypto equity exposure. In 2021, that entire sum likely went into MSTR. By 2025, the same $1,000 might be split: a portion in a Bitcoin ETF for core, low-cost exposure; another part in a smaller BSR company like Metaplanet for higher growth potential; and a third slice in a Solana treasury play like UPXI to capture different ecosystem growth.
As of August 19, MSTR still trades at a 1.62x premium to the value of its Bitcoin holdings. The multiple of Bitcoin net asset value (mNAV) is calculated by dividing the company’s enterprise value, market capitalization plus total debt minus cash, by the value of its Bitcoin holdings, which is simply the number of coins held multiplied by the prevailing market price. Such a premium is difficult to justify when direct alternatives trade at, near, or sometimes even below net asset value, or when their accumulation pace is much faster, referred to as days to cover mNAV.
Capital dispersion is the third major headwind, alongside aggressive ATM share offerings and selling pressure from convertible arbitrage. Investor capital that once concentrated in MSTR now flows into ETFs, smaller Bitcoin treasury firms, and altcoin-focused treasuries. Lower-cost products absorb fee-sensitive demand, while high-beta competitors attract traders seeking outsized returns. The combined effect reduces MSTR’s ability to command inflows by default and places greater weight on its operational strategy and market performance.
As MSTR lost its automatic claim on capital, many investors began searching for alternative frameworks to make sense of its price behavior. One of the most widely circulated is the Ballistic Acceleration Model, which attempts to explain and forecast MSTR’s price trajectory.
Why the Ballistic Acceleration Model Fails as an MSTR Price Predictor
The Ballistic Acceleration Model was first detailed on the MicroStrategist blog in November 2024 by Marty Kendall. It emerged from observing that after Strategy’s Bitcoin pivot, MSTR’s share price moved in near lockstep with Bitcoin but with increasing statistical elasticity.
In simple terms, MSTR’s gains (and losses) outpaced Bitcoin’s by a growing factor. Kendall quantified this by plotting MSTR’s price against Bitcoin’s price on a logarithmic scale, which revealed that a linear correlation (i.e., constant elasticity) was not the best fit. Instead, a second-order polynomial (quadratic) fit on log–log axes gave an extraordinarily tight correlation. In equation form, the model can be expressed as:
This implies an accelerating relationship: As Bitcoin’s log-price rises, the quadratic term becomes more influential, pushing MSTR’s log-price upward at an increasing rate. For example, at a projected Bitcoin price of $216,000, the model estimated MSTR would trade near $3,500 per share.
The positive squared-term coefficient (+0.5988) mathematically means the curve opens upward. The slope (or elasticity) of MSTR with respect to BTC increases as BTC rises. This mathematical feature is what gives the model its “ballistic” or “accelerating” character.
A simple log–log linear model, with a fixed exponent, still performed well (R² ≈ 0.86) but consistently underpredicted MSTR during strong Bitcoin rallies. The quadratic model, by contrast, achieved an R² of 0.974 over that period, which is a high correlation, and a very low Akaike Information Criterion (AIC = –679), indicating excellent model quality relative to its complexity.
Kendall also tested up to third-order polynomials. A cubic fit would have improved the AIC further (to –702) but was deemed overfit and “discarded” in favor of the quadratic. So, even the model’s author recognized the danger of chasing statistical perfection into the realm of absurdity. Instead, the quadratic was presented as a sweet spot: bullish enough to capture the recent trend, but not so overfit as to lose plausibility.
To bolster the model’s appeal, Kendall crafted a colorful narrative analogy. Michael Saylor, Strategy’s CEO, studied aeronautical engineering at MIT, so Kendall framed the relationship in ballistic rocket terms.
In this story, Bitcoin’s price is the horizontal velocity of a projectile (steady on a log chart), while Strategy’s price is the vertical motion under constant acceleration, a quadratic function of time. Saylor is cast as the “rocket scientist” who deliberately engineered MSTR’s capital structure as a kind of financial rocket to accelerate away from Bitcoin’s gravity. The analogy is engaging but risks making the model seem more credible than it is.
Truthfully, the quadratic fit was a descriptive curve-fit of recent market behavior, but the rocket story gave it an aura of scientific inevitability, which resonated with the crypto community’s fondness for moonshots.
Even after Kendall updated the model, the fundamental issues of a quadratic fit did not change. In a blog post titled “Has the MSTR Ballistic Acceleration Model Broken?“, Marty Kendall himself addressed the question of the model’s validity after MSTR did not follow BAM’s unrealistic predictions. While he argued the model was not broken, he acknowledged that other factors needed to be considered because “the game has changed”.
The updated model presented in the blog post had a different equation than the original one:
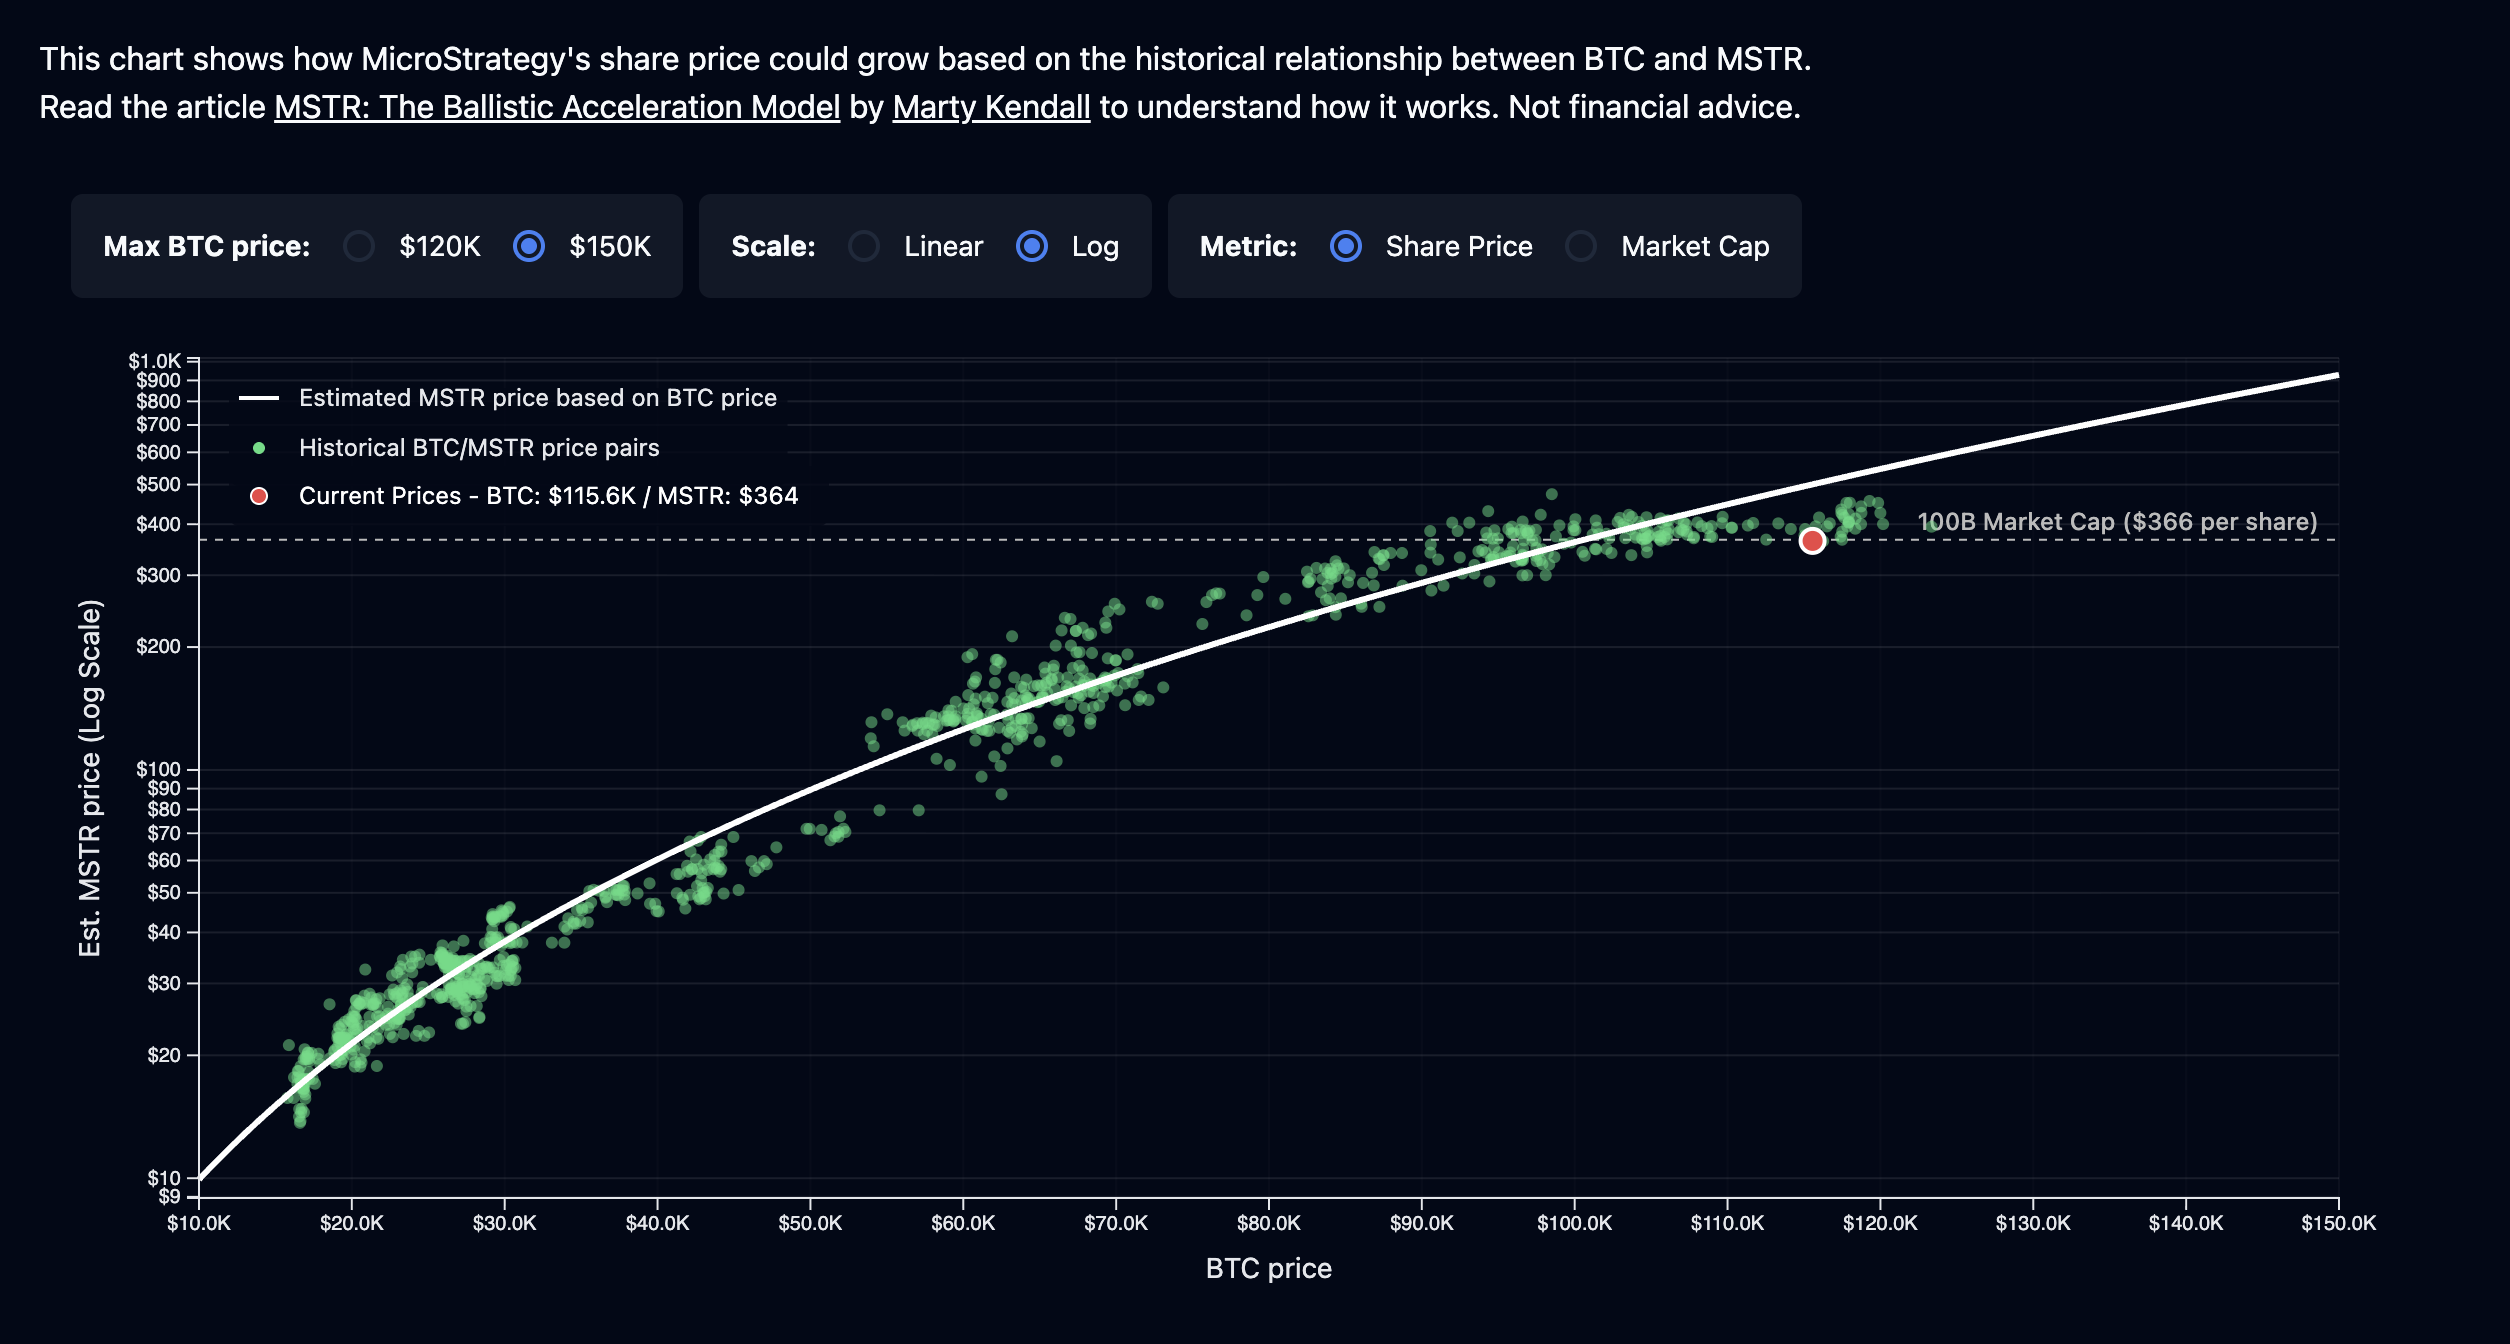
In practice, the revision clipped the model’s reach. Instead of projecting far into the distant future, it now caps out at a Bitcoin price of about $150,000, which implies an MSTR share price near $928. The adjustment makes the framework appear more realistic than before, although in our view it still leans toward optimism. Why that optimism is misplaced becomes clear in the next section.
However, the post does not explicitly explain why the formulation changed. It simply notes that as more data became available, the strength of the relationship continued to increase, but the model’s predictions had decreased since November due to a drop in “BTC Yield”.
The need for updates shows that the Ballistic Acceleration Model is not stable as a predictor. A framework that must be revised to fit each new dataset can describe past moves, yet it cannot provide reliable guidance for the future. The quadratic curve gives the impression of inevitability, but its flaws become clear once we turn to the problem of polynomial extrapolation.
The Fundamental Problem: Polynomial Extrapolation Instability
Polynomial extrapolation instability is the crux of why the ballistic model fails as a forecasting tool. A polynomial can look excellent in-sample because higher-order terms let it interpolate the training range closely, but once you push beyond that range, those same terms dominate the dynamics, and the curve shoots off in directions the data never justified. In numerical analysis, this is a textbook pathology: as the degree rises, polynomial fits become erratic near boundaries and outside the fitted domain, a behavior classically illustrated by Runge’s example and by standard warnings against extrapolating polynomial regressions beyond the data scope.
Hawkins (2004) gives the statistical foundation for this failure mode. He defines overfitting as using a model that is more flexible than necessary or one that includes irrelevant components. Both inflate apparent fit while degrading out-of-sample performance. Unneeded polynomial terms are a canonical instance of “excess flexibility,” so the instability you see on extrapolation is not an accident but a predictable consequence of violating parsimony.
This is a general modeling principle, precisely the kind of principle the ballistic specification breaks when it leans on polynomial curvature to explain relationships it cannot reliably project.
Simply put, inside the sample, curvature buys you fit. Outside the sample, it buys you implausible growth. That is why the ballistic model can produce a forecast in which Strategy’s market capitalization rises to more than half of Bitcoin’s, which the author himself calls “somewhat ludicrous,” he nonetheless rationalizes it as making sense. A model that predicts its own demise cannot be considered correct in the long term.
The forecast looks internally consistent because the algebra demands it as the higher-order terms take over, not because economics supports it. Econometric and machine-learning literatures treat this as a bias-variance and interpolation-versus-extrapolation problem: flexible models reduce bias in-sample at the cost of exploding variance out-of-sample, so their projections deteriorate rapidly once you leave the data’s domain.
Another limitation is the lack of grounding in economic fundamentals. The Ballistic model is purely phenomenological, meaning it fits what was observed, but it doesn’t explain why beyond referencing the reflexive mechanism. There is no underlying economic principle or fundamental law that dictates a company’s stock must follow a quadratic function of an asset price indefinitely.
Ballistic models’ use for forward-looking valuation or timing decisions risks misleading investors with mathematically neat but economically hollow projections. A more durable framework is one that is both empirically accurate and theoretically anchored, such as the power law formulation, which has decades of cross-disciplinary validation and a coherent scaling-law basis.
Why Power Laws Capture MSTR’s Price Behavior Better
Power Laws as a Universal Pattern
A power law is a mathematical relationship between two quantities where one is proportional to a fixed power of the other. The general form is y = ax². Such relationships are ubiquitous in nature and social systems, from GDP distributions and city populations to the scaling of metabolic rate with body mass and the growth of teeth. They are characteristic of stable, anti-fragile systems governed by iterative feedback processes where the output of one cycle becomes the input for the next.
Figure 37: Zipf’s Law for National Gross Domestic Products 1900-2008 | Credit: Matthieu Cristelli, Michael Batty, Luciano Pietronero
Figure 38: World City Populations for 8 Countries | Credit: Brendan O’Connor
Figure 39: Kleiber’s Law Scaling of Metabolic Rate with Body Size | Credit: Albert Thommen, Steffen Werner, Olga Frank et al
Figure 40: Comparative Tooth Shape and Growth Scaling Across Species | Credit: Alistair R. Evans, Tahlia I. Pollock, Silke G. C. Cleuren, et al
The most profound consequence of a system being governed by a power law is scale invariance. This means that the system’s fundamental growth pattern remains the same regardless of the scale at which it is observed. The power law equation behaves the same way whether x is tiny, huge, or somewhere in between. A fractal, for example, exhibits the same patterns whether viewed from a distance or up close.
Bitcoin Through the Lens of a Power Law
For Bitcoin, scale invariance implies that its growth trajectory should follow a predictable path as it expands over many orders of magnitude in value. When plotted on a log-log chart, a true power law relationship appears as a straight line, which visually demonstrates consistent and scalable growth.
Figure 41: Bitcoin Power Law Corridor | Credit: Giovanni Santostasi
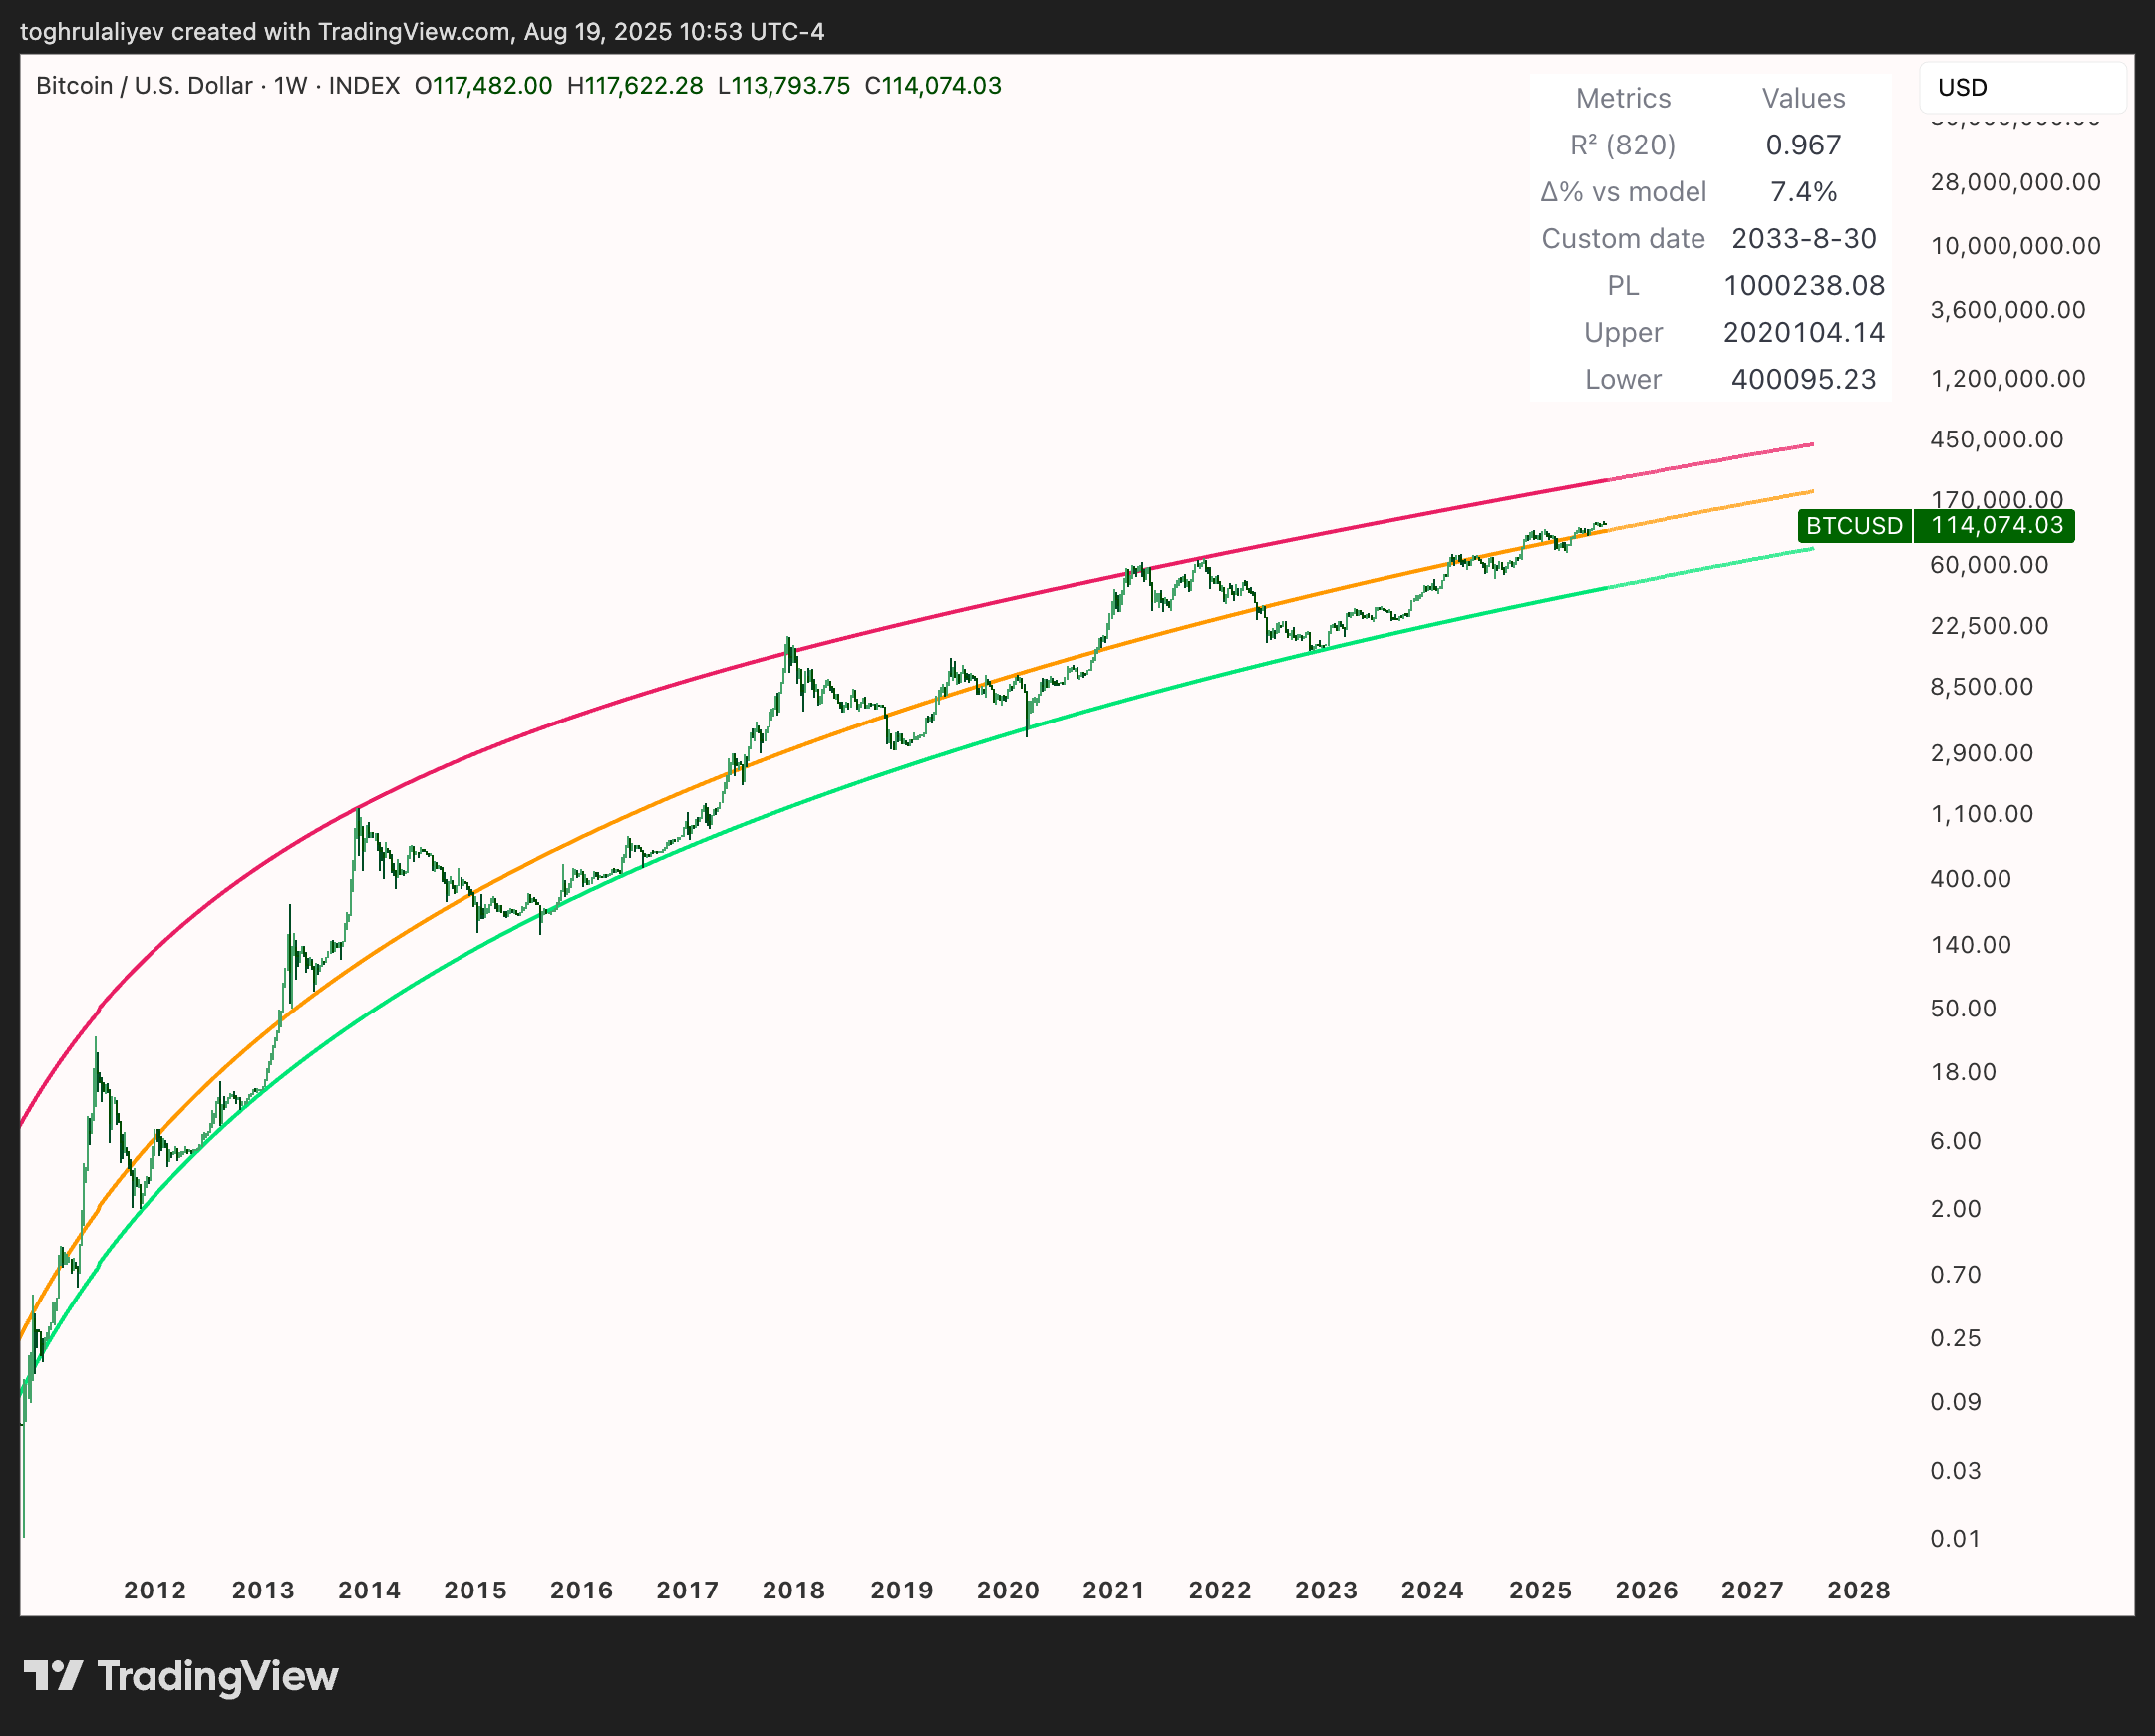
In Dr. Toghrul Aliyev’s version, built on TradingView, the price axis (y) is log-scaled but the time axis (x) is linear, so the power law curve bends gently upward over time rather than forming a perfect straight line. The visual difference doesn’t change the underlying relationship. It simply reflects how time is displayed.
Figure 42: Bitcoin Power Law | Credit: TradingView, Toghrul Aliyev (@itsToghrul)
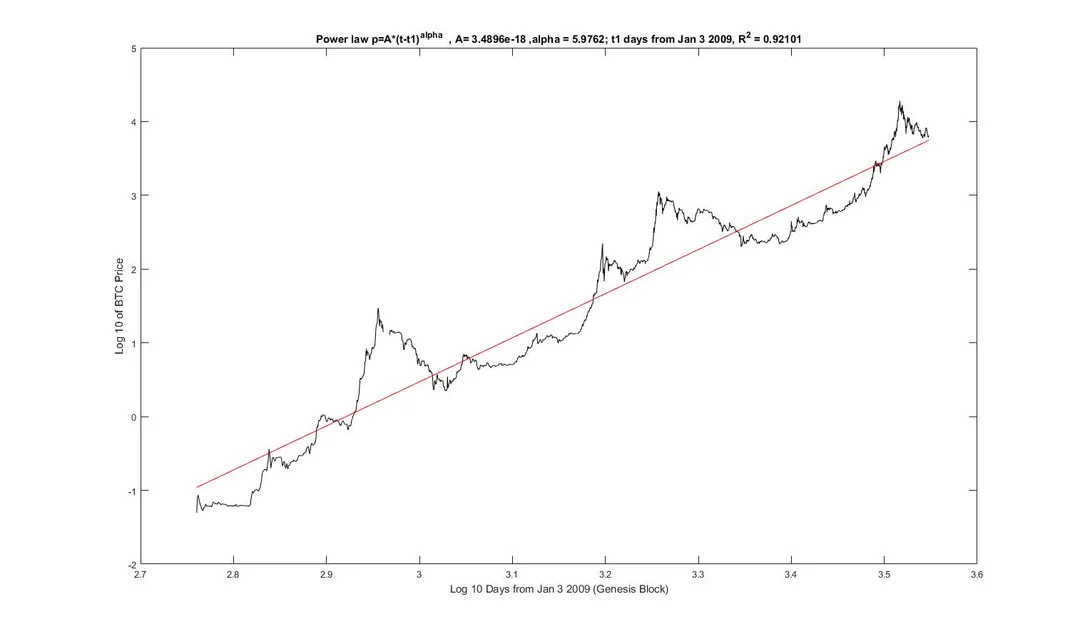
The model comes from Giovanni Santostasi’s work, first proposed in 2018, and has predicted Bitcoin’s price for seven years without any change.
Figure 43: Bitcoin Power Law – First Iteration | Credit: Giovanni Santostasi
BTC Stock-to-Flow and the MSTR ballistic models have needed adjustments to stay aligned with price action. Santostasi’s framework has not been updated because the relationship it captures remains intact. It works without intervention. What’s even better is that the model had an R² of 0.92 at the start, and over time, the fit increased further to 0.967, which only confirms that it reflects a durable market relationship.
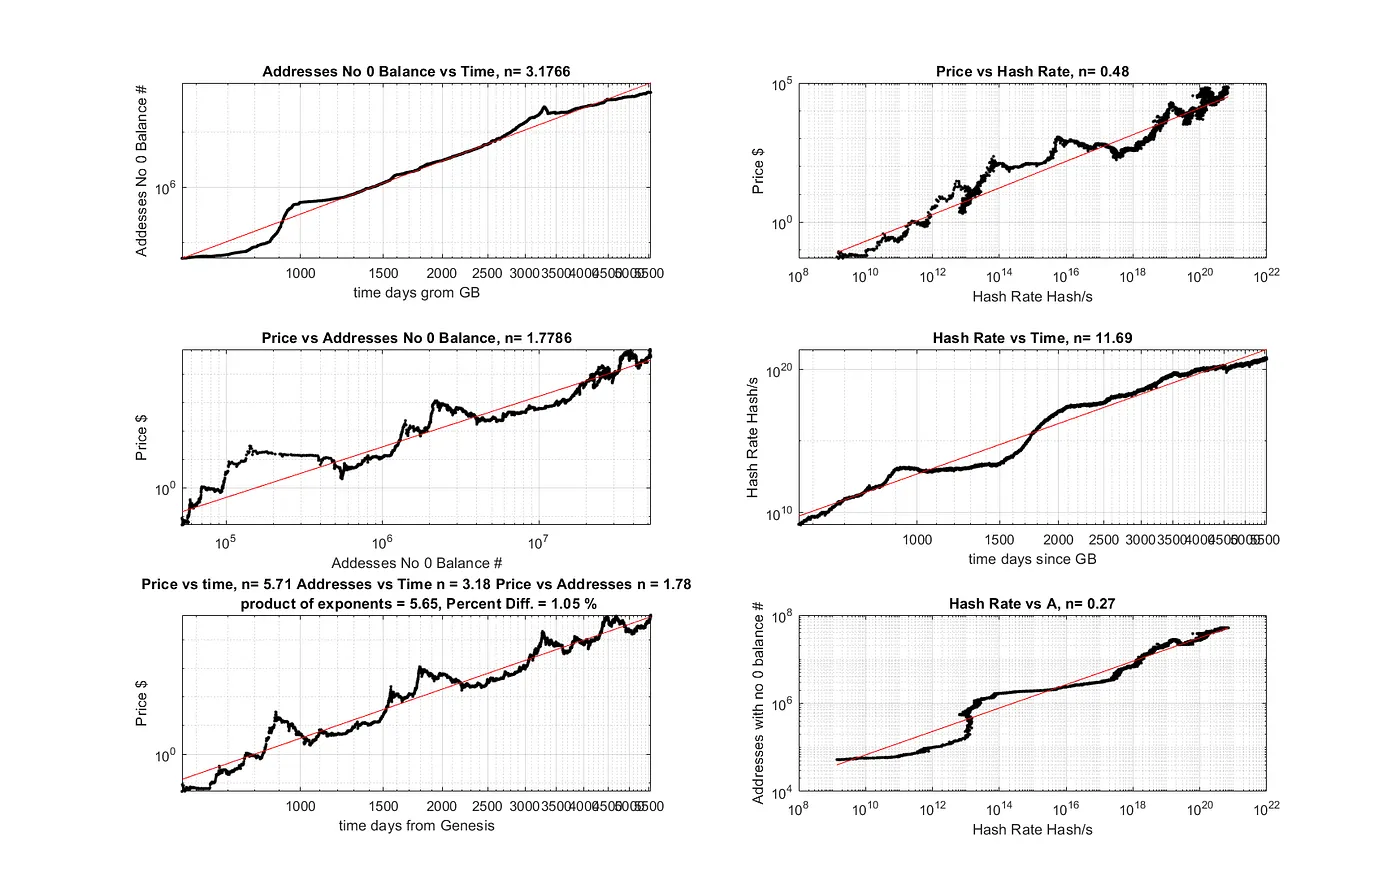
The Bitcoin Power Law Theory (BPLT) is not just a price model. It’s a unified framework that connects several of Bitcoin’s fundamental metrics in a chain of interconnected power laws.
The key relationships are as follows:
1. Adoption vs. Time
The number of active Bitcoin addresses, which is a proxy for user adoption, grows with the cube of time.
Number of Active Addresses ∝ (Time)³
2. Value vs. Adoption
The price of Bitcoin grows with the square of the number of users (addresses).
Price ∝ (Number of Active Addresses)²
This is the direct, empirical confirmation of Metcalfe’s Law, a foundational network science principle. It suggests that the value of a communications network is proportional to the square of the number of its connected users.
3. Value vs. Time
By combining the first two relationships, the theory derives its primary long-term valuation model, which links price directly to time.
Price ∝ ((Time)³)² = (Time)⁶
In other words, Bitcoin’s long-term value is a function of its time in existence, as time allows for the power law growth of its network.
4. Security vs. Value
The network’s hash rate, which is a measure of security, is found to be proportional to the square of the price.
Hash Rate ∝ Price²
So, a higher price incentivized more miners to join the network, increasing the hash rate and thus security. Greater security, in turn, makes the network more attractive and trustworthy, supporting higher adoption and value. The whole loop is kept in equilibrium by the network’s automatic difficulty adjustment and the periodic halving of the block reward.
Figure 44: Power Law Relationships Among Bitcoin Price, Hash Rate, Addresses, and Time | Credit: Giovanni Santostasi
The simplicity of BPLT is its greatest strength. It uses the only truly independent and perfectly predictable variable: time, measured in days since the genesis block (January 3, 2009), to model the long-term trend of a highly volatile variable like price.
BPLT also aligns with Bitcoin’s identity as a network. It treats Bitcoin less as a speculative commodity and more as a technology adoption case, where value emerges from Metcalfe’s law and slow, law-like growth. The power law has a reason: more users lead to more value; more time leads to more users. There is an intrinsic fundamental driver (network expansion over time) that one can argue should continue barring external shocks.
Strengths and Drawbacks
The primary strength of the power law model lies in its foundation. It is grounded in first principles, combining laws of network growth with economic intuition, which provides a credibility that pure data-fitting models cannot achieve.
It is also, as mentioned earlier, simple: at its core, just a linear trend on log-log axes (Occam’s Razor friendly). Time serves as the primary input, and network expansion as the main driver. Such parsimony makes the model both testable and falsifiable, since a sustained deviation from the expected path would mark failure. To date, Bitcoin has adhered to the power law with near scientific consistency.
Another strength comes from its anti-fragile structure. The model is rooted in iterative growth, which allows short-term shocks or random fluctuations to fade as long as adoption continues. Bitcoin’s history illustrates this resilience, as the network has survived exchange hacks, government restrictions, and speculative bubbles while continuing to expand its user base and hash power.
The power law does not eliminate volatility, but it implies mean reversion around a strong central tendency. That perspective provides investors with a more reliable guide than precise short-term forecasts, offering a framework to understand where Bitcoin stands relative to its long-run fair value.
The drawbacks of the power law model largely revolve around its broad-brush nature and the assumption that past network growth trends will continue. By design, it is not a short-term predictor. Its weakness is that it models the trend. If one is looking for guidance on what Bitcoin will do in the next 6 months, the power law won’t tell you, as price could be above or below the trend by a factor that the model doesn’t pin down exactly, only that it likely won’t stray beyond certain multiples.
Additionally, there is a possibility of eventual saturation of growth. Power law behavior describes the mid-phase of adoption between the early exponential and the later plateau. If Bitcoin were to reach saturation (e.g., if global adoption neared its limit or growth slowed to GDP rates), the model might transition to a different form, perhaps logistic.
However, Bitcoin’s curbing mechanisms make a logistic saturation unlikely for a very long time. But it’s worth mentioning that no trend lasts forever unabated.
Last but not least, the incorporation of halving cycle oscillations in power law models introduces additional parameters, such as a decaying amplitude factor, which are somewhat ad hoc. These help fit historical peaks but are not as theoretically grounded as the core trend. If future cycles don’t mirror past ones (e.g., if a super-cycle or lengthening cycle occurs), those parametric tweaks might need revision. This, however, doesn’t undermine the central power law. It just means the timing of cycles is a secondary feature that might evolve.
A Power Law Model for Strategy (MSTR)
Even if Bitcoin’s trajectory were to evolve over time, whether through eventual saturation or changing cycle dynamics, its power law trend remains the most coherent framework for anchoring long-term value.
And because Strategy has staked its corporate identity on Bitcoin, that same anchor extends to its stock. MSTR is not an independent asset class. It is a leveraged corporate expression of Bitcoin’s trajectory. Thus, if Bitcoin’s fair value can be described by a power law in time, Strategy’s fair value can be described by a derived power law in Bitcoin’s price. In particular, Giovanni Santostasi expresses MSTR’s valuation as:
MSTR Share Price = 0.000118 * BTC PL Price^1.3
It is not an independent model separate from Bitcoin’s power law, but a dependent scaling function anchored to Bitcoin’s fundamental value. If Bitcoin’s power law fair value grows 2x, MSTR’s growth 2^1.3 = 2.46x. The formula shows that MSTR’s growth is governed by the same law as Bitcoin’s, only amplified by a factor and exponent reflecting Strategy’s leverage and corporate specifics.
The 1.3 exponent is a fixed parameter. It suggests a consistent leverage effect rather than an ever-increasing one. Contrast this with the ballistic model, where the effective exponent grows without bound.
In the power law model, MSTR’s relative valuation to BTC remains proportional over the long term. It’s always 0.000118 * BTC PL Price^1.3, no matter if BTC is $50k or $500k or $5M. That makes the model stable in form. It won’t predict absurd divergences because any exponential growth in Bitcoin is tempered by a constant exponent for MSTR.
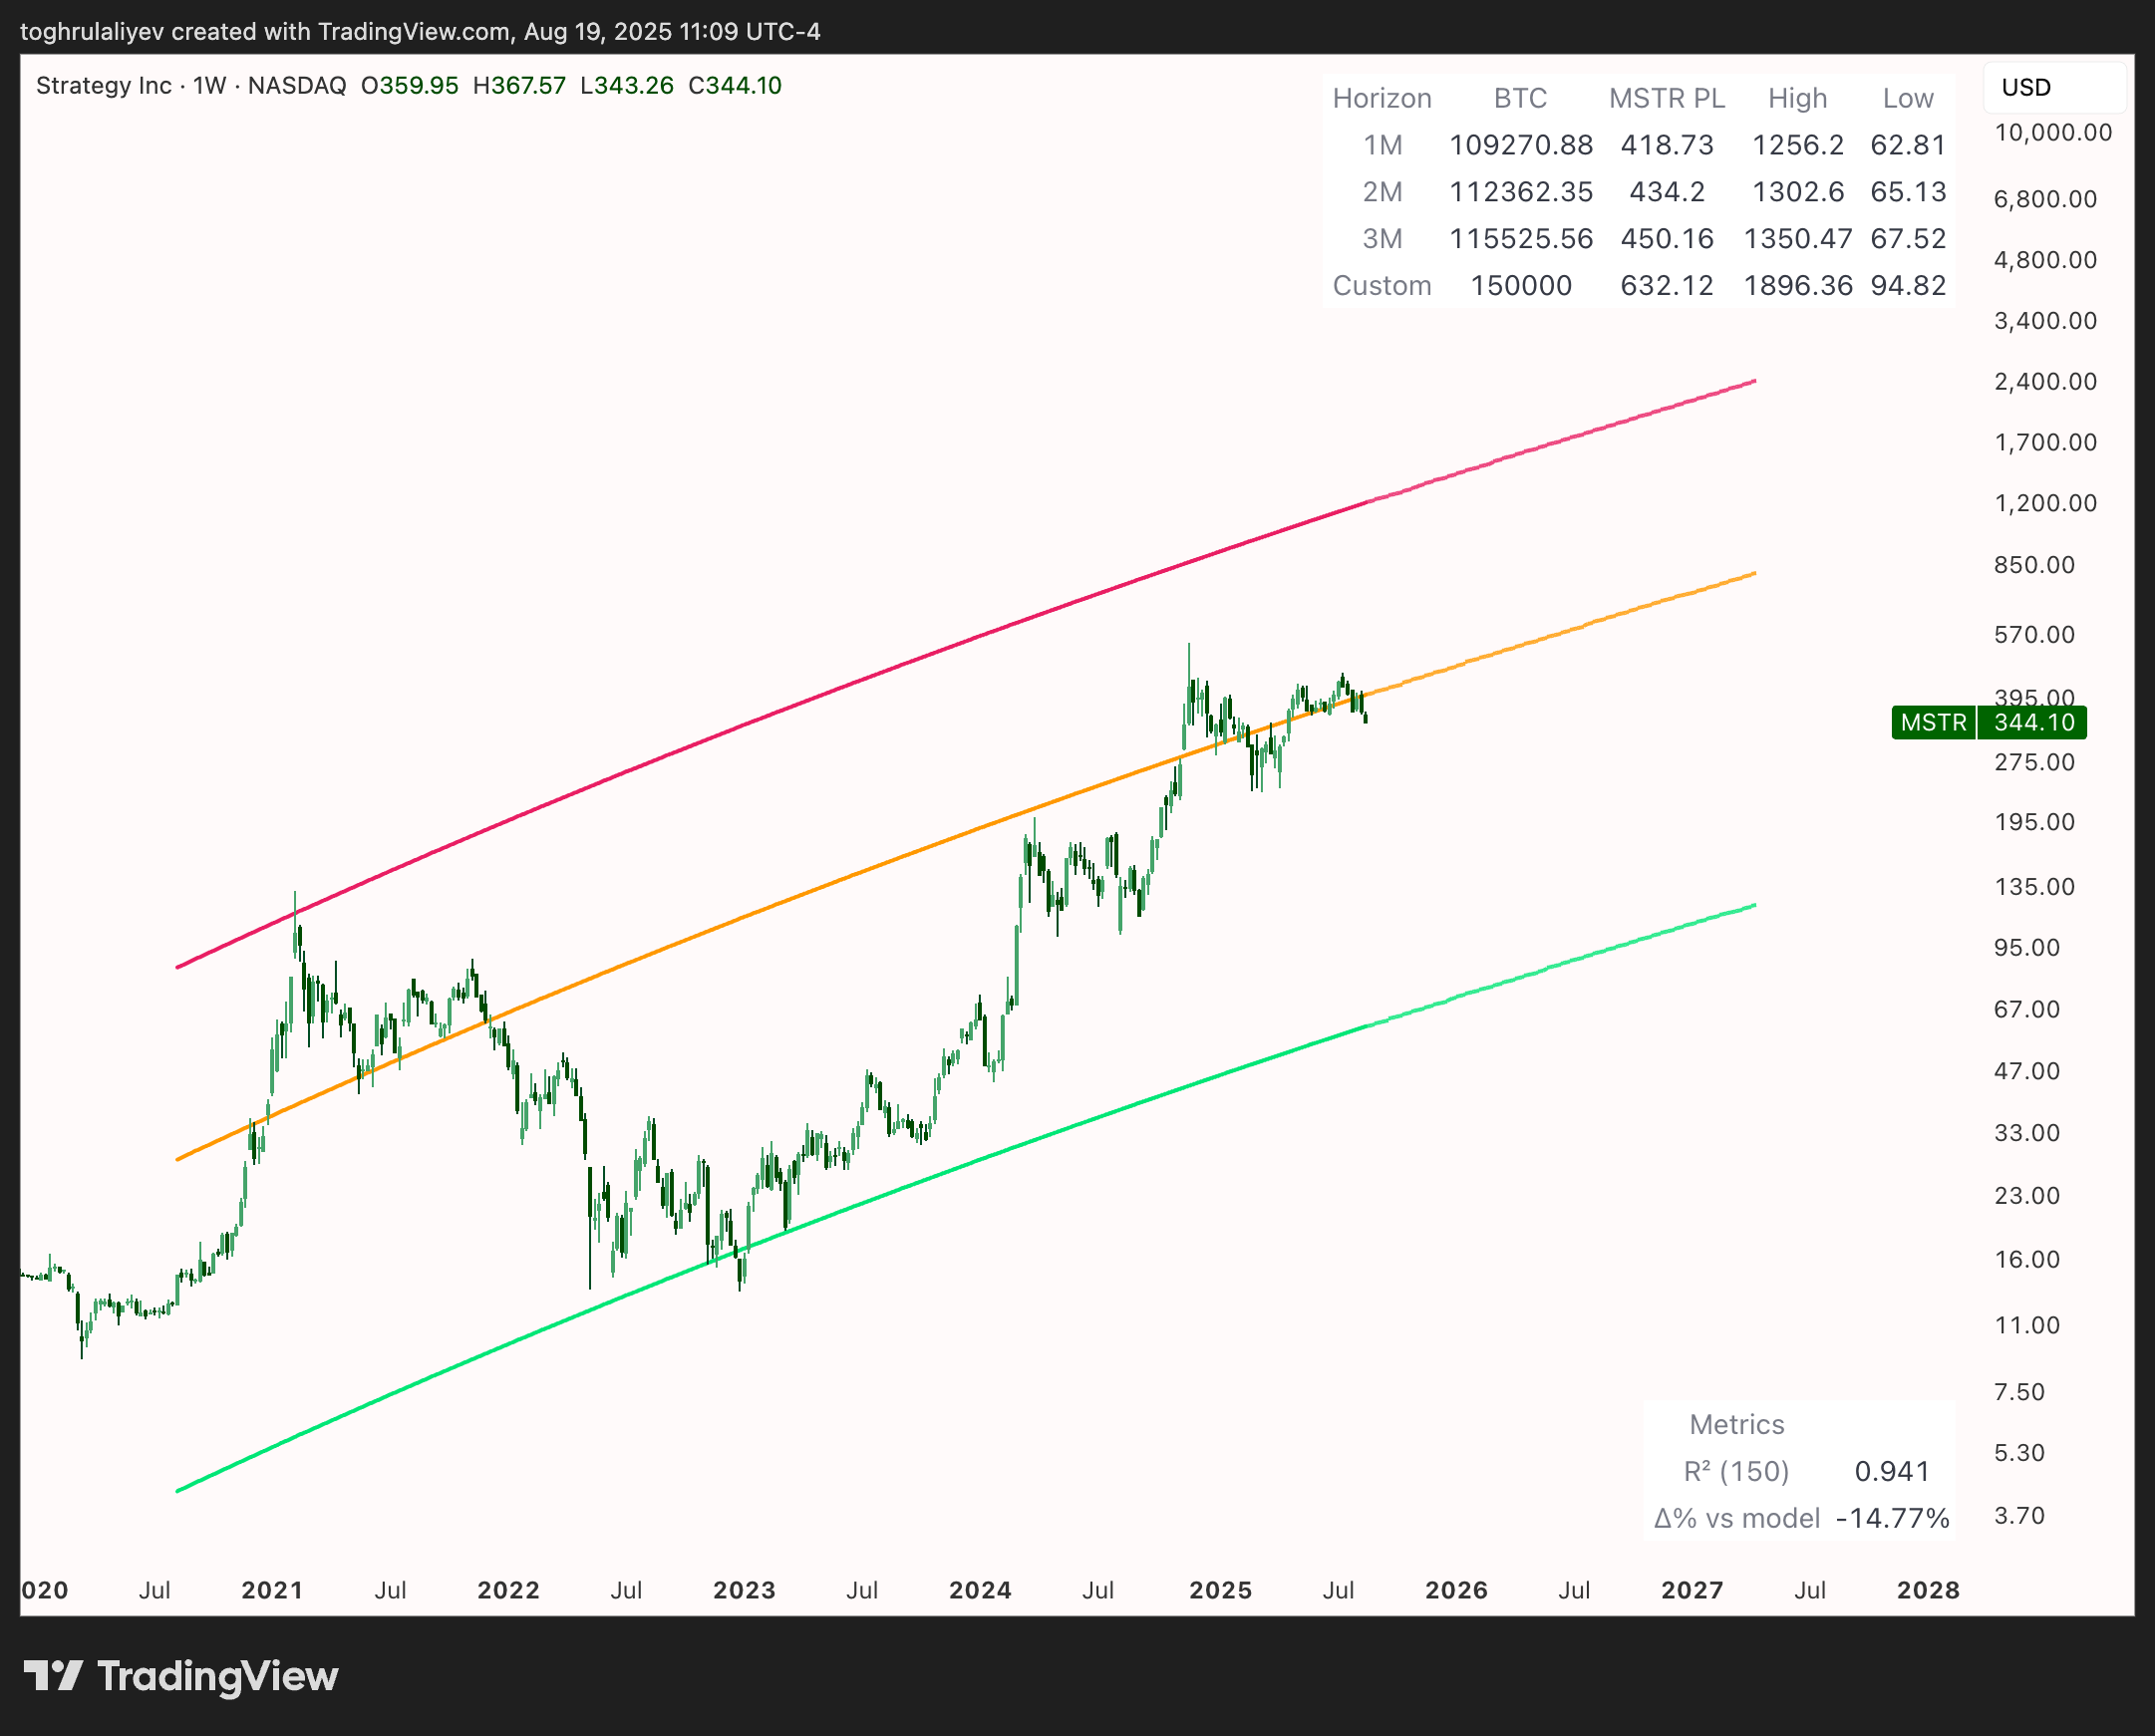
To illustrate, if Bitcoin’s power law trend reaches $1,000,000 on August 30, 2033, plugging into the formula yields MSTR ≈ 0.000118 × ($1,000,000)^1.3 ≈ 7,445.30 per share. It is important to emphasize that this figure corresponds to the central power law trend rather than the range of deviations around it. If we construct an upper and lower bound, for example, at 3× and 0.15× the baseline, then the implied range for MSTR would be approximately $22,335.89 at the upper bound and $1,116.79 at the lower bound.
If we use the example applied earlier to the BAM model, then at a Bitcoin power law value of $150,000, MSTR would be $632.12 under the power law baseline, with $1,896.37 as the upper bound and $94.82 as the lower bound.
Figure 45: MSTR Power Law | Credit: TradingView, Toghrul Aliyev (@itsToghrul)
However, a major limitation of the MSTR power law is the brevity of Strategy’s track record as a Bitcoin proxy. The company adopted its Bitcoin reserve strategy only in 2020, giving us barely five years of data. That window is insufficient to establish a durable statistical law, whether ballistic, power law, or otherwise.
In contrast, Bitcoin itself has a 17-year history, with at least seven years of consistent adherence to its power law trend. Strategy simply does not yet have the longevity required to validate its own structural model. The baseline trend may shift, and the deviation bands (3× and 0.15×) could prove unstable as more data accumulate.
Moreover, Strategy’s trajectory is dependent on corporate decisions and leadership. The persistence of the strategy hinges on Michael Saylor and the management team continuing to prioritize Bitcoin accumulation as the company’s identity. A change in leadership or a pivot in capital allocation policy could all disrupt the linkage.
In such a scenario, MSTR would cease to function as a pure derivative of Bitcoin’s power law and could decouple from it entirely. Alternatively, the market might compress its premium, leading the stock to trade closer to 1× its Bitcoin net asset value (mNAV), reducing it to little more than a transparent wrapper on the company’s Bitcoin holdings rather than a leveraged play. Leadership dependency makes the Strategy’s power law framework less of a fundamental law and more of a conditional one, valid only as long as the corporate commitment to Bitcoin remains intact.
Why MSTR Should Follow a Power Law Anchored to Bitcoin?
Strategy’s fundamental value is largely the value of its Bitcoin holdings, plus a premium.
MSTR Share Price = BTC NAV + P
What the Premium (P) captures:
Net assets excluding BTC (assets minus debt).
Present value of the software business.
Capacity to grow the BTC stack (cash flow, issuance, financing).
Capital structure and leverage.
Liquidity and access convenience versus holding spot BTC.
Market sentiment and positioning.
Leadership, strategic direction, and the capacity for financial innovation.
If Bitcoin’s price follows a power law in time due to network adoption, then Strategy’s asset value does too. If MSTR were just a static holder of BTC (like an ETF or trust), we’d expect MSTR’s market cap to be strictly proportional to BTC’s price (exponent ~1).
However, Strategy adds complexity by:
using leverage (debt), meaning MSTR’s equity is essentially a leveraged claim on BTC;
being valued at a premium or discount by the stock market due to the seven factors mentioned above. These factors can justify an exponent slightly above one.
In essence, MSTR is Bitcoin on steroids, but it is still Bitcoin at the core. The stock cannot outgrow Bitcoin indefinitely and remains tethered to the underlying asset’s trajectory.
Notably, the MSTR power law function is not proposing a new fundamental law of nature. It’s a derived relation given Strategy’s dependence on Bitcoin. It inherits its credibility from Bitcoin’s own power law behavior. One might say MSTR’s long-term destiny is to ride atop Bitcoin’s power law curve, oscillating around it during bubbles and busts, but ultimately reverting to this curve as an anchor.
Indeed, the final verdict of our analysis is that the long-term value of Strategy is, and must be, fundamentally anchored to the Power Law trend of its primary asset, Bitcoin. Any “ballistic” excess returns that MicroStrategy achieves (due to its unique strategy or market frenzy) are transient and will eventually revert toward that anchor.
Aspect
Ballistic Acceleration Model (BAM)
Power Law Model (BTC & MSTR)
Mathematical form
Quadratic fit in log-log space (curved line)
Linear fit in log-log space (straight line)
Primary Driver
Sentiment and reflexive feedback (MSTR vs BTC momentum)
Network growth over time (BTC adoption/Metcalfe’s Law)
Worked for ~1–2 years; already breaking down by 2024–25
Holds for 8+ years of BTC data; uncertain on MSTR, need more history
Conclusion
Investors approach MSTR in the same way they approach every speculative asset: through the filter of emotion. They buy at the top, they load short-term options like lottery tickets, and then chase levered ETFs for quick wins. When the market does what it always does, when it swings violently, punishes impatience, and rewards time, they call it betrayal. Unfortunately, the betrayal lies in their own psychology. The story of MSTR’s failure is the story of investors demanding immediacy from an asset built on long-term value creation.
The underperformance that so many complain about rests on three forces.
Capital structure that feeds the Bitcoin balance sheet while flooding the stock with new supply through issuance and convertibles.
Flow dispersion that has drained MSTR’s monopoly as ETFs, Bitcoin treasuries, and altcoin treasuries split the river of capital that once belonged only to it.
The asymmetry of leverage: correlation magnifies both gains and losses, so in quiet stretches the stock lags, and in bear phases it bleeds harder.
In the middle of this, many turn to the Ballistic Acceleration Model. It promises miracles with a line on a chart. It makes people believe in rockets and acceleration. In reality, it is nothing more than a statistical curve drawn to fit the past. When market conditions shift, the model quickly falters, and each new revision reveals its fragility. A framework that requires constant adjustment to remain aligned with price action is already disqualified as a reliable guide. Rather than offering insight, it provides temporary reassurance.
The enduring reality is that MSTR’s value is chained to the same power law that governs Bitcoin itself. Adoption, scale, and time form the foundation, and MSTR reflects that foundation with leverage. Investors who continue to chase quick gains will repeat the same errors, mistaking temporary swings for structural weakness. Those who recognize the anchor understand that discipline, long horizons, and scale are the true compass points of this market. Everything else is a distraction.
CCN Reports is a regular series that delves into the details to provide in-depth analysis of cryptocurrencies and the companies associated with them. We aim to engage a global audience interested in what’s what, who’s who and perhaps even why’s that.
Disclaimer:
The information provided in this article is for informational purposes only. It is not intended to be, nor should it be construed as, financial advice. We do not make any warranties regarding the completeness, reliability, or accuracy of this information. All investments involve risk, and past performance does not guarantee future results. We recommend consulting a financial advisor before making any investment decisions.
Toghrul Aliyev is the Head of Research who began his journey in crypto in 2021. It all started with a Reddit post that went viral, leading to a writing position while he was still in medical school. As he learned more about crypto, he became deeply interested in it and decided to focus entirely on this field after completing his medical degree and becoming a doctor.
Toghrul specializes in thorough research, always aiming to find details others might miss. He also has a strong understanding of stocks, real-world asset tokenization, and related areas. He is skilled in Python and SQL, which he uses to improve his crypto analysis through data analytics and data science.
When he’s not working, Toghrul enjoys sports, hiking, reading philosophy, such as Seneca's works, and playing story-driven video games.