ETH gained 70.9% in Q3, beating Bitcoin’s 42.6%. Thinner liquidity and uneven historical Q4 returns complicate the outlook. | Credit: CCN.com
Share
Key Takeaways
The XRP/ETH ratio increased 17.4% year-to-date, rising from 0.00062 to 0.00073.
Unprecedented selling pressure hit the Upbit exchange, dragging XRP down against BTC.
Despite rising investment inflows, XRP’s price might continue to struggle in the short term.
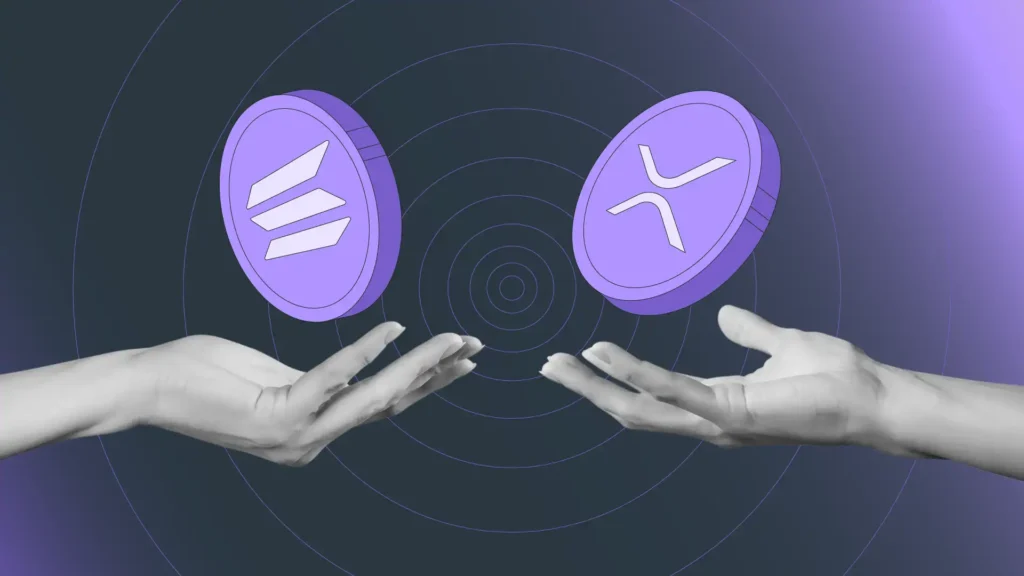
XRP has been quietly winning. Against Ethereum (ETH), XRP’s price is up 17.4% year-to-date (YTD).
After the Feb. 6 crypto crash, it surged 38%, while Bitcoin (BTC) rose 14% and Ethereum rose 12%.
In raw performance terms, XRP crushed the market’s biggest names.
Yet the altcoin is trading at $1.47, struggling to retest to hold $2.
The paradox is glaring — and the answer reveals why relative performance doesn’t always translate into sustained price action.
XRP Is Dominating ETH This Year
The XRP/ETH ratio tells a compelling story. At the start of 2026, XRP was trading at 0.00062 ETH.
Today, it’s at 0.00073 ETH — a 17.4% gain that has steadily closed the gap between the two assets.
The reason? Ethereum’s price has bled harder. ETH’s market cap dropped 35% this year to $233 billion, while XRP’s valuation declined only 24% to $85 billion.
Get These Top Crypto Casino Offers Now!
Sponsored
Disclosure
We sometimes use affiliate links in our content, when clicking on those we might receive a commission at no extra cost to you. By using this website you agree to our terms and conditions and privacy policy.
At the start of the year, that figure was 220%. The distance is shrinking fast.
However, outperforming a struggling asset doesn’t create bullish momentum. It just makes XRP look less bad to hold in a bear market.
XRP Beat Bitcoin After the Crash, but Couldn’t Hold It
XRP’s performance after the Feb. 6 crash was genuinely impressive. The altcoin surged from lows around $1.12 to approximately $1.67 at its peak — a 38% bounce.
Bitcoin, by comparison, recovered about 14%.
Analyst CryptoWendyO noted that coins were also moving off Binance during the rally, which she interpreted as accumulation. Investors were pulling XRP into cold storage rather than gearing up to sell.
Typically, this should be a bullish signal. But she also pushed back on the hype.
“This is not shocking in any way, shape, or form. Altcoins are more volatile and generally see greater gains than Bitcoin because of their smaller market caps.
In February, XRP outperformed BTC by 20%, but whenever this happens, the ratio historically reverses,” She said.
Around Feb. 14 and 15, XRP’s price outperformed both BTC and ETH.
That spike marked a local relative top.
Since then, XRP has been steadily losing ground against both majors.
The decline versus BTC is especially persistent lower highs and lower lows.
XRP/ETH is also trending down, though slightly more stable than XRP/BTC.
XRP peaked around $1.67 on Feb. 15, then collapsed to $1.47 within days amid unprecedented selling pressure on the South Korea-based Upbit exchange.
Net selling pressure reached 57 million XRP on February 15 alone, dragging the price down nearly 10%.
Why XRP Can’t Sustain a 20% Rally?
The core issue is simple: XRP’s outperformance is driven by volatility, not fundamentals.
Altcoins like XRP bounce faster during recoveries because they fall harder during crashes.
That 38% surge after Feb. 6 was a mechanical rebound, not a reversal. When the broader market turned risk-off again, XRP’s price gave back most of those gains immediately.
Meanwhile, Bitcoin remains a safer asset during uncertainty.
Despite XRP’s recent inflows and strong institutional interest, Bitcoin still offers deeper liquidity. and lower correlation with altcoin sentiment.
Each rally attempt hits the same wall and fades. Until XRP can reclaim and hold $2.00 with volume, every bounce is a trap.
As seen below, XRP’s price has broken below the 0.236 Fibonacci level around $1.72.
The descending channel drawn from the recent lower high remains intact, and price is still respecting the downward-sloping resistance line.
Since XRP is trading below the 50 EMA, it means the altcoin is in a bearish trend. Every recent rally has failed beneath this moving average, which reinforces seller control.
In addition, momentum remains weak. The Awesome Oscillator (AO) is still negative, though it has improved slightly from deeper red levels.
That suggests downside momentum is slowing, but not yet reversing.
The key level to watch is the $1.12 region, which aligns with the broader range base. If XRP’s price closes below that level on a daily basis, it opens the door to a deeper retracement into prior consolidation zones.
On the contrary, for any meaningful bullish shift, XRP would need to reclaim $1.72. It would also need to break the descending trendline and push back above $2 to invalidate the current lower-high structure.
Disclaimer:
The information provided in this article is for informational purposes only. It is not intended to be, nor should it be construed as, financial advice. We do not make any warranties regarding the completeness, reliability, or accuracy of this information. All investments involve risk, and past performance does not guarantee future results. We recommend consulting a financial advisor before making any investment decisions.
Victor Olanrewaju is a crypto analyst and reporter at CCN with deep roots in on-chain research and technical analysis. His crypto journey began in 2017, but it was the 2020 Uniswap airdrop that sparked a full-time pivot into the space.
With a foundation in copywriting, Victor honed his craft creating high-converting content for leading crypto brokers — most notably an XRP price prediction that ranked #1 on Google during the 2021 bull run.
He later joined AMBCrypto in 2022, where he combined storytelling with technical and on-chain analysis to cover key market narratives.
In 2024, he expanded his expertise at BeInCrypto, collaborating with analysts and using tools like Glassnode, Santiment, and IntoTheBlock to break down Bitcoin and altcoin trends.
At CCN, Victor covers the top cryptocurrencies, memecoins, macro shifts, blending real-time insights with deep-dive metrics.
He holds a Bachelor’s degree in Physics from the University of Ibadan, equipping him to simplify complex data for a wide audience. Follow his work or connect on LinkedIn or X.