Here is why DOT price might experience another drawdown this year | Credit: Hameem Sarwar
Share
Key Takeaways
The Feb. 5 sell-off drove Polkadot’s price to a new low near $1.13.
The project will likely reduce DOT’s annual issuance by March 14.
Despite the upcoming event, the DOT price might not break out.
Polkadot (DOT), like several altcoins, is enduring a brutal crypto winter.
On Feb. 5, the Polkadot price crash drove the altcoin to an all-time low of $1.13.
This move happened after a swift 40% decline from its January highs, before it slightly bounced.
Since then, the native coin of the interoperability giant has failed to find a bottom, leaving holders questioning if the “Pi Day” supply shock in March will be enough to save the price.
Considering the current market sentiment, CCN explains why this could be challenging.
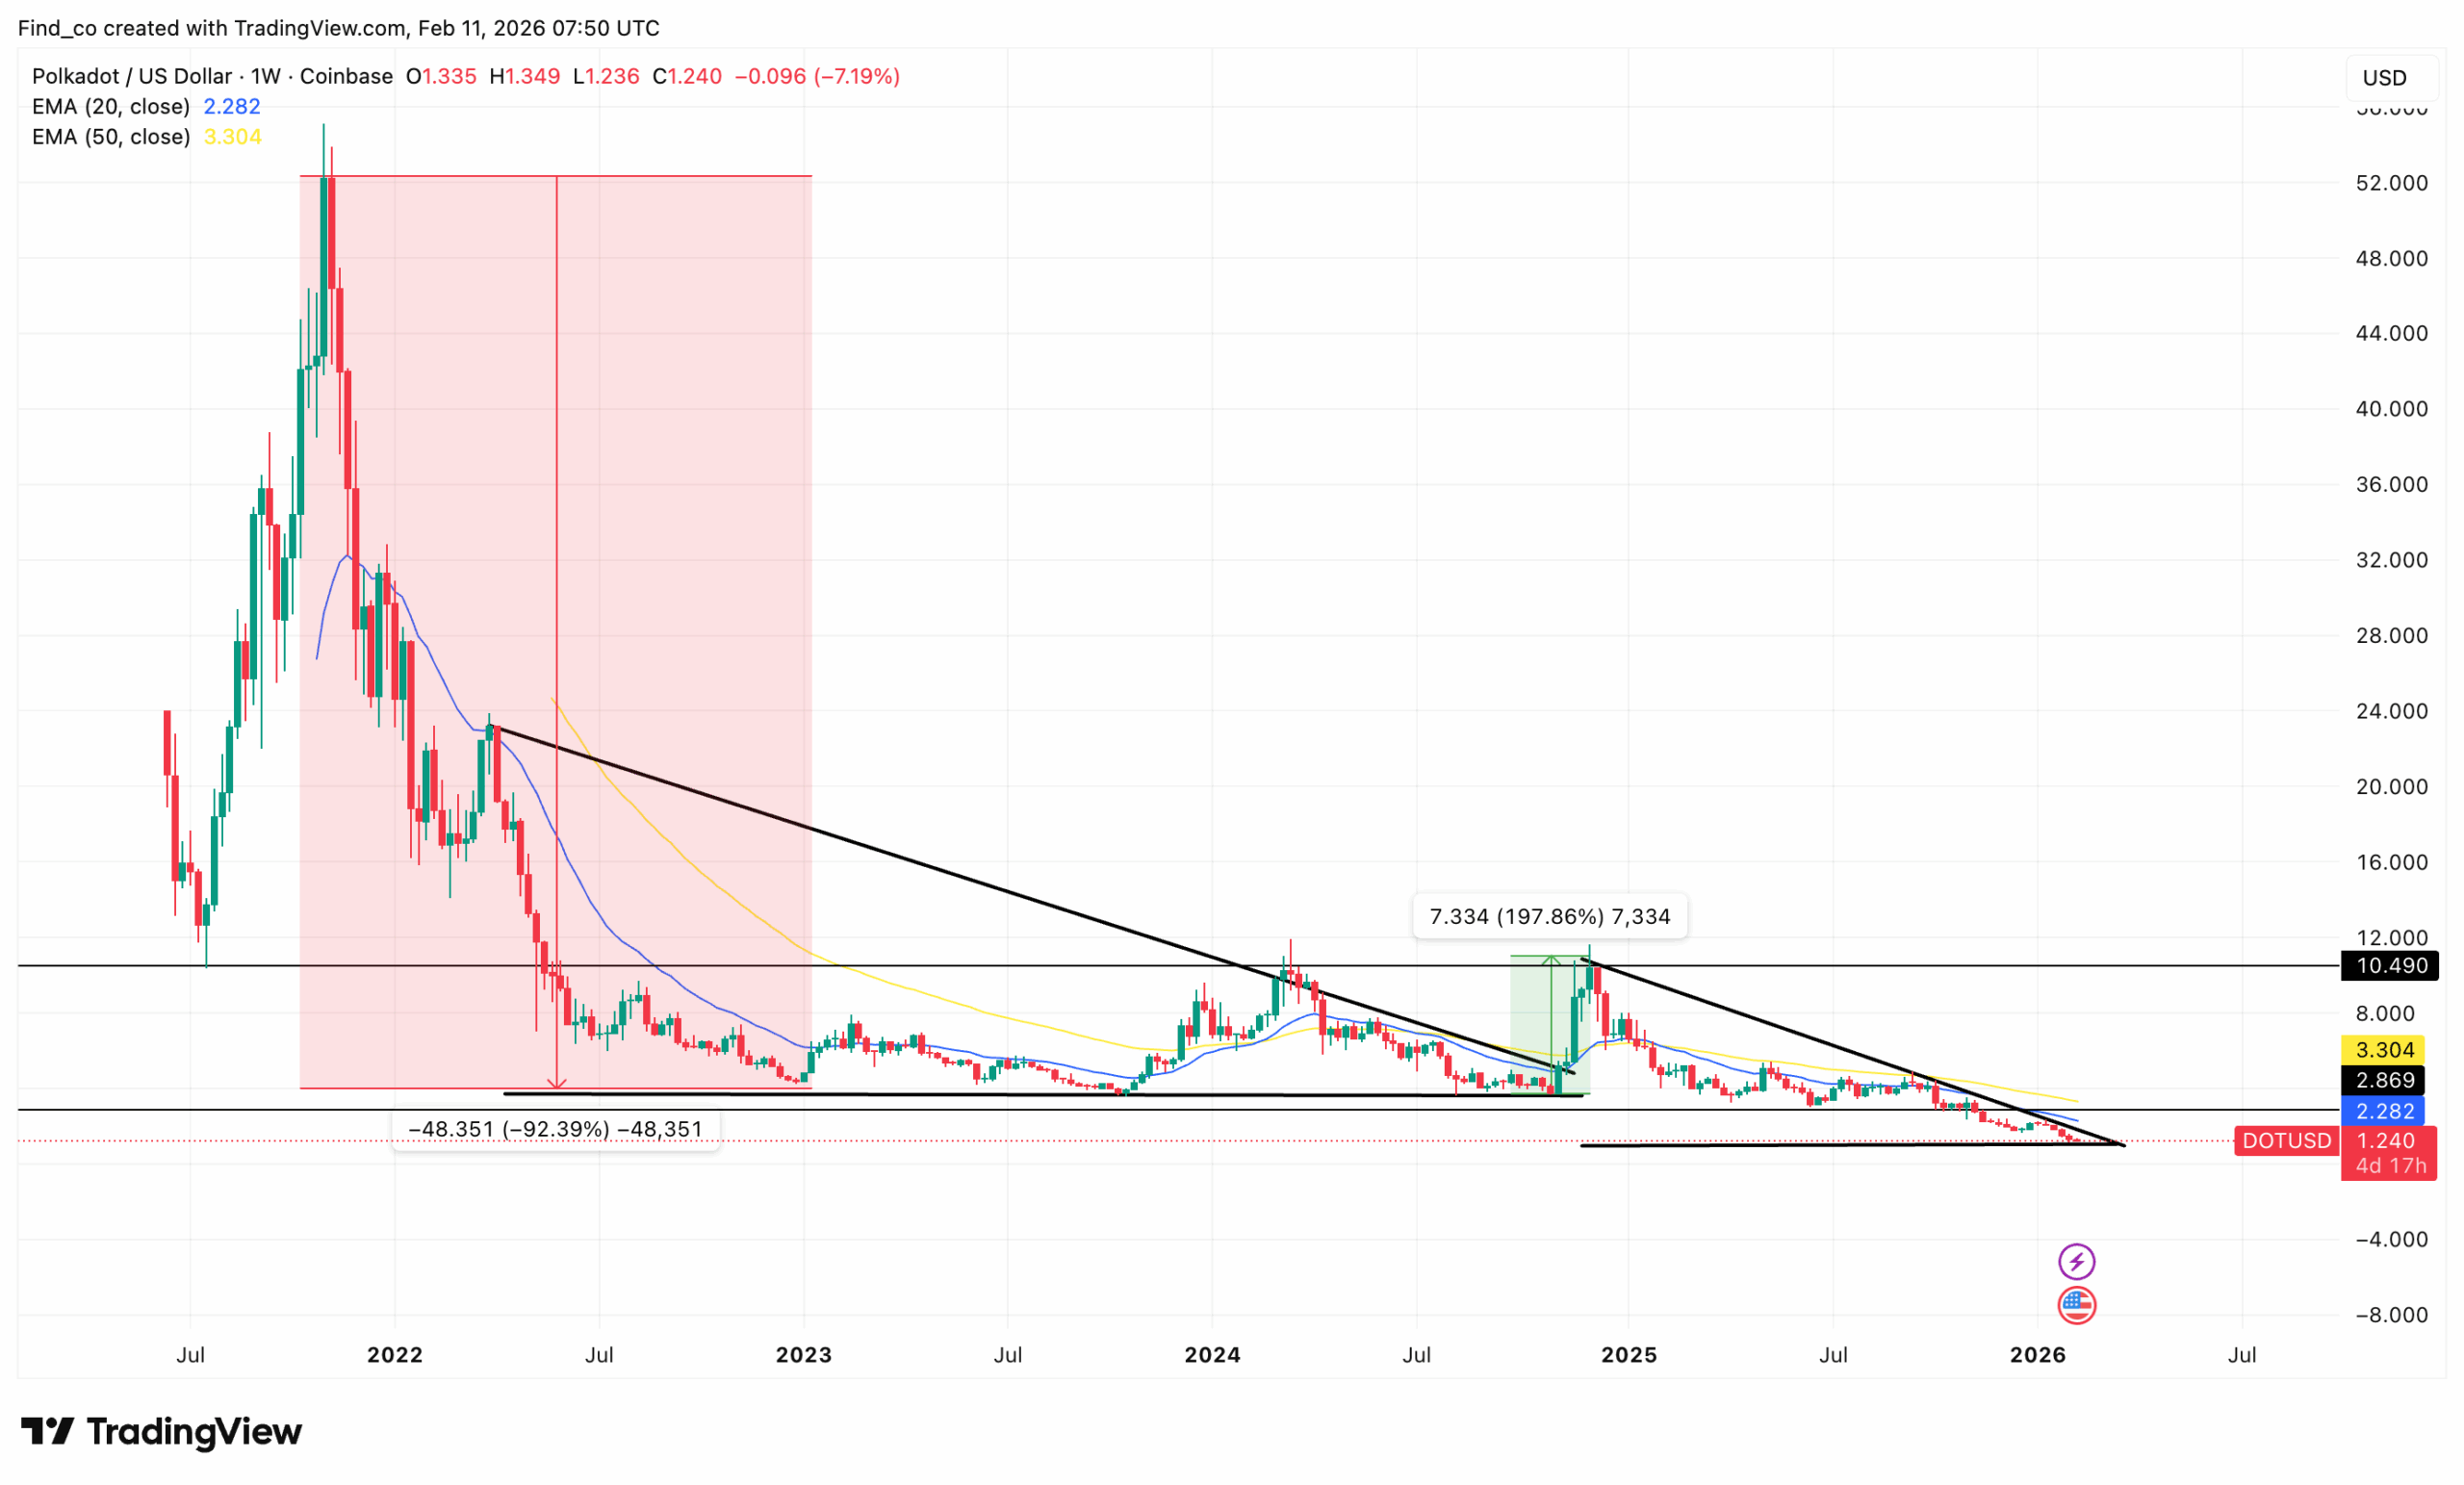
As shown below, this began after the 2021 peak. The chart shows a massive 92% drawdown from the cycle high, followed by a prolonged period of compression beneath a descending trendline.
The 2024–2025 bounce, which nearly delivered a 200% rally from the lows, was ultimately another lower high.
Furthermore, DOT’s price rejected near the descending resistance and has since dropped again.
Both the 20-week and 50-week EMAs are overhead and sloping downward, acting as crucial resistance rather than support.
However, the difference this time is structural exhaustion. Each bounce has been weaker, volume has diminished, and the trendline compression suggests sellers remain in control.
Thus, until Polkadot’s price can reclaim the descending trendline and hold above the weekly EMAs, rallies should be viewed as countertrend instead of the start of a new upswing.
The “Pi Day” Supply Shock Has a Role
Meanwhile, the only real catalyst on the horizon for DOT is March 14, 2026, called the “Pi Day Reset.”
On that date, Polkadot plans to slash annual issuance from roughly 120 million DOT to 56.88 million, a notable 52.6% reduction.
More importantly, the move transitions DOT toward a defined 2.1 billion hard cap, effectively ending its open-ended inflation era.
The catch? Supply shocks don’t reprice instantly.
Historically, it can take 3o to 60 days for reduced issuance to meaningfully impact market structure.
For that mechanism to matter, the current Polkadot price crash must first survive February without breaking confidence entirely.
If price stabilizes in the $1.20 range, the groundwork for a reflexive supply squeeze into Q2 could form.
But if support collapses before issuance tightens, the narrative may arrive too late to prevent further downside.
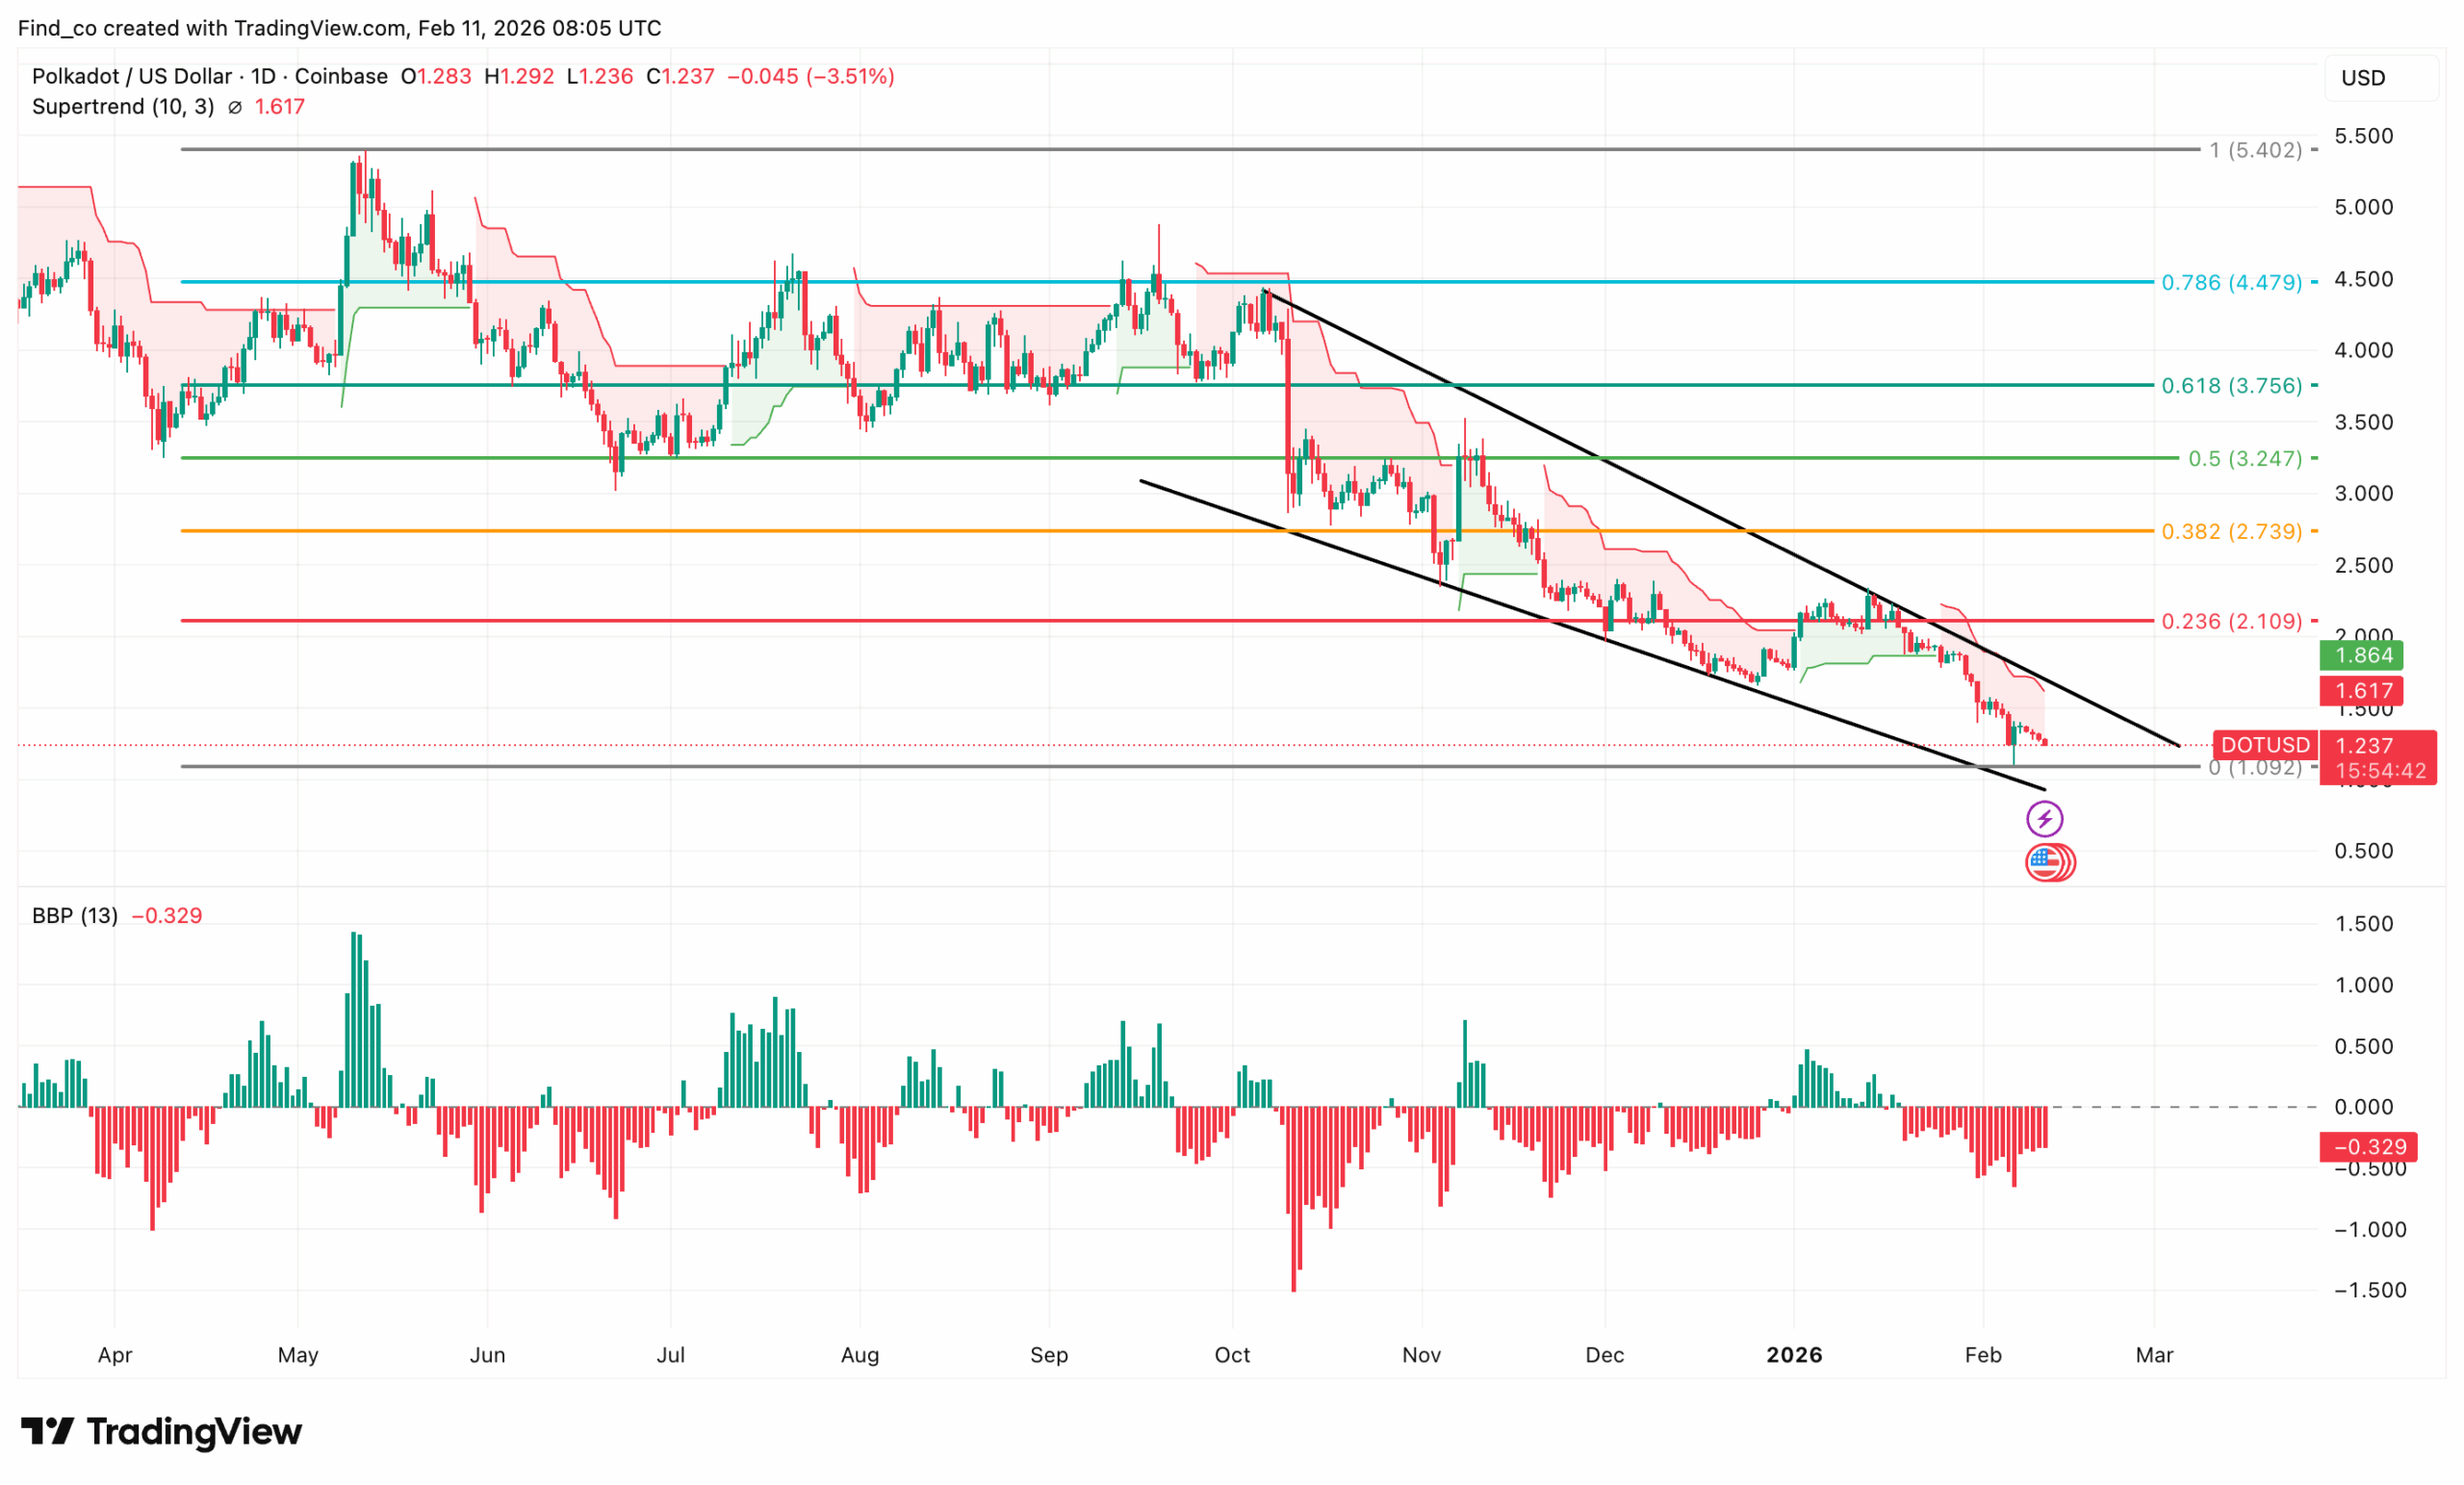
The recent structure shows a breakdown below the 0.236 Fibonacci level around $2.10, which had briefly acted as support.
The Supertrend indicator remains above DOT’s price, reinforcing downside momentum.
Furthermore, the inability to reclaim even the 0.382 Fibonacci level near 2.74 signals weak buyer conviction.
Price is now hovering just above the horizontal base at $1.10, a level that has historically provided structural support.
However, repeated tests within a descending channel tend to weaken support over time. If this level breaks, the chart offers little nearby structure, opening the door to accelerated downside.
Momentum also remains negative, with the BBP histogram printing sustained red readings. If this trend continues, Polkadot’s price might decline to a new low of $1.09.
Until DOT’s price breaks out of the descending channel and reclaims prior Fibonacci resistance levels, the path of least resistance remains to the downside. In that scenario, the altcoin might surge to $2.10.
Disclaimer:
The information provided in this article is for informational purposes only. It is not intended to be, nor should it be construed as, financial advice. We do not make any warranties regarding the completeness, reliability, or accuracy of this information. All investments involve risk, and past performance does not guarantee future results. We recommend consulting a financial advisor before making any investment decisions.
Victor Olanrewaju is a crypto analyst and reporter at CCN with deep roots in on-chain research and technical analysis. His crypto journey began in 2017, but it was the 2020 Uniswap airdrop that sparked a full-time pivot into the space.
With a foundation in copywriting, Victor honed his craft creating high-converting content for leading crypto brokers — most notably an XRP price prediction that ranked #1 on Google during the 2021 bull run.
He later joined AMBCrypto in 2022, where he combined storytelling with technical and on-chain analysis to cover key market narratives.
In 2024, he expanded his expertise at BeInCrypto, collaborating with analysts and using tools like Glassnode, Santiment, and IntoTheBlock to break down Bitcoin and altcoin trends.
At CCN, Victor covers the top cryptocurrencies, memecoins, macro shifts, blending real-time insights with deep-dive metrics.
He holds a Bachelor’s degree in Physics from the University of Ibadan, equipping him to simplify complex data for a wide audience. Follow his work or connect on LinkedIn or X.