Home / Analysis / Crypto / Technical Analysis / Solana (SOL) Price Refuses to Break Below $70 Despite 40% Correction, but Bears Still Have the Upper Hand
Solana’s selloff has eased, but a bear flag is forming | Credit: Hameem Sarwar
Share
Key Takeaways
Solana has defended the $70 psychological zone after a nearly 40% drop.
On-chain MVRV has compressed toward historically accumulation zones.
A confirmed trend reversal would require Solana’s price to reclaim $110.
Solana (SOL) is showing rare resilience in a market still gripped by Extreme Fear.
After plunging nearly 40% from its January highs, the altcoin has defended the $70 psychological level.
A full V-shaped recovery is not yet visible. However, the intensity of the sell-off has clearly cooled, suggesting that the Solana price correction could be over.
Solana Is Confined in a Bear Flag
Solana’s 4-hour chart confirms that the price is attempting a relief structure. However, it remains technically fragile.
As seen below, the sharp selloff from the $130 resistance zone created a clean impulsive leg down, breaking prior support around $115. That breakdown established the dominant bearish trend.
So, what we’re seeing now is a bear flag forming after the vertical drop toward the $75 capitulation low.
Furthermore, Solana’s price is currently confined inside a rising channel, but the structure is corrective.
From the chart below, the slope is shallow, volume has cooled, and momentum is fading into resistance near $92, which also aligns with the Supertrend barrier around $90.73.
Therefore, if SOL breaks below the lower trendline of this flag, roughly the $84 zone, the measured move projects another leg lower.
A confirmed breakdown would likely open the path back toward $75, and potentially a retest of $72.
On the bullish side, invalidation requires a breakout above $92 with strong volume. That would negate the bear flag and shift focus toward $100, where heavy overhead supply remains from the prior breakdown.
The CMF reading near +0.10 shows modest inflows, but not enough to signal aggressive accumulation. It reflects stabilization, not trend reversal.
Coin Nears Accumulation Region
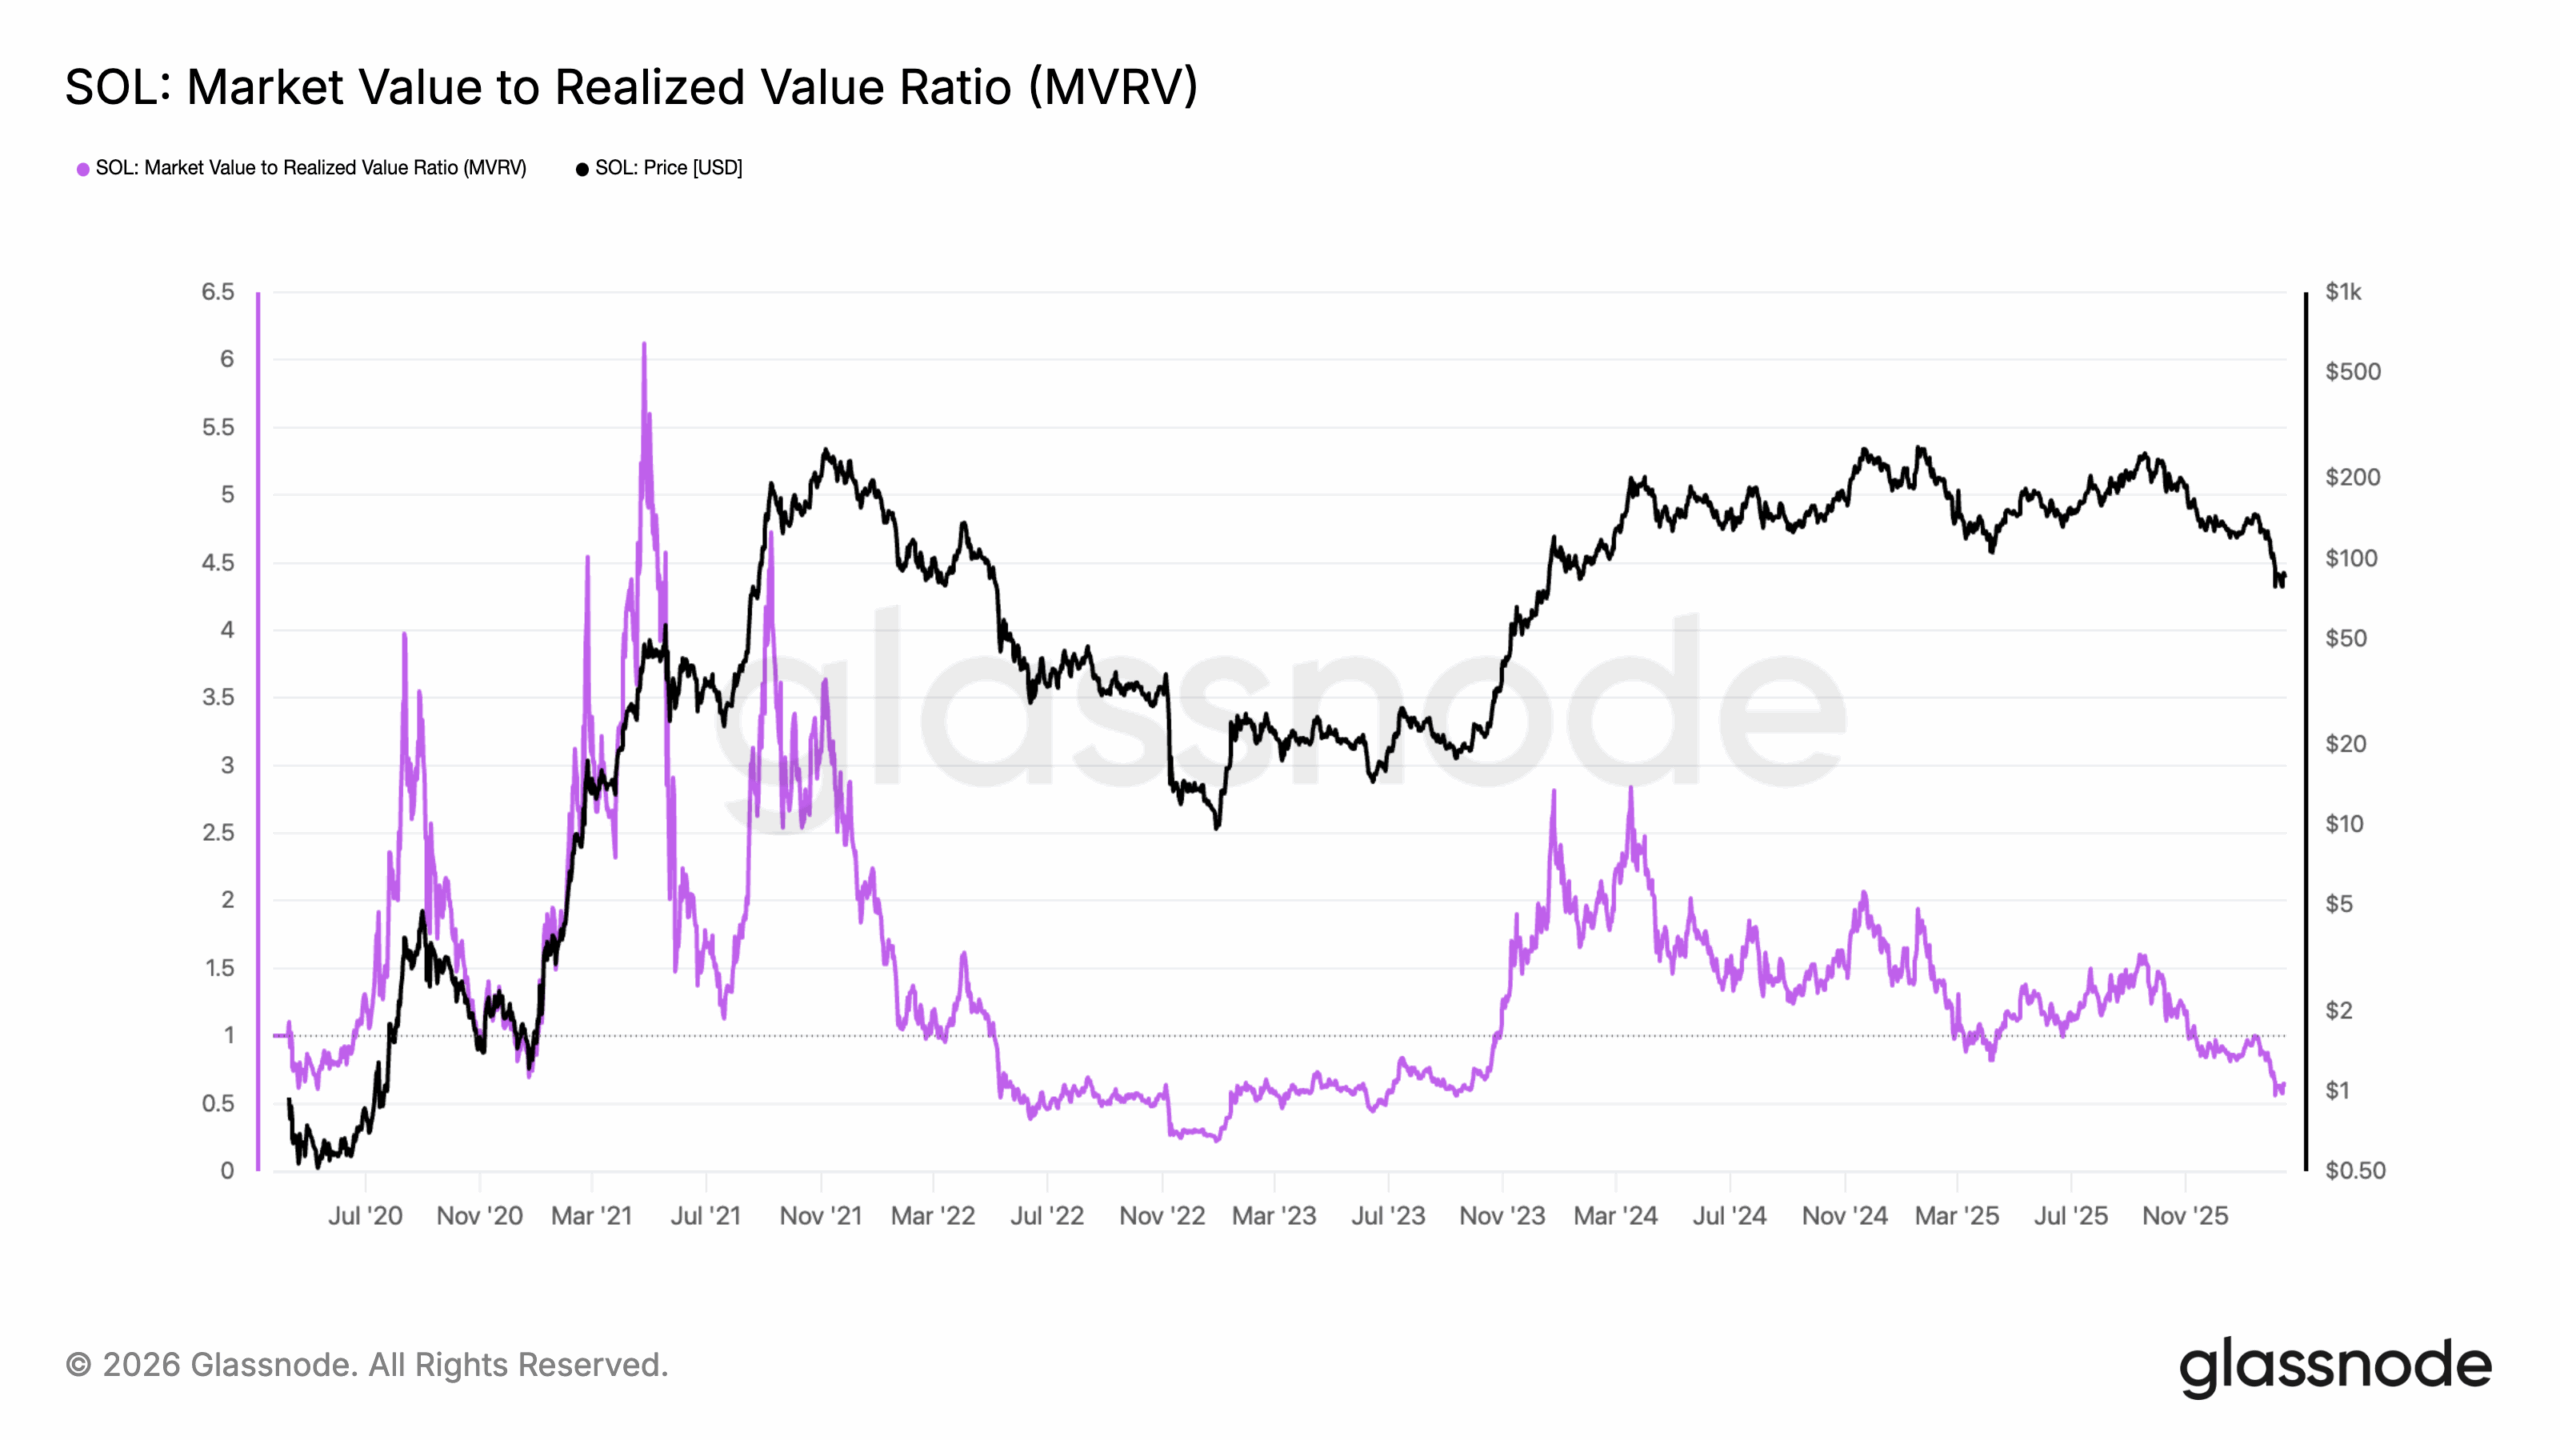
Besides that, on-chain MVRV bands reached historically extreme deviations at that level, a signal that has coincided with major cycle bottoms in the past.
As shown below, the chart compares Solana’s MVRV ratio (purple) to price (black).
Historically, major cycle tops for SOL have occurred when MVRV has pushed above 3.0 and 3.5, and especially during spikes toward 5–6.
In 2021, those extreme readings aligned closely with euphoric price peaks.
Cycle bottoms, on the other hand, formed when MVRV compressed toward 0.5–0.8. Similar readings in late 2020 and early 2022 preceded powerful multi-month recoveries.
Those zones historically represented long-term accumulation opportunities rather than distribution phases.
Currently, the MVRV appears to be hovering around the 0.6 region after trending down from higher levels earlier in the cycle.
Compared to previous tops, Solana’s price is far from euphoric conditions. Also, when paired with absolute bear-market extremes, we are not deeply capitulated either.
As it stands, SOL’s price might remain in a consolidation for an extended period.
Perhaps most importantly, institutional flows have quietly shifted.
After four consecutive weeks of outflows, Solana-linked investment products recorded $31 million in net inflows last week. Meanwhile, Bitcoin (BTC) and Ethereum (ETH) continued to see capital exit.
Much of this rotation came from European allocators positioning SOL as a high-beta recovery play following softer U.S. inflation data.
But since the inflow is not relatively significant, it might take a while before it positively impacts Solana’s price.
SOL Price to $100? Chart Says “Not Yet”
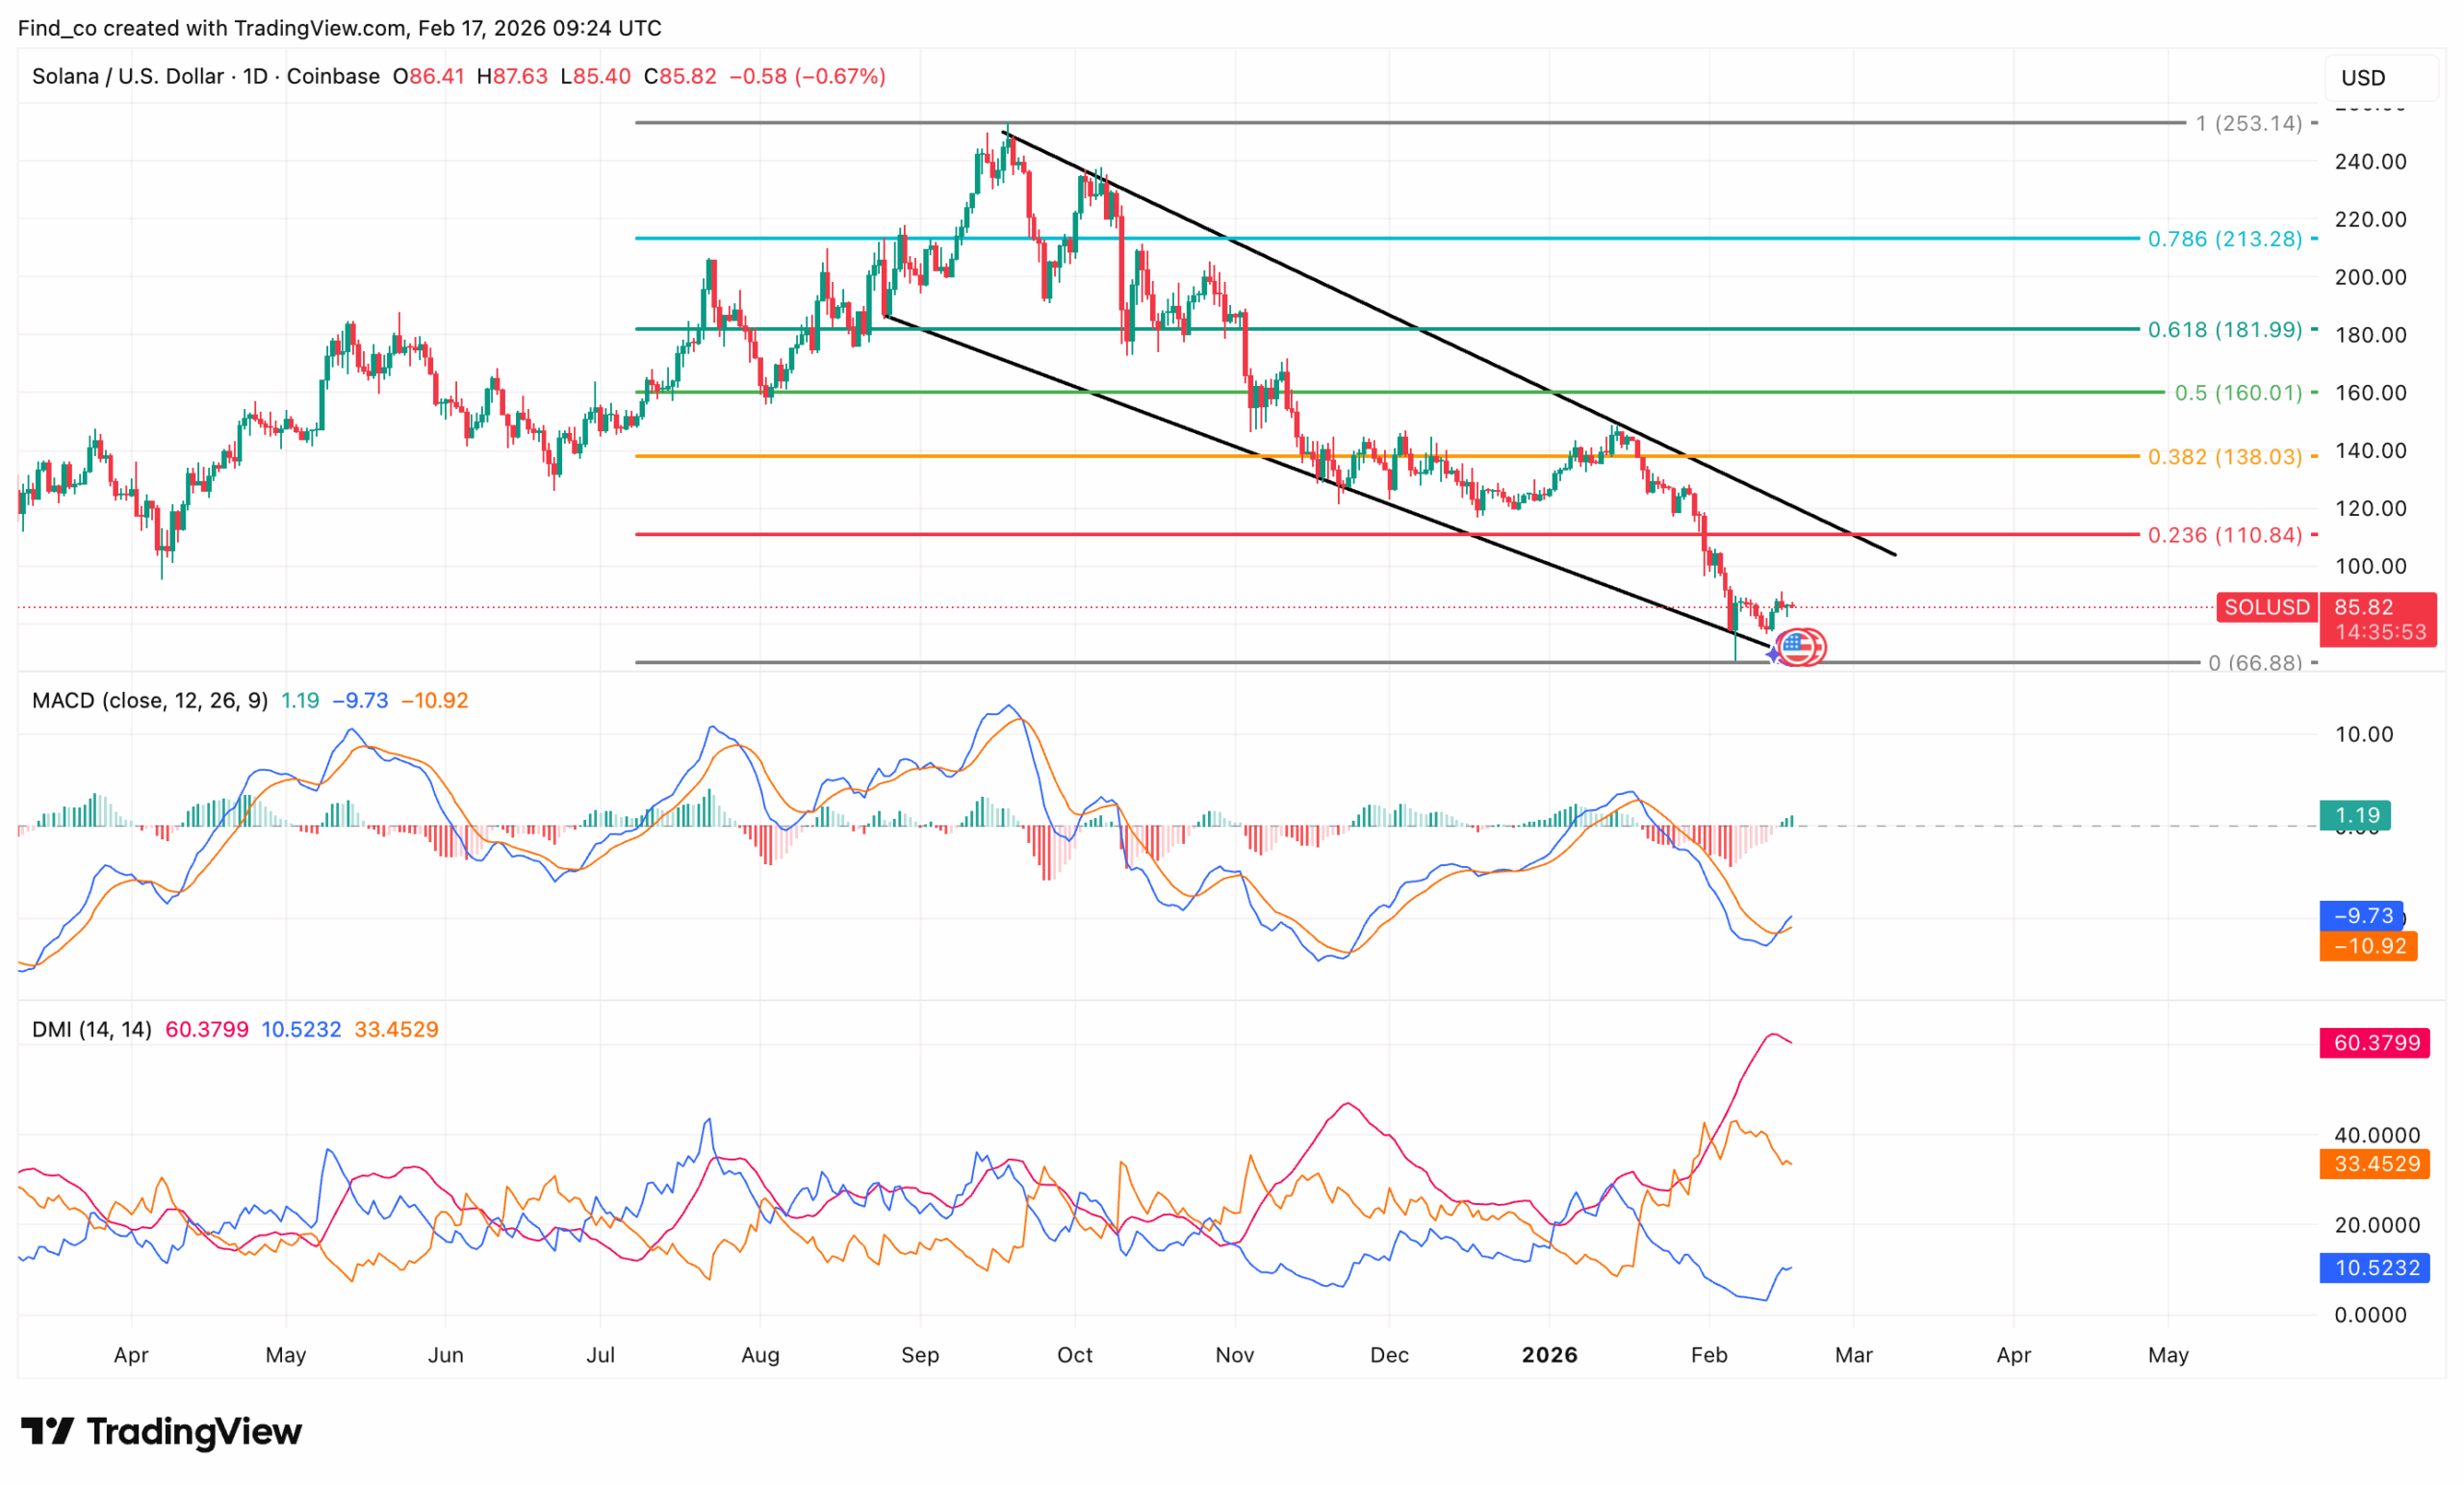
On the daily timeframe, SOL’s price remains in a macro downtrend, as evidenced by the descending channel.
From the image below, the altcoin has consistently printed lower highs and lower lows, respecting the channel’s upper and lower bounds.
The recent breakdown toward the lower boundary brought the price into the $90 region, which sits just above the major horizontal support around $66.68
From a Fibonacci perspective, Solana’s price has fallen below the 0.382 level at $138.03 and the 0.236 level at $ 110.84. Losing the 0.236 retracement is particularly important because it acts as the final shallow pullback support in strong uptrends.
Once that level fails, it typically signals a deeper structural reset. The zero Fib level around $66.88 now becomes the key macro support. If this zone holds, it could form a higher-timeframe base.
However, if it breaks, downside acceleration toward the prior cycle structure becomes more probable.
Momentum indicators show early signs of a potential relief attempt, but not a confirmed reversal. The Moving Average Convergence Divergence (MACD )is beginning to curl upward, suggesting bearish momentum is fading.
However, both lines remain below the zero line, indicating the broader trend remains bearish.
The Directional Movement Index (DMI) shows a strong negative directional index reading, reflecting the dominance of the downtrend.
Disclaimer:
The information provided in this article is for informational purposes only. It is not intended to be, nor should it be construed as, financial advice. We do not make any warranties regarding the completeness, reliability, or accuracy of this information. All investments involve risk, and past performance does not guarantee future results. We recommend consulting a financial advisor before making any investment decisions.
Victor Olanrewaju is a crypto analyst and reporter at CCN with deep roots in on-chain research and technical analysis. His crypto journey began in 2017, but it was the 2020 Uniswap airdrop that sparked a full-time pivot into the space.
With a foundation in copywriting, Victor honed his craft creating high-converting content for leading crypto brokers — most notably an XRP price prediction that ranked #1 on Google during the 2021 bull run.
He later joined AMBCrypto in 2022, where he combined storytelling with technical and on-chain analysis to cover key market narratives.
In 2024, he expanded his expertise at BeInCrypto, collaborating with analysts and using tools like Glassnode, Santiment, and IntoTheBlock to break down Bitcoin and altcoin trends.
At CCN, Victor covers the top cryptocurrencies, memecoins, macro shifts, blending real-time insights with deep-dive metrics.
He holds a Bachelor’s degree in Physics from the University of Ibadan, equipping him to simplify complex data for a wide audience. Follow his work or connect on LinkedIn or X.