After briefly reclaiming $70,000 earlier this week, Bitcoin (BTC) has slipped back toward $ 66,372, and the tone feels fragile.
Based on CCN’s findings, the cryptocurrency might not be reacting to the level of buying or selling volume.
Instead, Bitcoin’s price seems to be reacting to what inflation might be when the US Consumer Price Index (CPI) is released at 8:30 AM EST.
In this analysis, CCN reveals what the expected outcomes are and how they could affect BTC.
The JPMorgan Setup: A Hawkish Shock Risk Bitcoin
JPMorgan analysts, led by Nikolaos Panigirtzoglou, are preparing clients for a potentially hawkish inflation outcome.
According to the firm’s trading desk, a hotter-than-expected CPI reinforces the “higher for longer” narrative, especially with Kevin Warsh’s hawkish posture looming over Fed policy expectations.
For Bitcoin’s price, that likely means a decisive test of $60,000, because it’s where the remaining retail leverage clusters.
Outside the crypto market, the report said that if core CPI comes in at 0.35% to 0.4%, the S&P 500 could rise 0.25% to 0.75%.
However, it also mentioned that a print above 0.45% could push the S&P 500 down 1.25% to 2.5%.
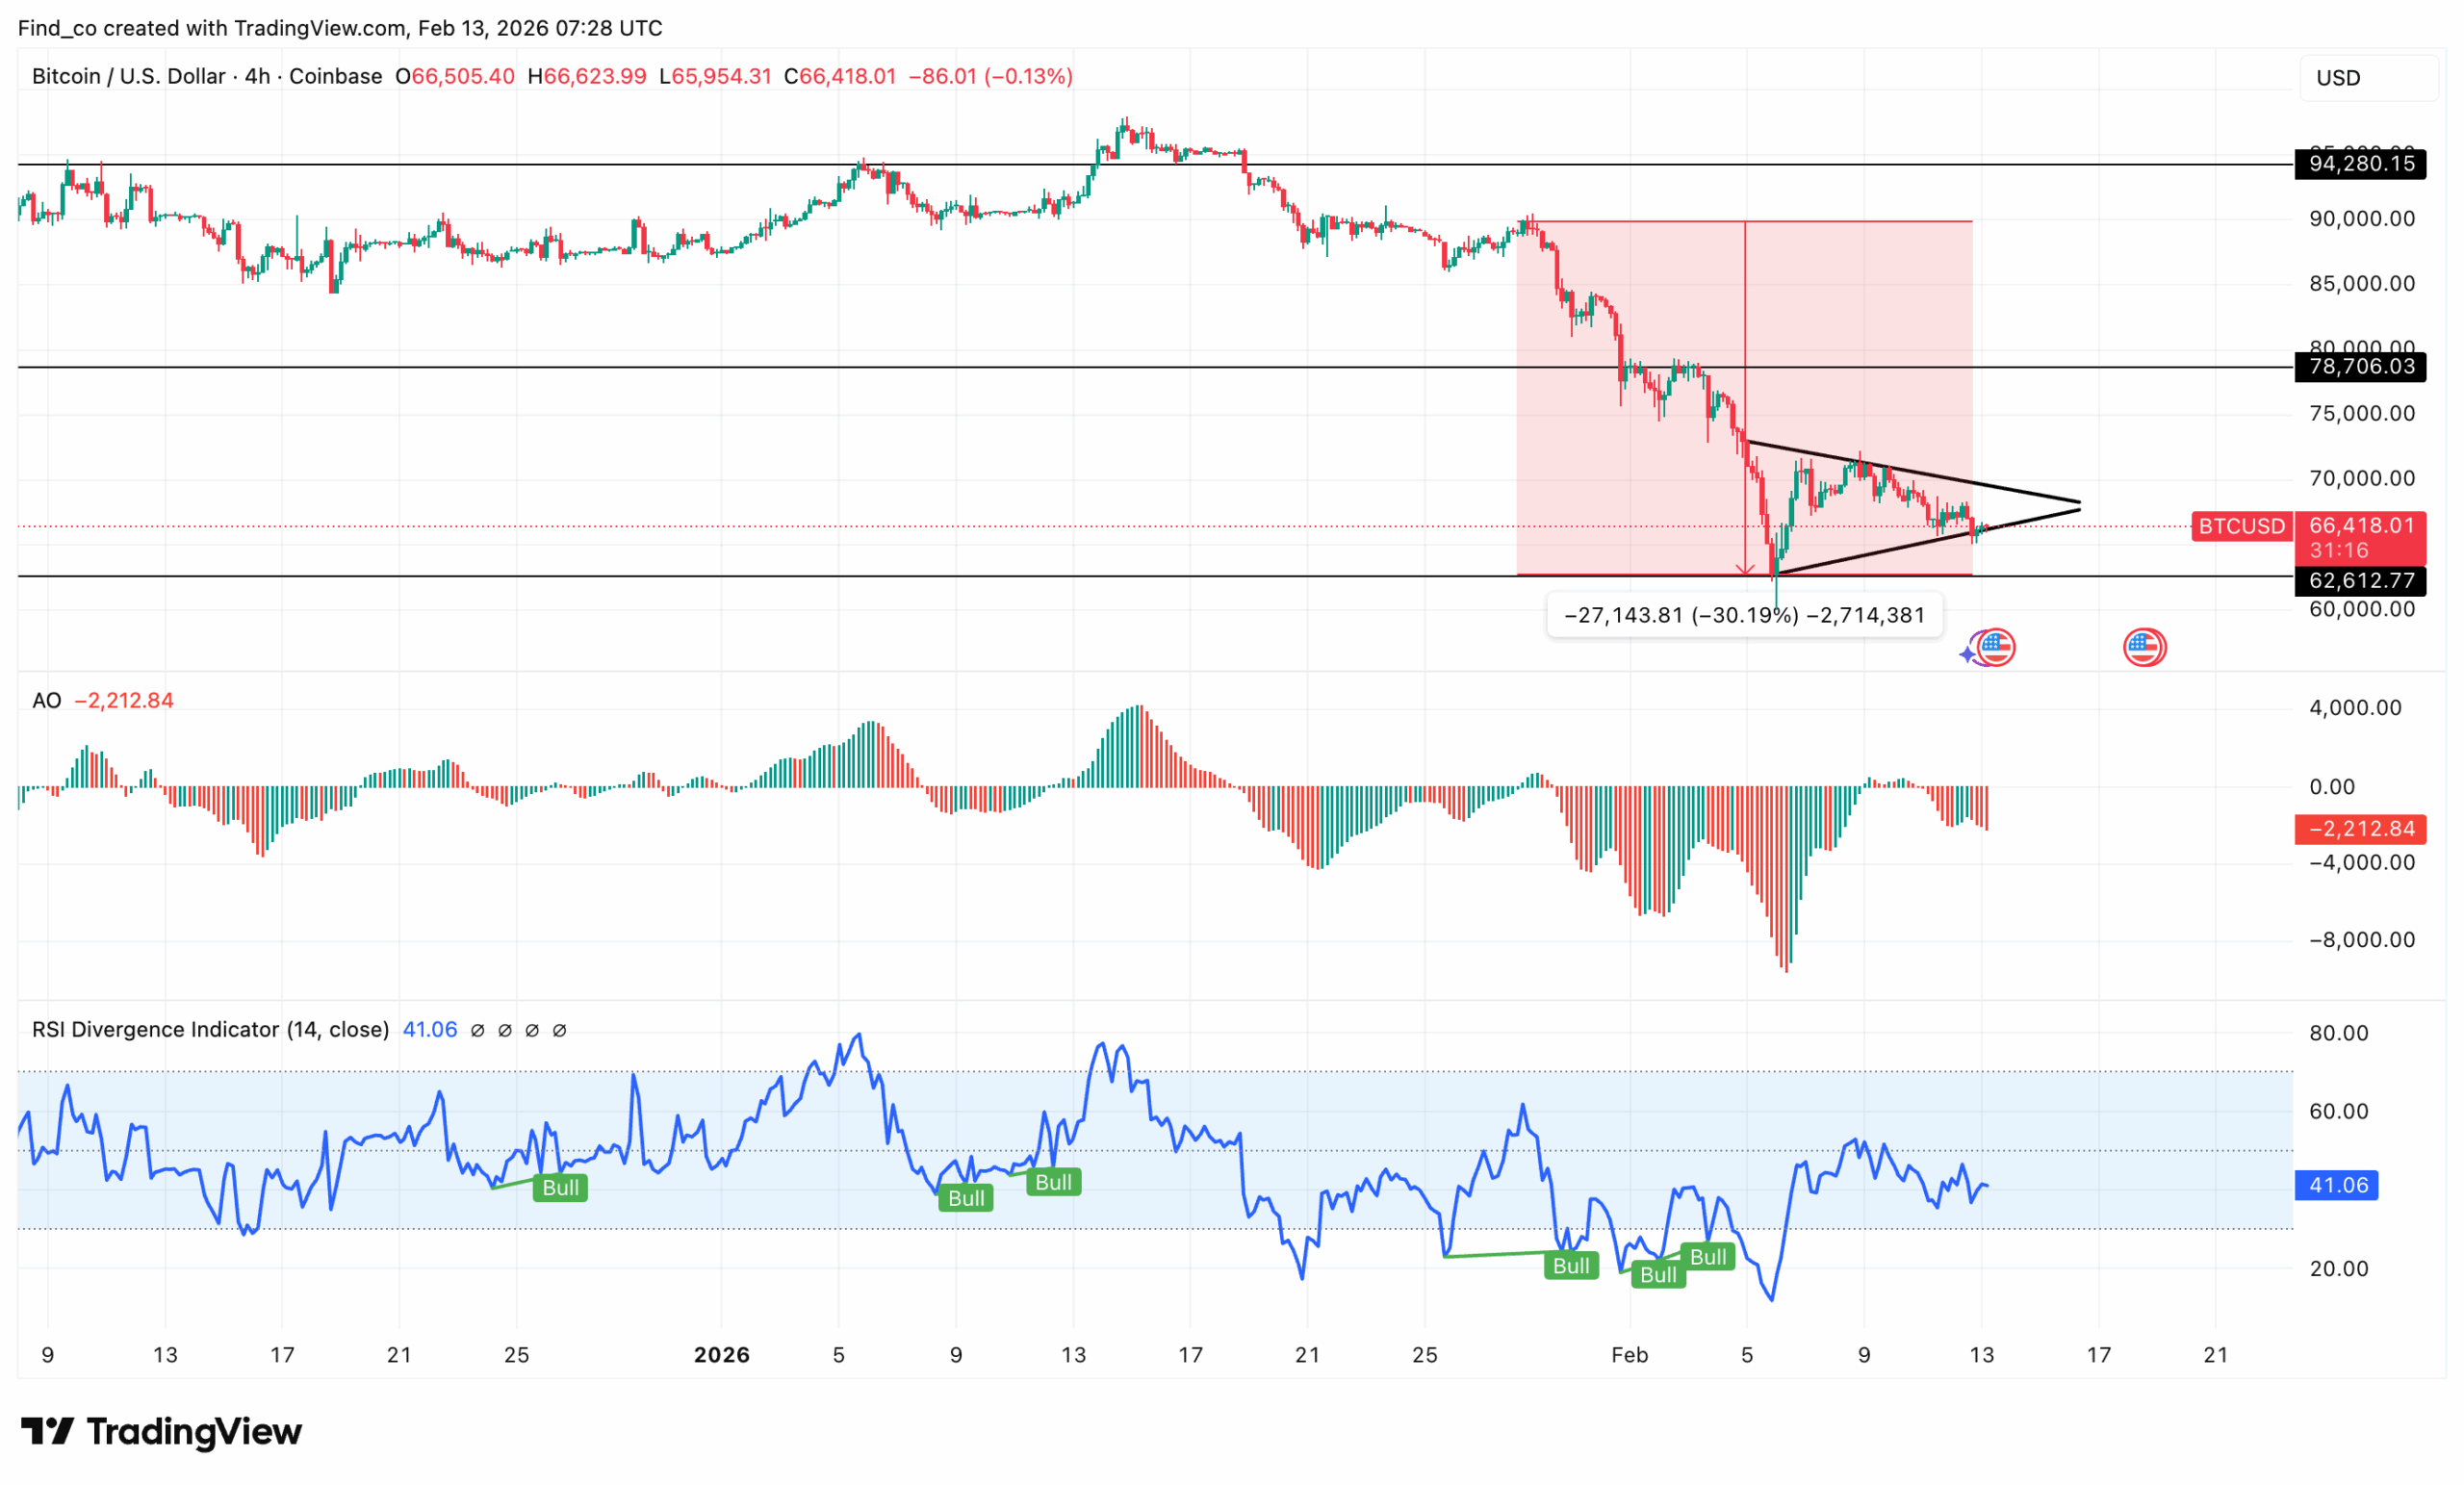
Ahead of today’s US CPI, Bitcoin’s price has extended its 30-day decline to 30%.
Looking at the 4-hour chart, it doesn’t seem the coin will recover anytime soon.
Notably, BTC is consolidating after the 30% drawdown from the local top near $94,000.
As shown below, the Price is now compressing into a symmetrical triangle between roughly $66,000 support and descending resistance from the $73,000 region.
This structure reflects short-term balance after aggressive selling,
Furthermore, the Awesome Oscillator (AO) remains negative, showing downside momentum still dominates.
On the flip side, a breakout above the descending trendline and reclaim of $72,000 would be the first signal that a recovery could be underway.
Truflation’s Counterpoint: The 2.15% Divergence
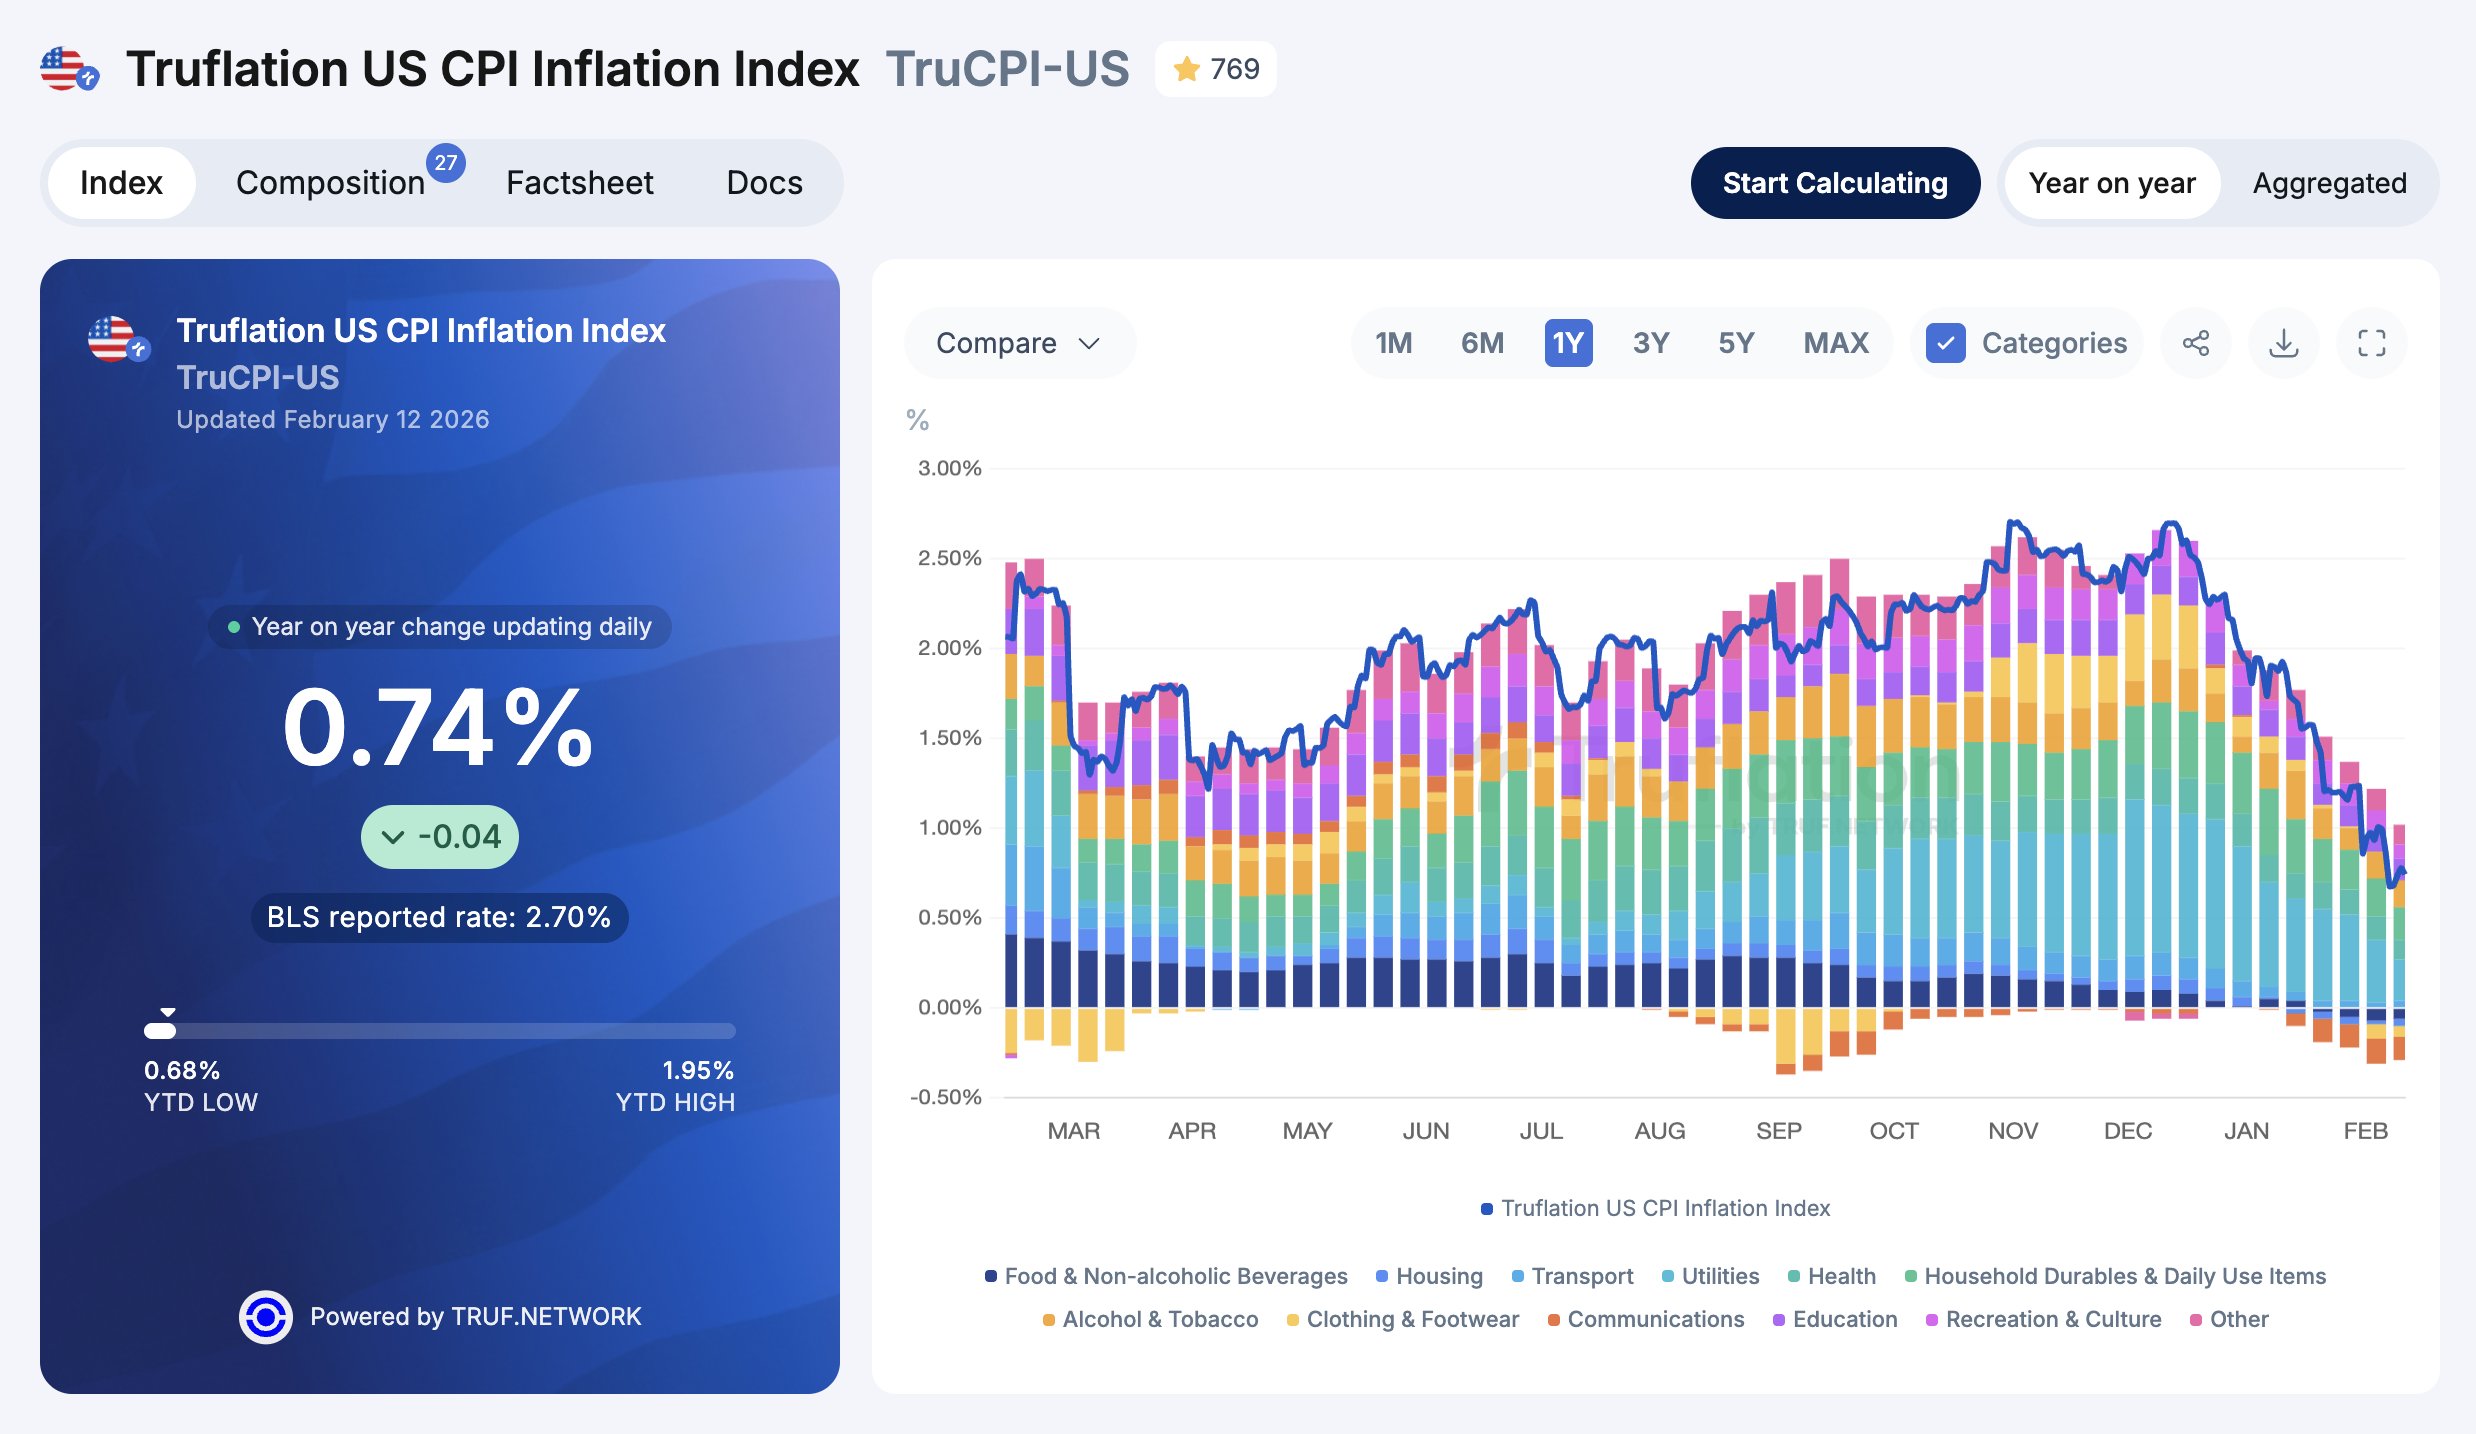
However, while traditional banks brace for heat, real-time inflation tracker Truflation paints a different picture.
Their data suggests U.S. inflation is running closer to 2.15%, well below consensus expectations.
The argument hinges on methodology: official CPI heavily weights lagging shelter costs, while real-time housing has already cooled; if this happens, Bitcoin’s price might not experience an accelerated drawdown.
On the downside, cumulative long liquidations (red curve) build steadily below the price, with notable concentration from roughly $65,000 down to $63000.
However, heavier pockets extend toward $60,000. A push below the recent $62.600 low would likely accelerate long liquidations and create a cascade move.
If that is the case, a drawdown to that level could wipe out over $1 billion in open long leverage positions.
On the upside, the green cumulative short liquidation curve rises aggressively above the current price, especially from $68,000 through $72,000.
In this instance, if Bitcoin’s price rises after the CPI, shorts could experience less than $500 million in liquidation.
The leverage distribution shows significant 50x and 100x positioning stacked both above and below the current price.
However, the upside liquidity pool looks larger in aggregate. That creates conditions for volatility to expand in either direction.
BTC Price Prediction
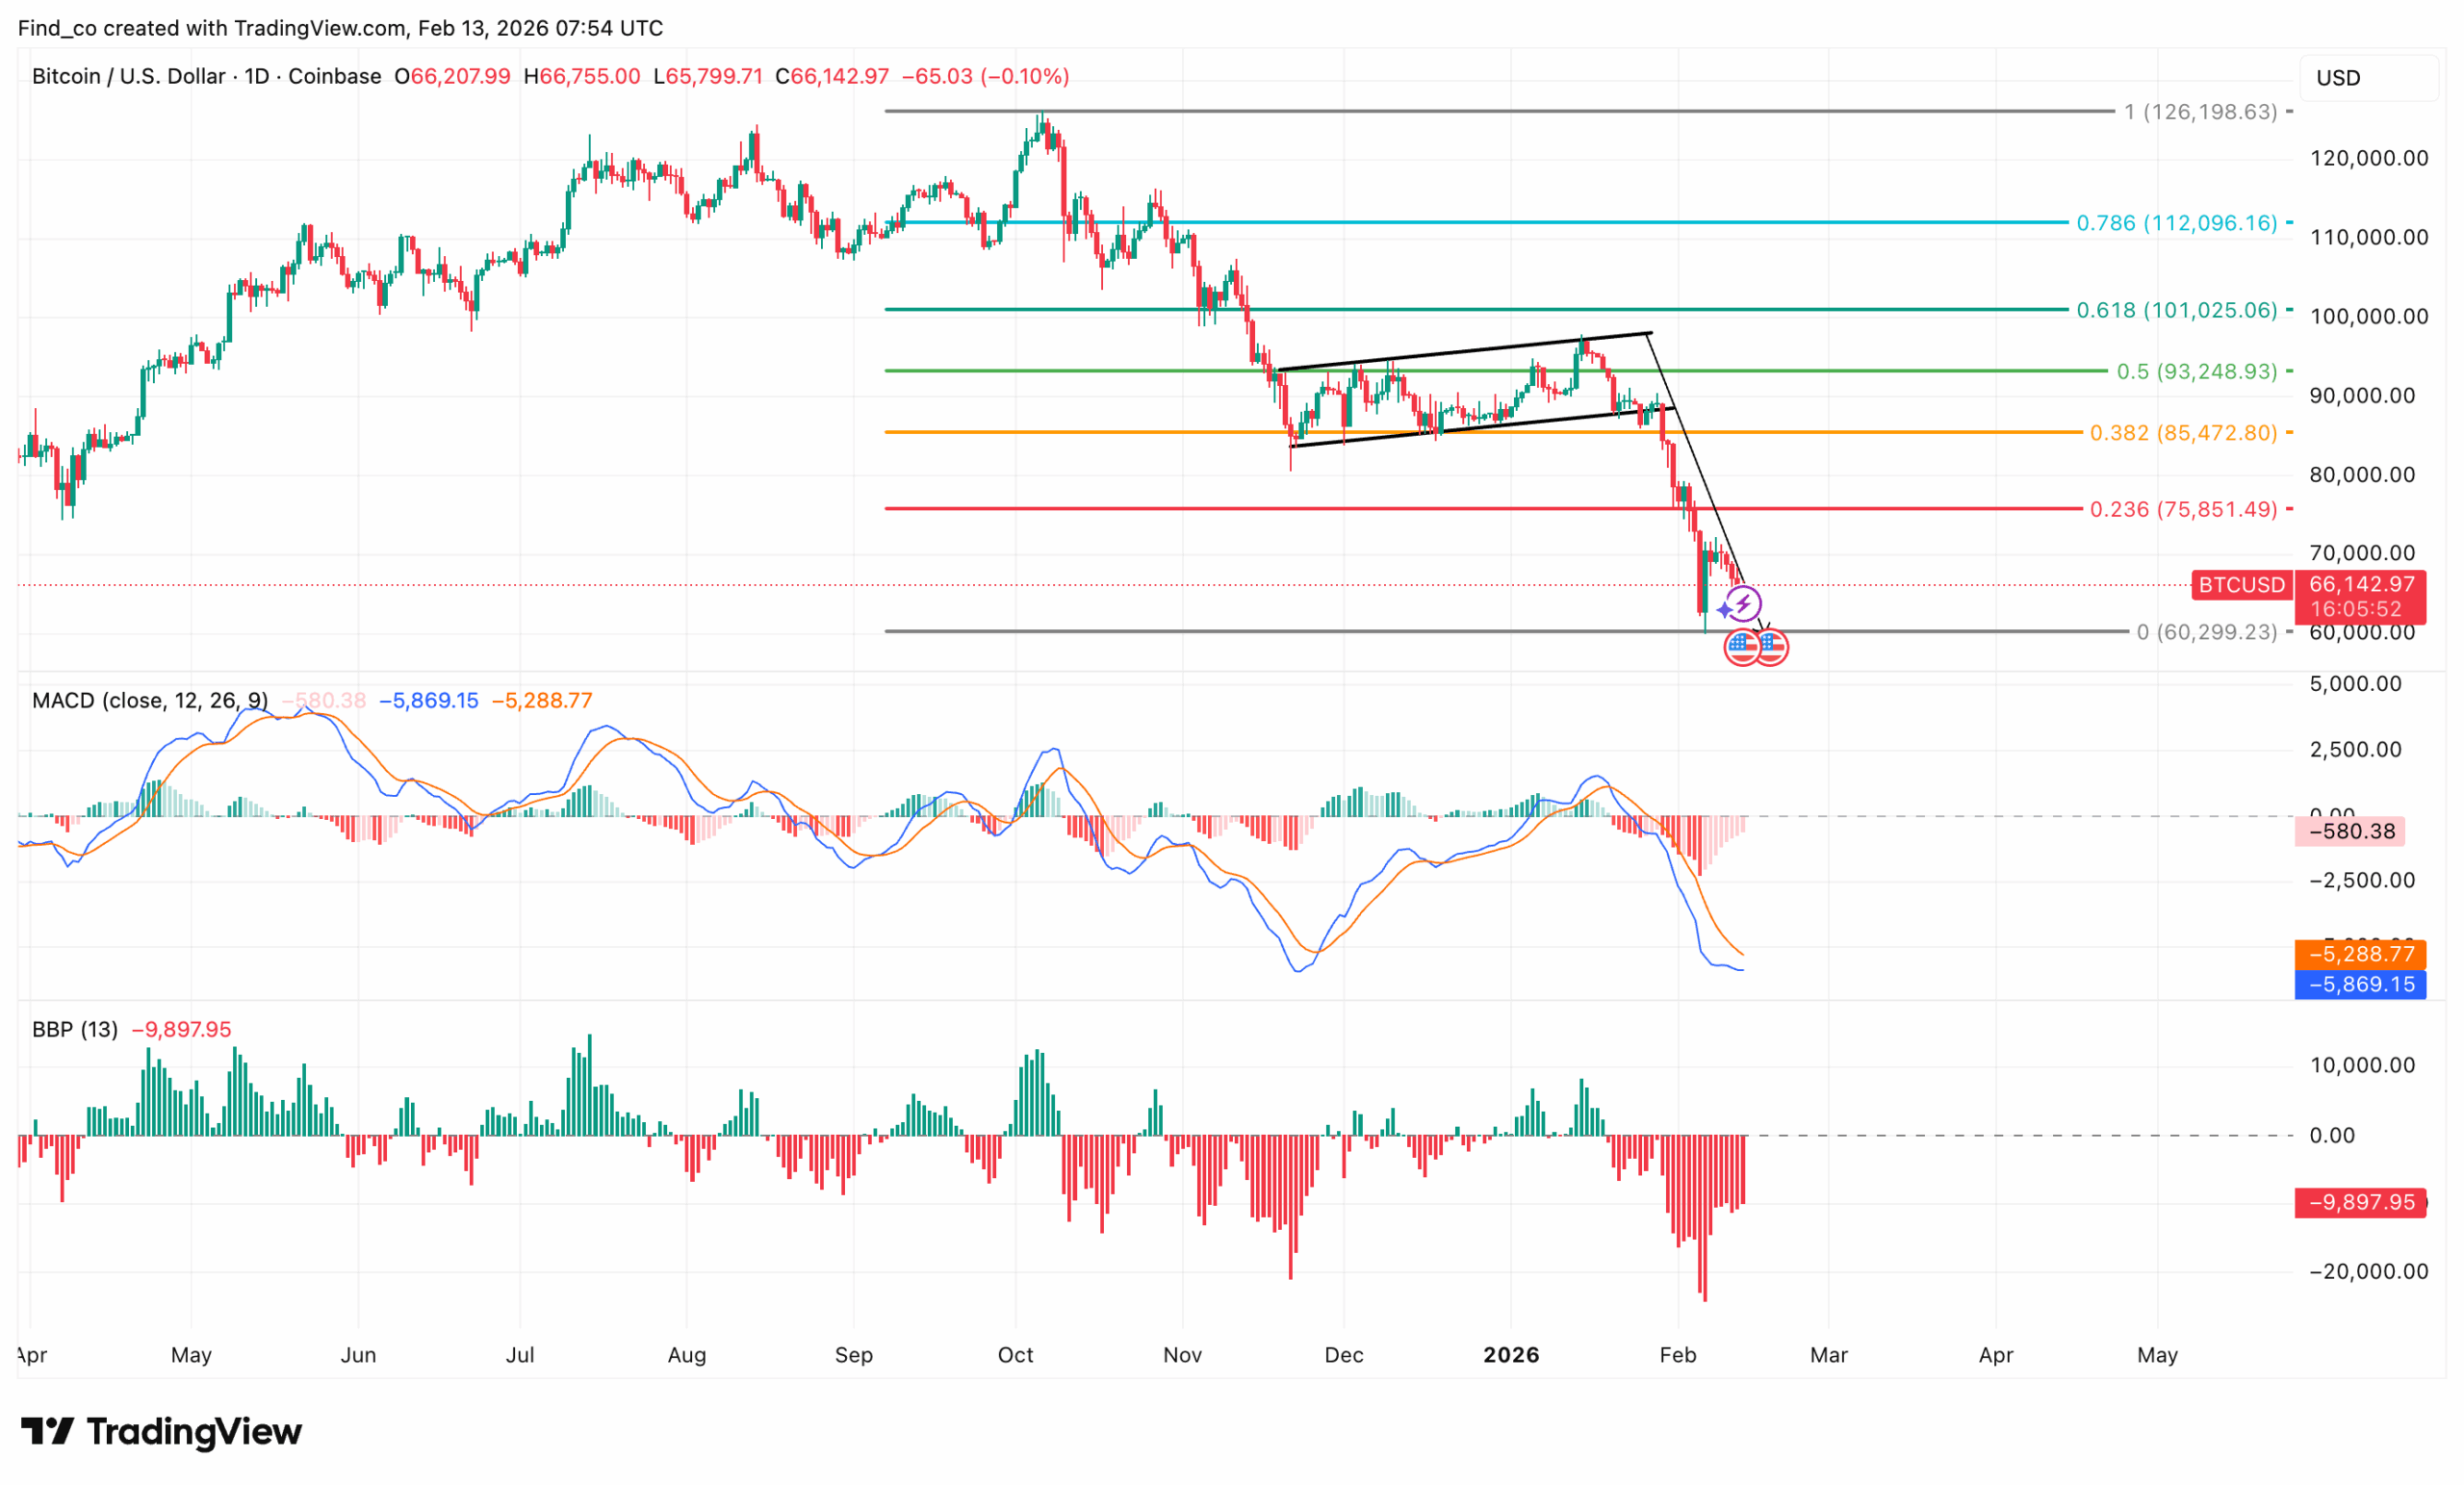
On the daily timeframe, Bitcoin’s price has broken down from the rising wedge that formed between roughly $85,000 and $95,000.
That breakdown accelerated after the price fell below the 0.382 Fibonacci level near $85,472.
The earlier rejection of the 0.5 to 0.618 retracement zone confirms that the structure shifted from corrective consolidation to impulsive downside continuation.
Price is now trading around $66,000, sitting just above the macro support near $60.299, which marks the zero Fibonacci level from the larger swing.
This level is critical. It acted as the final support during the recent capitulation wick
In addition, the daily Moving Average Convergence Divergence (MACD) shows a strong bearish setup with both lines negative, reflecting sustained downside pressure.
The Bull Bear Power (BBP) histogram is also heavily negative, indicating persistent selling dominance rather than just a quick liquidation event.
There are no clear bullish divergences yet on this timeframe.
Disclaimer:
The information provided in this article is for informational purposes only. It is not intended to be, nor should it be construed as, financial advice. We do not make any warranties regarding the completeness, reliability, or accuracy of this information. All investments involve risk, and past performance does not guarantee future results. We recommend consulting a financial advisor before making any investment decisions.
Victor Olanrewaju is a crypto analyst and reporter at CCN with deep roots in on-chain research and technical analysis. His crypto journey began in 2017, but it was the 2020 Uniswap airdrop that sparked a full-time pivot into the space.
With a foundation in copywriting, Victor honed his craft creating high-converting content for leading crypto brokers — most notably an XRP price prediction that ranked #1 on Google during the 2021 bull run.
He later joined AMBCrypto in 2022, where he combined storytelling with technical and on-chain analysis to cover key market narratives.
In 2024, he expanded his expertise at BeInCrypto, collaborating with analysts and using tools like Glassnode, Santiment, and IntoTheBlock to break down Bitcoin and altcoin trends.
At CCN, Victor covers the top cryptocurrencies, memecoins, macro shifts, blending real-time insights with deep-dive metrics.
He holds a Bachelor’s degree in Physics from the University of Ibadan, equipping him to simplify complex data for a wide audience. Follow his work or connect on LinkedIn or X.