Bitcoin Halloween Indicator: Trick or Treat for BTC Investors in November?
Share
Key Takeaways
Bitcoin’s $80,000 support faces a Halloween test, with Glassnode identifying resistance between $85,000 and $87,500.
Glassnode reported $653 million in Bitcoin ETF inflows on Oct. 19, but weak trading volumes raise questions about sustained demand.
Coinbase Institutional sees $73,000 to $75,000 as the next support zone if Bitcoin loses $80,000 to $82,000.
Bitcoin is approaching Halloween with an uncomfortable question for investors: Will November bring a recovery or another round of selling?
The cryptocurrency has struggled around $80,000 in October, leaving traders watching whether institutional demand can support prices as the market enters the final two months of 2026.
Historically, November has produced some of Bitcoin’s strongest rallies. However, the Halloween indicator, the idea that seasonal market patterns can help predict year-end returns, offers no guarantee that Bitcoin will follow previous cycles.
Monday Playbook || Week 10
Everyone expected UPtober.
A bearish November could be the plot twist; Anthropic IPO, Bearish market signals.
This year, the seasonal argument faces a particularly difficult test. Recent research from Glassnode and Coinbase Institutional shows Bitcoin caught between concentrated selling pressure above current prices and institutional cost bases below.
Try Our Recommended Crypto Exchanges
Sponsored
Disclosure
We sometimes use affiliate links in our content, when clicking on those we might receive a commission at no extra cost to you. By using this website you agree to our terms and conditions and privacy policy.
Bitcoin’s Halloween Indicator Meets the $80,000 Test
The Halloween indicator stems from a traditional stock market seasonal investing strategy, often summarized as buying around Halloween and holding through spring.
For Bitcoin, the question has evolved into whether the cryptocurrency tends to recover in November and December.
But unlike a trading signal derived from blockchain activity, the Halloween indicator is a historical calendar pattern. It cannot explain why prices should rise in any particular year.
Glassnode’s Oct. 21 Week On-Chain report offers a more immediate way to assess Bitcoin’s prospects.
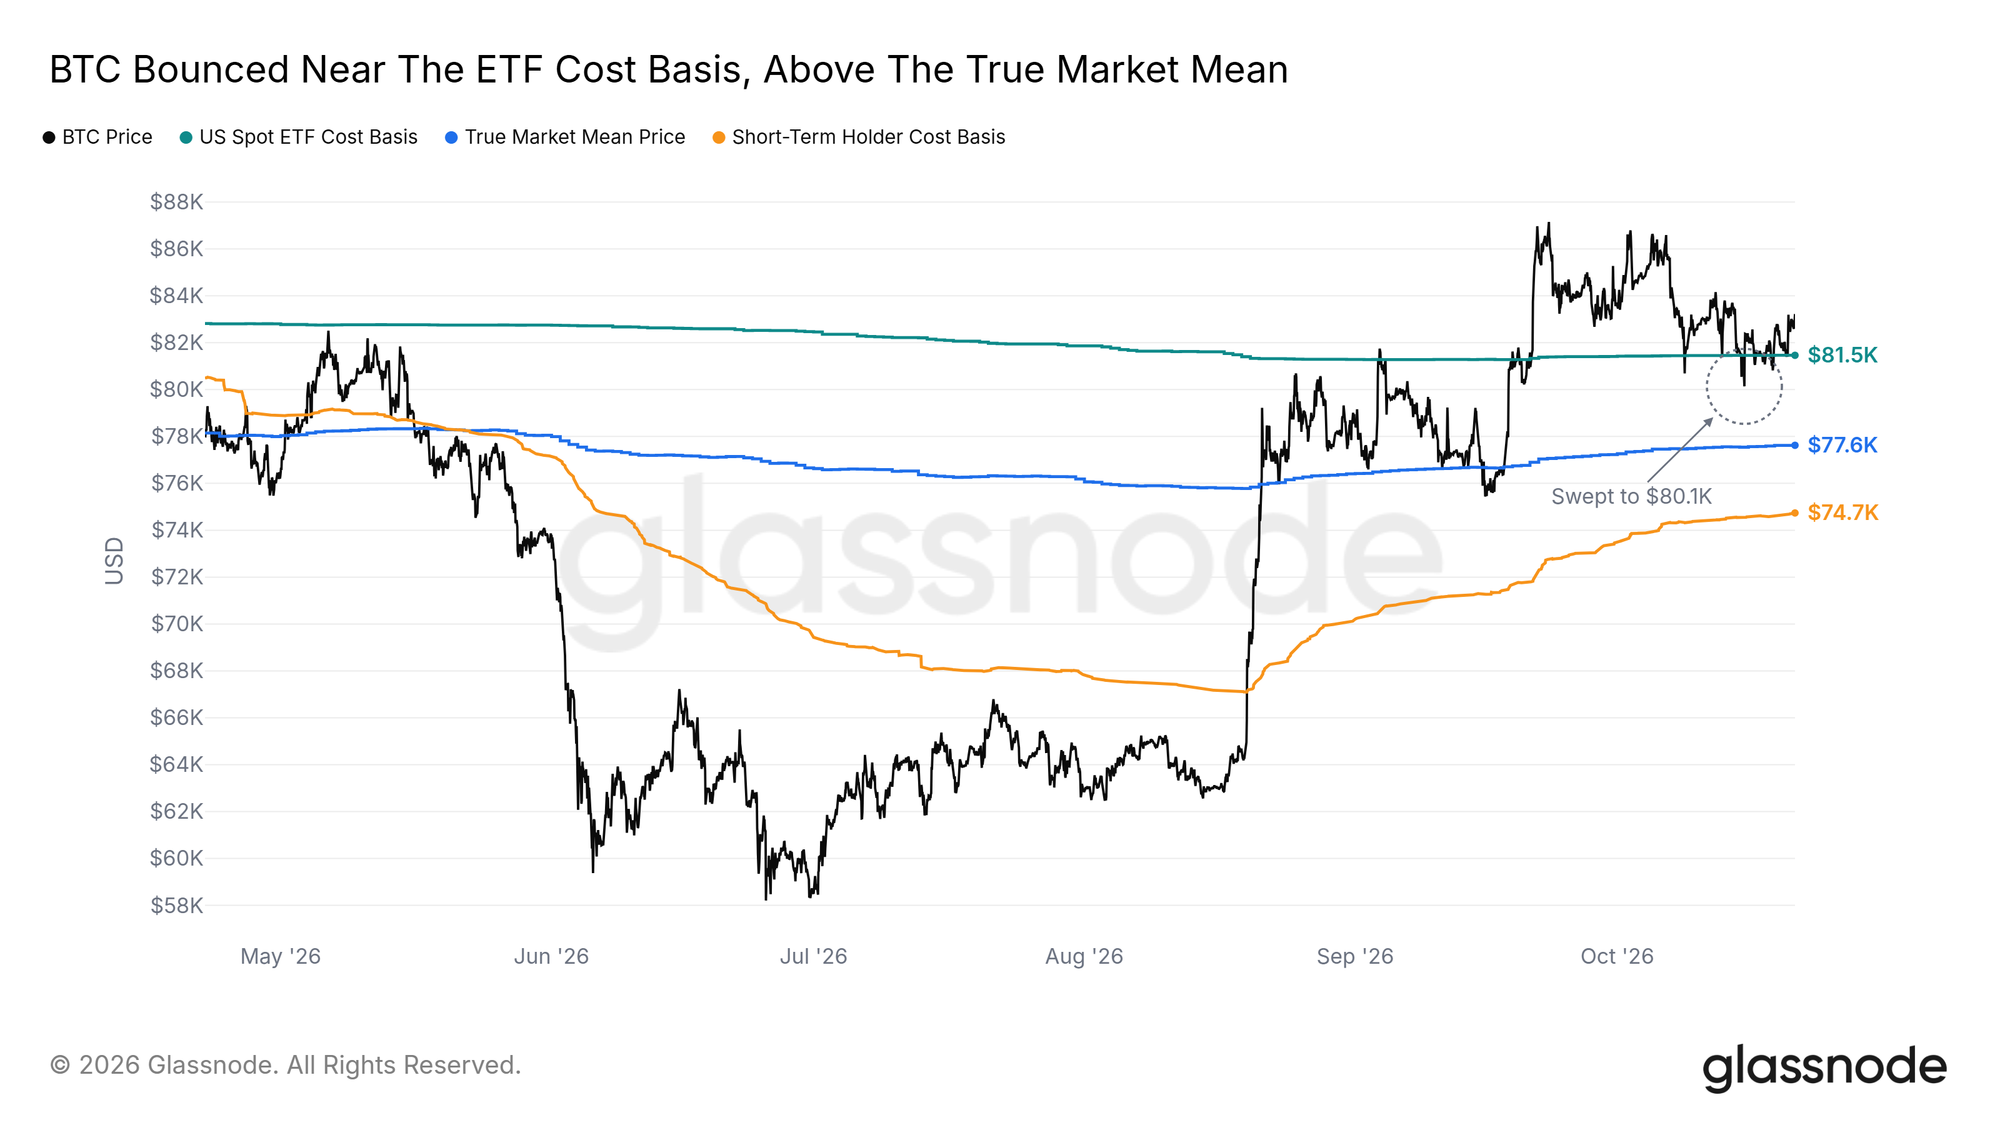
The analytics firm estimated that corporate Bitcoin treasuries held their coins at an average acquisition price of approximately $80,200, while the US spot Bitcoin ETF cost basis was around $81,500.
These levels matter because a sustained decline below them would leave the average holder in both groups facing unrealized losses.
BTC bounced near the ETF cost basis, above the True Market Mean. | Source: Glassnode
Glassnode also identified the True Market Mean, a measure of the average acquisition cost of economically active Bitcoin supply, near $77,600.
The report found that buying orders around $80,000 had replenished after Bitcoin briefly traded near that level on Oct. 15. However, it warned that a daily close below $80,000 could expose lower support.
That makes the Halloween period less about superstition and more about whether buyers can defend a price zone shared by two major institutional holder groups.
Glassnode Data Reveals $653 Million ETF Rebound, but There’s a Catch
Institutional demand presents a mixed picture heading into November.
According to Glassnode, US spot Bitcoin ETFs attracted approximately $653 million in net inflows on Oct. 19, their strongest single-day inflow since Sept. 22.
However, the firm identified a weakness beneath that recovery: ETF trading volume remained relatively subdued, with the 30-day average running at less than one-quarter of its level a year earlier.
This is important because a large inflow on a single day does not necessarily indicate a sustained recovery in institutional buying.
Glassnode also reported that realized profit-taking had slowed to approximately half the pace recorded around September’s market high, suggesting that some selling pressure had eased.
Still, the cryptocurrency faced substantial resistance between $85,000 and $87,500, where investor cost bases, exchange sell orders, and leveraged liquidation levels overlapped.
A sustained breakout would require buyers to absorb that supply rather than merely push prices higher through short liquidations.
Bitcoin’s November History: 37% Rally or Another 17% Decline?
Historical returns show why November attracts attention from Bitcoin investors, but also why relying on seasonality can be dangerous.
According to CoinGlass historical return data, Bitcoin gained approximately 37.3% in November 2024 and 8.8% in November 2023. However, it lost roughly 17.5% in November 2025.
The contrast becomes even clearer when comparing recent years.
Year
November BTC return
2020
+42.8%
2021
-7.1%
2022
-16.2%
2023
+8.9%
2024
+37.3%
2025
-17.5%
Approximate calendar-month returns, rounded from historical BTC/USD data. Figures can vary slightly by exchange and daily closing convention.
The results demonstrate that November has delivered both substantial gains and double-digit losses.
In 2024, Bitcoin’s strong performance coincided with a broader market rally following the US presidential election. In 2022, by contrast, the collapse of FTX intensified selling pressure across cryptocurrency markets.
That makes it difficult to separate any genuine seasonal effect from major events occurring during the same period.
The firm’s analysts identified $80,000 to $82,000 as Bitcoin’s most important near-term support region, citing the overlap between the ETF investor cost basis and the 50-day moving average.
If that area fails, Coinbase expects the next significant support between $73,000 and $75,000.
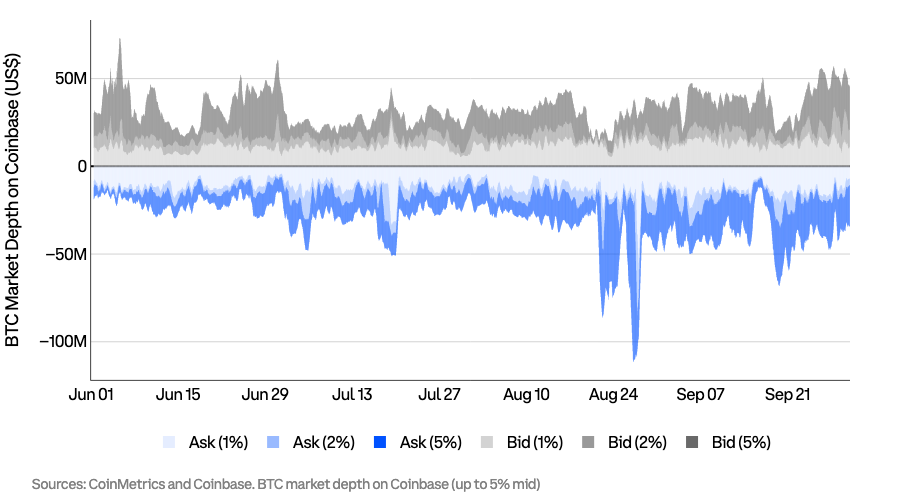
The research also identified approximately 2.1 million BTC that last moved between $87,500 and $91,700, citing Glassnode data. That represents roughly one-tenth of Bitcoin’s circulating supply concentrated in a relatively narrow price range.
BTC market depth on Coinbase (up to 5% mid). | Source: Coinbase
Investors who acquired coins at those prices may be inclined to sell as Bitcoin approaches their break-even levels, creating resistance to a sustained recovery. However, Coinbase did not dismiss the possibility of a rebound. Its analysts argued that the broader market setup remained constructive despite macroeconomic headwinds.
The firm also highlighted a major shift in institutional buying. Since August, spot Bitcoin ETFs have attracted approximately $6.4 billion, compared with $1.5 billion purchased by corporate treasuries.
The difference suggests ETFs have become a more important source of marginal demand, making sustained fund inflows particularly relevant to Bitcoin’s November outlook.
Will November Bring a Bitcoin Rally?
The immediate calendar could prove more influential than the Halloween indicator.
The Federal Reserve announces its next interest rate decision Oct. 28, with investors watching whether policymakers signal further tightening. Persistent inflation and higher Treasury yields could pressure Bitcoin by making interest-bearing assets relatively more attractive.
For a bullish November scenario, Bitcoin would need to maintain the $80,000 to $82,000 support region, attract consistent ETF inflows, and eventually break through the $85,000 to $87,500 resistance zone identified by Glassnode.
A stronger move above $90,000 would help clear the concentrated supply that Coinbase highlighted.
Conversely, losing $80,000 could expose Glassnode’s True Market Mean near $77,600, followed by Coinbase’s $73,000 to $75,000 support region.
Neither outcome is predetermined.
November is getting closer and it's gonna be a deciding month for bitcoin:native
If we see some big red candles pushing the price down, the journey to a new bottom could be completed in November
But if BTC finds support around 74k, we can say there won't be another lower low https://t.co/DlQ8bcmOrT
Bitcoin’s historical November gains provide an intriguing seasonal backdrop, but the latest on-chain evidence suggests the market is still searching for convincing demand.
For investors hoping for a Halloween treat, the more meaningful indicator may not be the calendar at all. It will be whether buyers can defend $80,000 and absorb the millions of coins held by investors waiting to break even.
Disclaimer:
The information provided in this article is for informational purposes only. It is not intended to be, nor should it be construed as, financial advice. We do not make any warranties regarding the completeness, reliability, or accuracy of this information. All investments involve risk, and past performance does not guarantee future results. We recommend consulting a financial advisor before making any investment decisions.
Dr. Guneet Kaur is a senior editor at CCN.com and a Science Fellow at Exponential Science. She is a fintech and blockchain expert with extensive experience in digital finance education, blockchain ecosystems, and cryptocurrency markets. She has worked with global media such as Cointelegraph, as well as education and blockchain platforms, to design and lead strategic content and learning initiatives. As an educator and assessor for top-tier executive programs, she bridges real-world fintech trends with academic insight.
Dr. Kaur is also a published researcher and peer reviewer across fintech and data science journals, including Financial Innovation Journal and International Journal of Big Data Intelligence and Applications. Her work spans data-driven analysis, Web3 innovation, and technical content development. With a strong foundation in both industry and academia, she translates complex financial technologies into practical applications, empowering learners, professionals, and institutions across the rapidly evolving digital finance landscape.