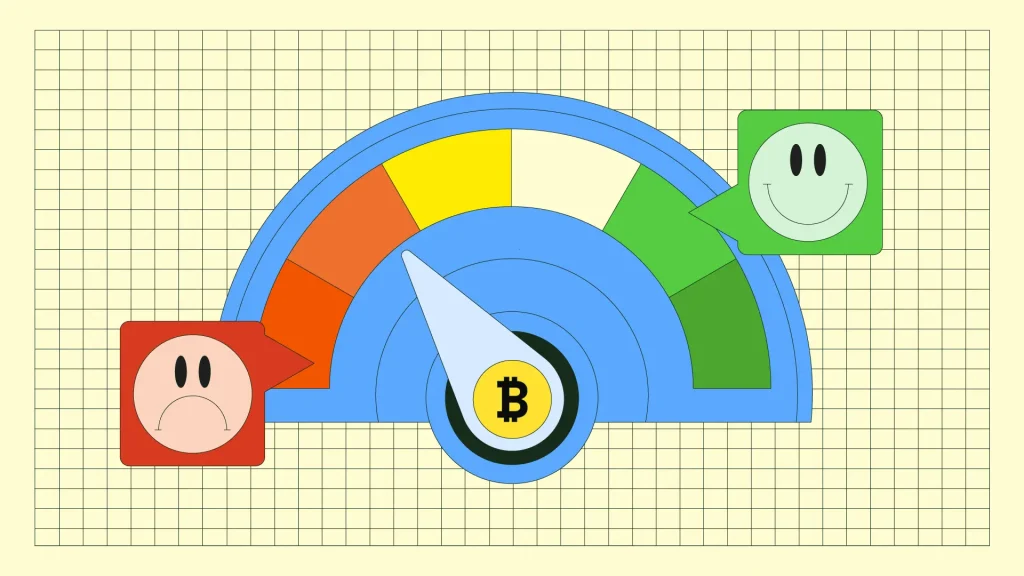
Bitcoin is struggling to hold above $60,000 as more than $4 billion exits spot ETFs. Analysts warn BTC could test $53,000 or even $47,000. | Credit: CCN.com
Share
Key Takeaways
Bitcoin is trapped in a critical range between $70,000 and $80,000, with options markets identifying these levels as the key support and resistance zones.
The $76,606 gamma flip is the most important near-term trigger, as a breakout above this level could force dealers to buy Bitcoin.
Funding rates remain flat, dealer gamma exposure is near neutral, and ETF flows are modest, indicating a lack of strong directional conviction.
Bitcoin is entering a critical phase of price compression, with both spot and derivatives markets pointing to a growing battle between bulls defending the $70,000 level and sellers capping rallies near $80,000.
While volatility has declined and market positioning remains relatively balanced, technical indicators suggest that pressure is building for a decisive move.
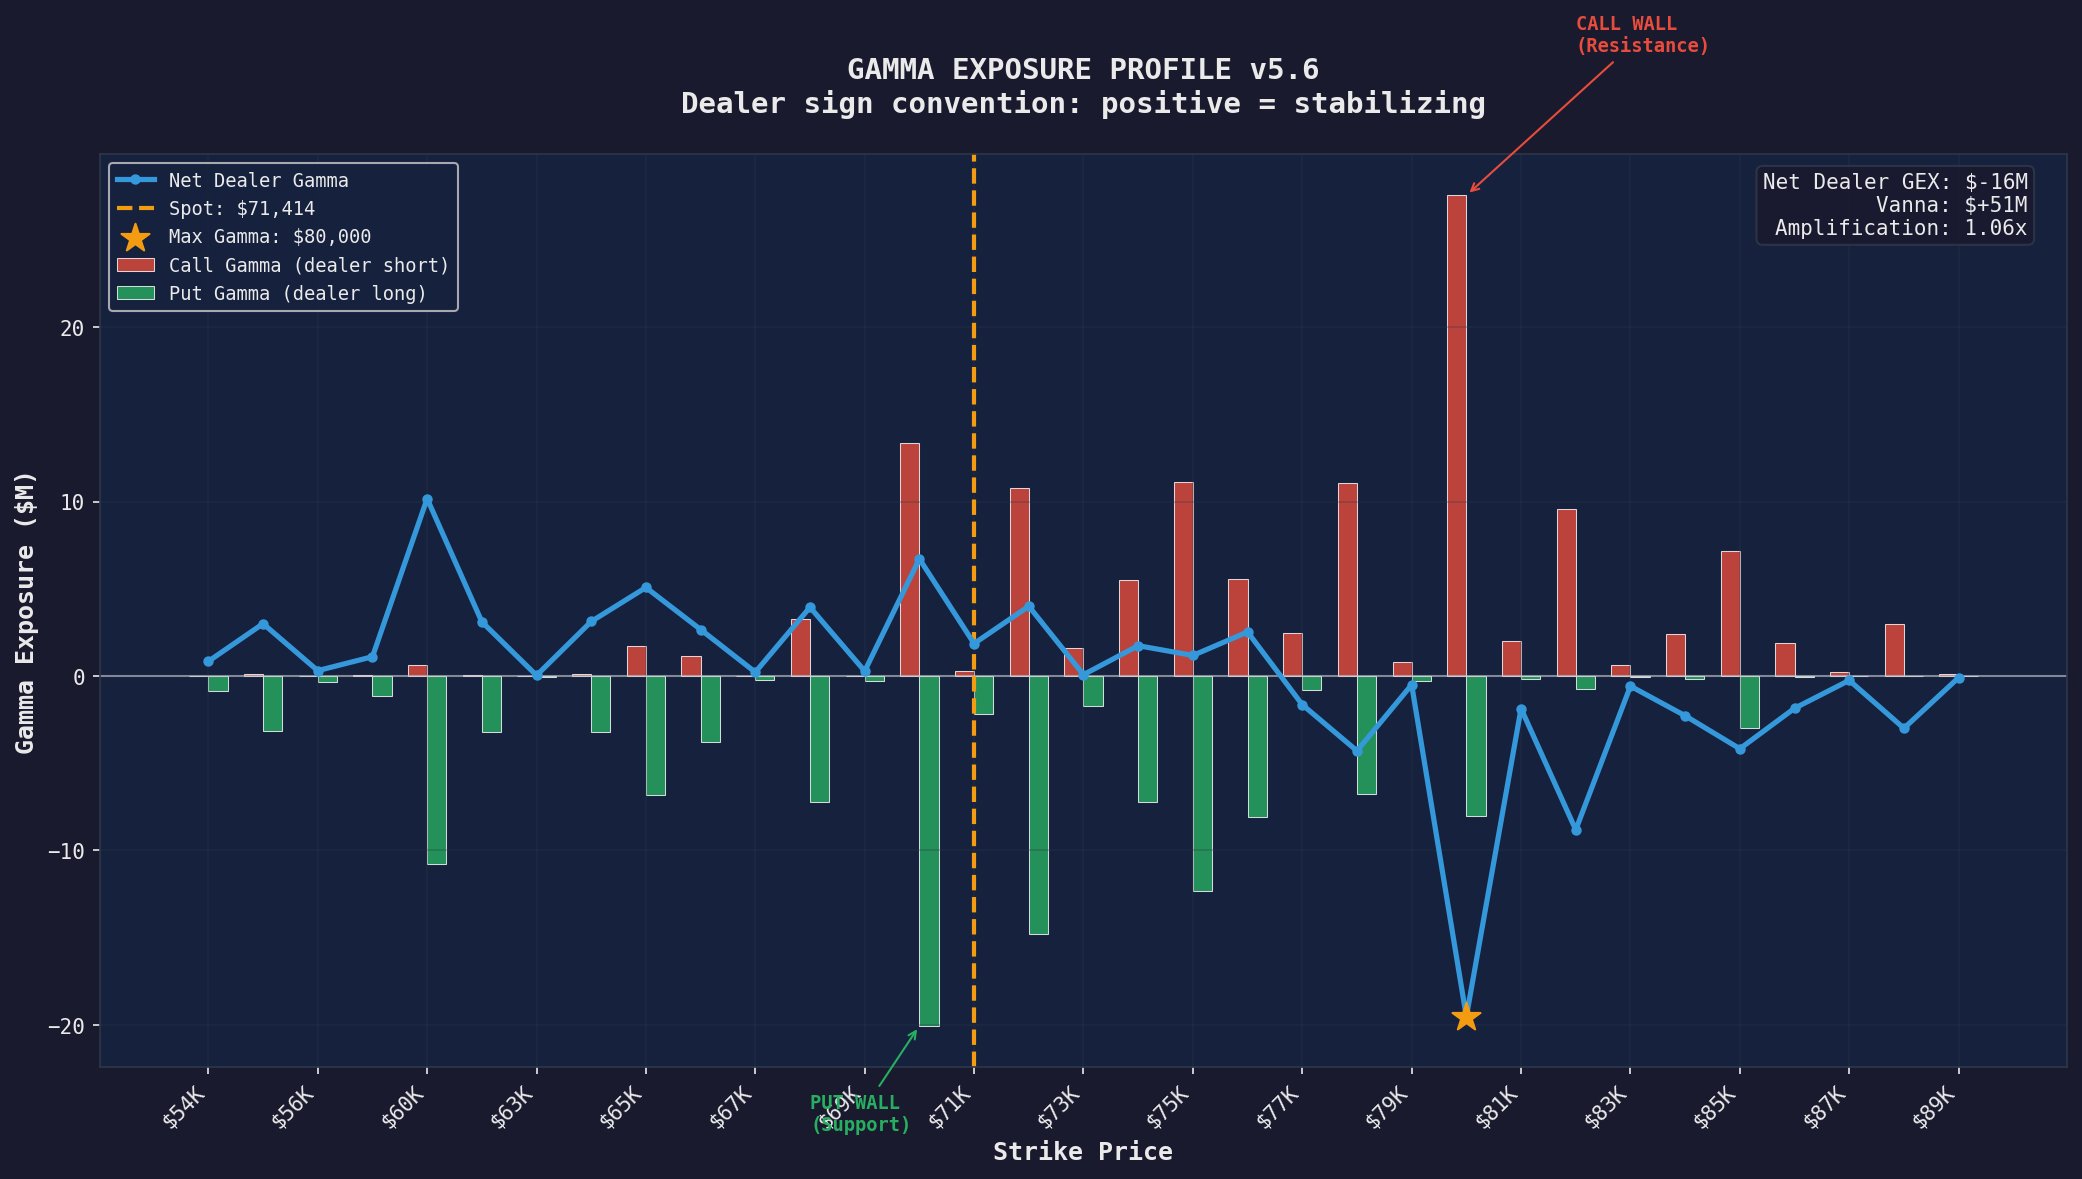
The current market structure shows Bitcoin trading below $69,400, trapped between a major put wall at $70,000 and a significant call wall at $80,000.
The narrowing range comes as traders weigh macro uncertainty, ETF demand, and weakening short-term technical momentum.
The question now is whether buyers can reclaim higher ground above $76,600 or whether the downside protection being purchased in the options market is signaling deeper weakness ahead.
Try Our Recommended Crypto Exchanges
Sponsored
Disclosure
We sometimes use affiliate links in our content, when clicking on those we might receive a commission at no extra cost to you. By using this website you agree to our terms and conditions and privacy policy.
Despite Bitcoin’s recent pullback, derivatives markets are notably calm. Dealer gamma exposure sits at approximately $16 million in the red, a level that is effectively neutral and far from the extreme readings typically associated with panic selling or euphoric buying. Funding rates across perpetual futures remain largely flat, indicating that neither longs nor shorts have established a dominant position.
ETF flows also remain modest, providing little directional catalyst for the market.
However, one metric stands out: options skew. Bitcoin’s 30-day risk reversal currently sits at negative 4.5%, reflecting stronger demand for puts relative to calls.
In practical terms, traders are willing to pay a premium for downside protection, suggesting that institutional participants see a heightened risk of further weakness.
This defensive positioning aligns with the key levels dominating the options market. The $70,000 put wall represents a major support zone where options-related flows could help stabilize prices.
Above the market, the $80,000 call wall acts as a significant resistance level, where dealer hedging activity may suppress upside momentum.
Between these levels lies perhaps the most important price point: the gamma flip level at $76,606. A sustained move above this threshold could force dealers to buy Bitcoin as prices rise, potentially accelerating bullish momentum.
Until then, the market remains trapped in a low-conviction environment.
Technical Indicators Point to Weakness
While derivatives traders are cautious, Bitcoin’s technical picture has deteriorated noticeably.
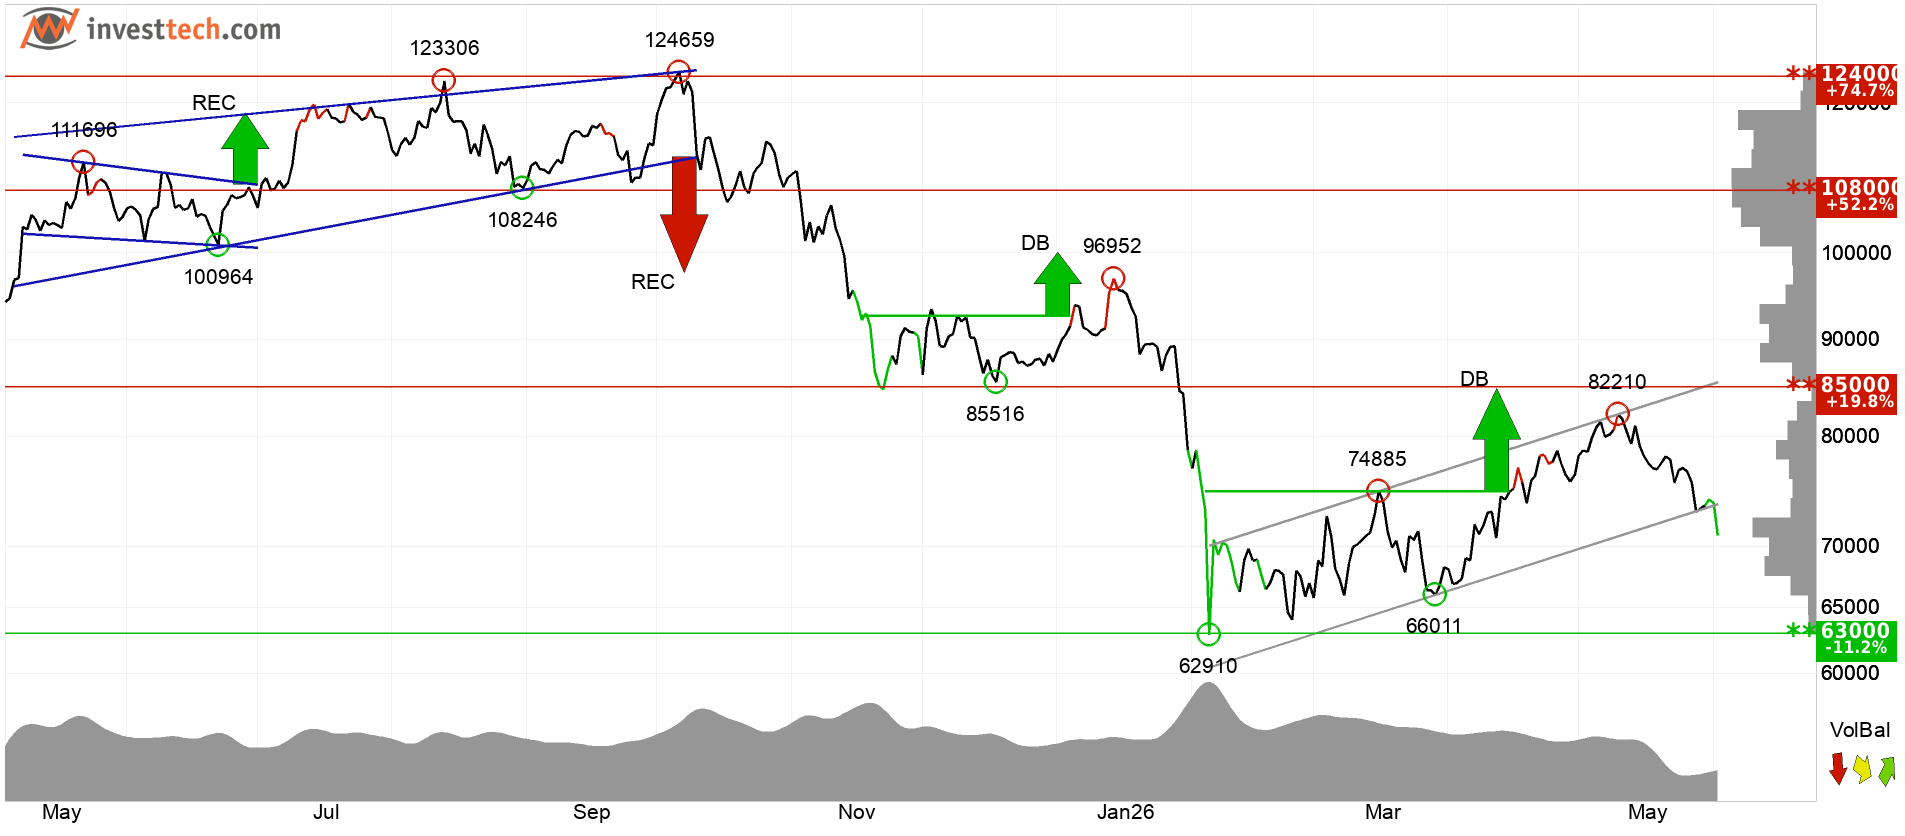
In the short term, Bitcoin has broken below the floor of a falling trend channel, a development that typically signals an acceleration of bearish momentum.
The next key support zone sits around $66,000, while resistance remains near $74,800.
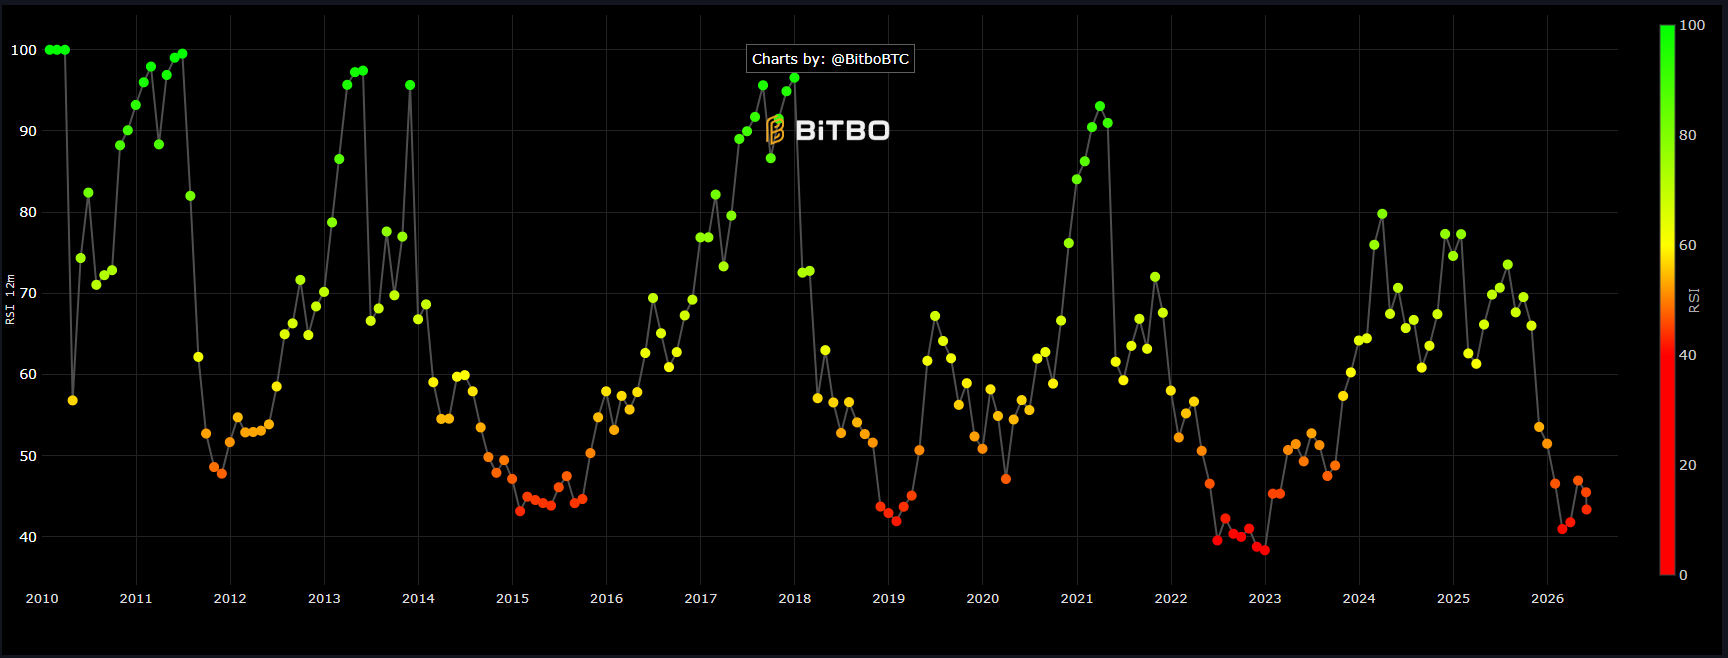
Adding to the bearish outlook, Bitcoin’s Relative Strength Index (RSI) has fallen below 30. Such readings indicate strong negative momentum and typically occur during periods of aggressive selling pressure.
The RSI itself continues to trend lower, reinforcing the broader weakness in price action.
At the same time, RSI readings below 30 can sometimes signal that an asset has become oversold. In highly liquid assets such as Bitcoin, these conditions occasionally precede sharp relief rallies as sellers become exhausted.
This creates a conflicting picture: momentum remains firmly negative, but the probability of a short-term rebound is increasing as bearish positioning becomes crowded.
The $76.6K Trigger Could Decide Bitcoin’s Next Major Move
The king of cryptocurrency has recently broken below the floor of a longer-term rising trend channel, suggesting that the powerful uptrend seen earlier in the cycle may be transitioning into a period of sideways consolidation.
Medium-term support remains near $63,000, while resistance sits around $85,000.
This broader range places the current battle between $70,000 and $80,000 into context. Bitcoin is not yet showing signs of a structural bear market, but neither is it displaying the strength needed for an immediate breakout.
The key level remains $76,606. A decisive move above the gamma flip could shift dealer positioning, improve market sentiment, and open the door toward the $80,000 call wall and potentially higher resistance levels near $85,000.
Conversely, failure to defend the $70,000 support zone could validate the bearish signals emerging from both technical indicators and options markets, exposing Bitcoin to a deeper retracement toward $66,000 and possibly the longer-term support region around $63,000.
For now, Bitcoin remains compressed between two powerful forces: a well-defended $70,000 floor and a stubborn $80,000 ceiling. As volatility contracts, the likelihood of a significant breakout or breakdown grows. The only question is which side blinks first.
Giuseppe Ciccomascolo began his career as an investigative journalist in Italy, where he contributed to both local and national newspapers, focusing on various financial sectors.
Upon relocating to London, he worked as an analyst for Fitch's CapitalStructure and later as a Senior Reporter for Alliance News. In 2017, Giuseppe transitioned to covering cryptocurrency-related news, producing documentaries and articles on Bitcoin and other emerging digital currencies. He also played a pivotal role in establishing the academy for a cryptocurrency exchange website. Crypto remained his primary area of interest throughout his tenure as a writer for ThirdFloor.