Home / Analysis / Crypto / Technical Analysis / Stellar (XLM) Joins Bitcoin, ETH, and XRP With Digital Commodity Status: Is $0.20 the Next Level to Hit?
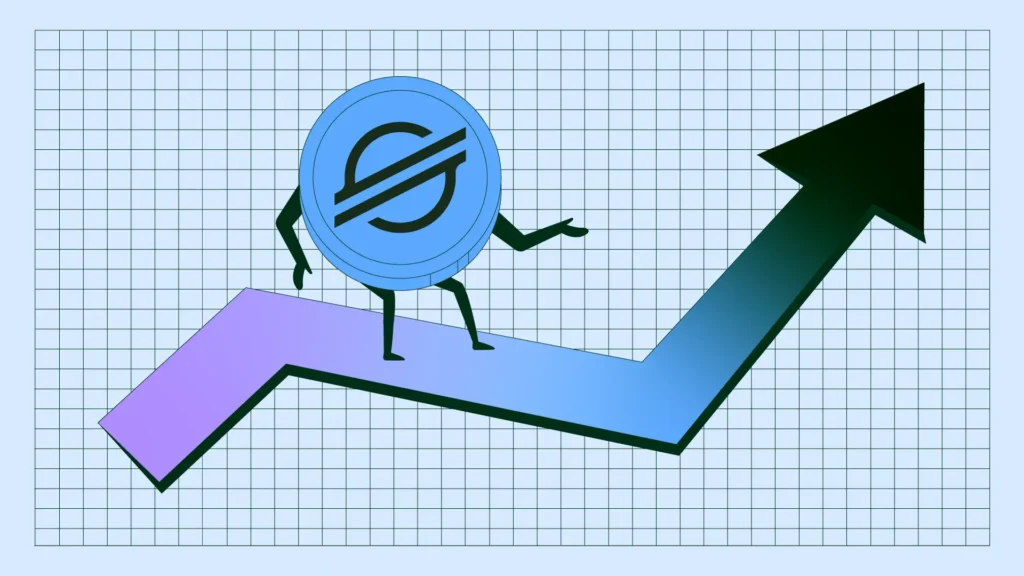
XLM forms an ascending triangle, targets higher values | Credit: Hameem Sarwar
Share
Key Takeaways
XLM was officially designated as a Digital Commodity in a joint interpretation by the SEC and CFTC.
On the 4-hour chart, a Golden Cross occurred as the 20-EMA crossed above the 50-EMA.
The RSI Divergence Indicator has flagged bullish signals, potentially driving XLM higher.
Stellar (XLM) has been one of the quieter stories in the altcoin market throughout early 2026.
While Bitcoin (BTC) reclaimed $74,000, Ethereum (ETH) fought its way back above $2,000, and XRP navigated the aftermath of its ETF outflow disruption, XLM’s price was doing something less visible.
For months, the altcoin had been grinding through a multi-month correction without generating any kind of explosive price action.
Then the regulatory news arrived. Stellar has just received digital commodity status.
This is the same classification that Bitcoin, Ethereum, and XRP hold. So, does this mean the XLM price will break out?
What Digital Commodity Status Actually Means
First, understand what this classification genuinely delivers beyond the headline. Digital commodity status is the regulatory designation that removes the most dangerous overhang from any crypto asset.
This is the risk of being classified as an unregistered security subject to SEC enforcement action.
Get These Top Crypto Casino Offers Now!
Sponsored
Disclosure
We sometimes use affiliate links in our content, when clicking on those we might receive a commission at no extra cost to you. By using this website you agree to our terms and conditions and privacy policy.
“The joint SEC/CFTC interpretation on crypto asset classification is an important step — for builders, institutions, and the adoption of public blockchains. As Congress works to finalize market structure legislation, this is the foundation it needs. We’re close. Let’s finish it,” Stellar Foundation CEO Denelle Dixon, said about the matter.
XLM Exits Bearish Trend
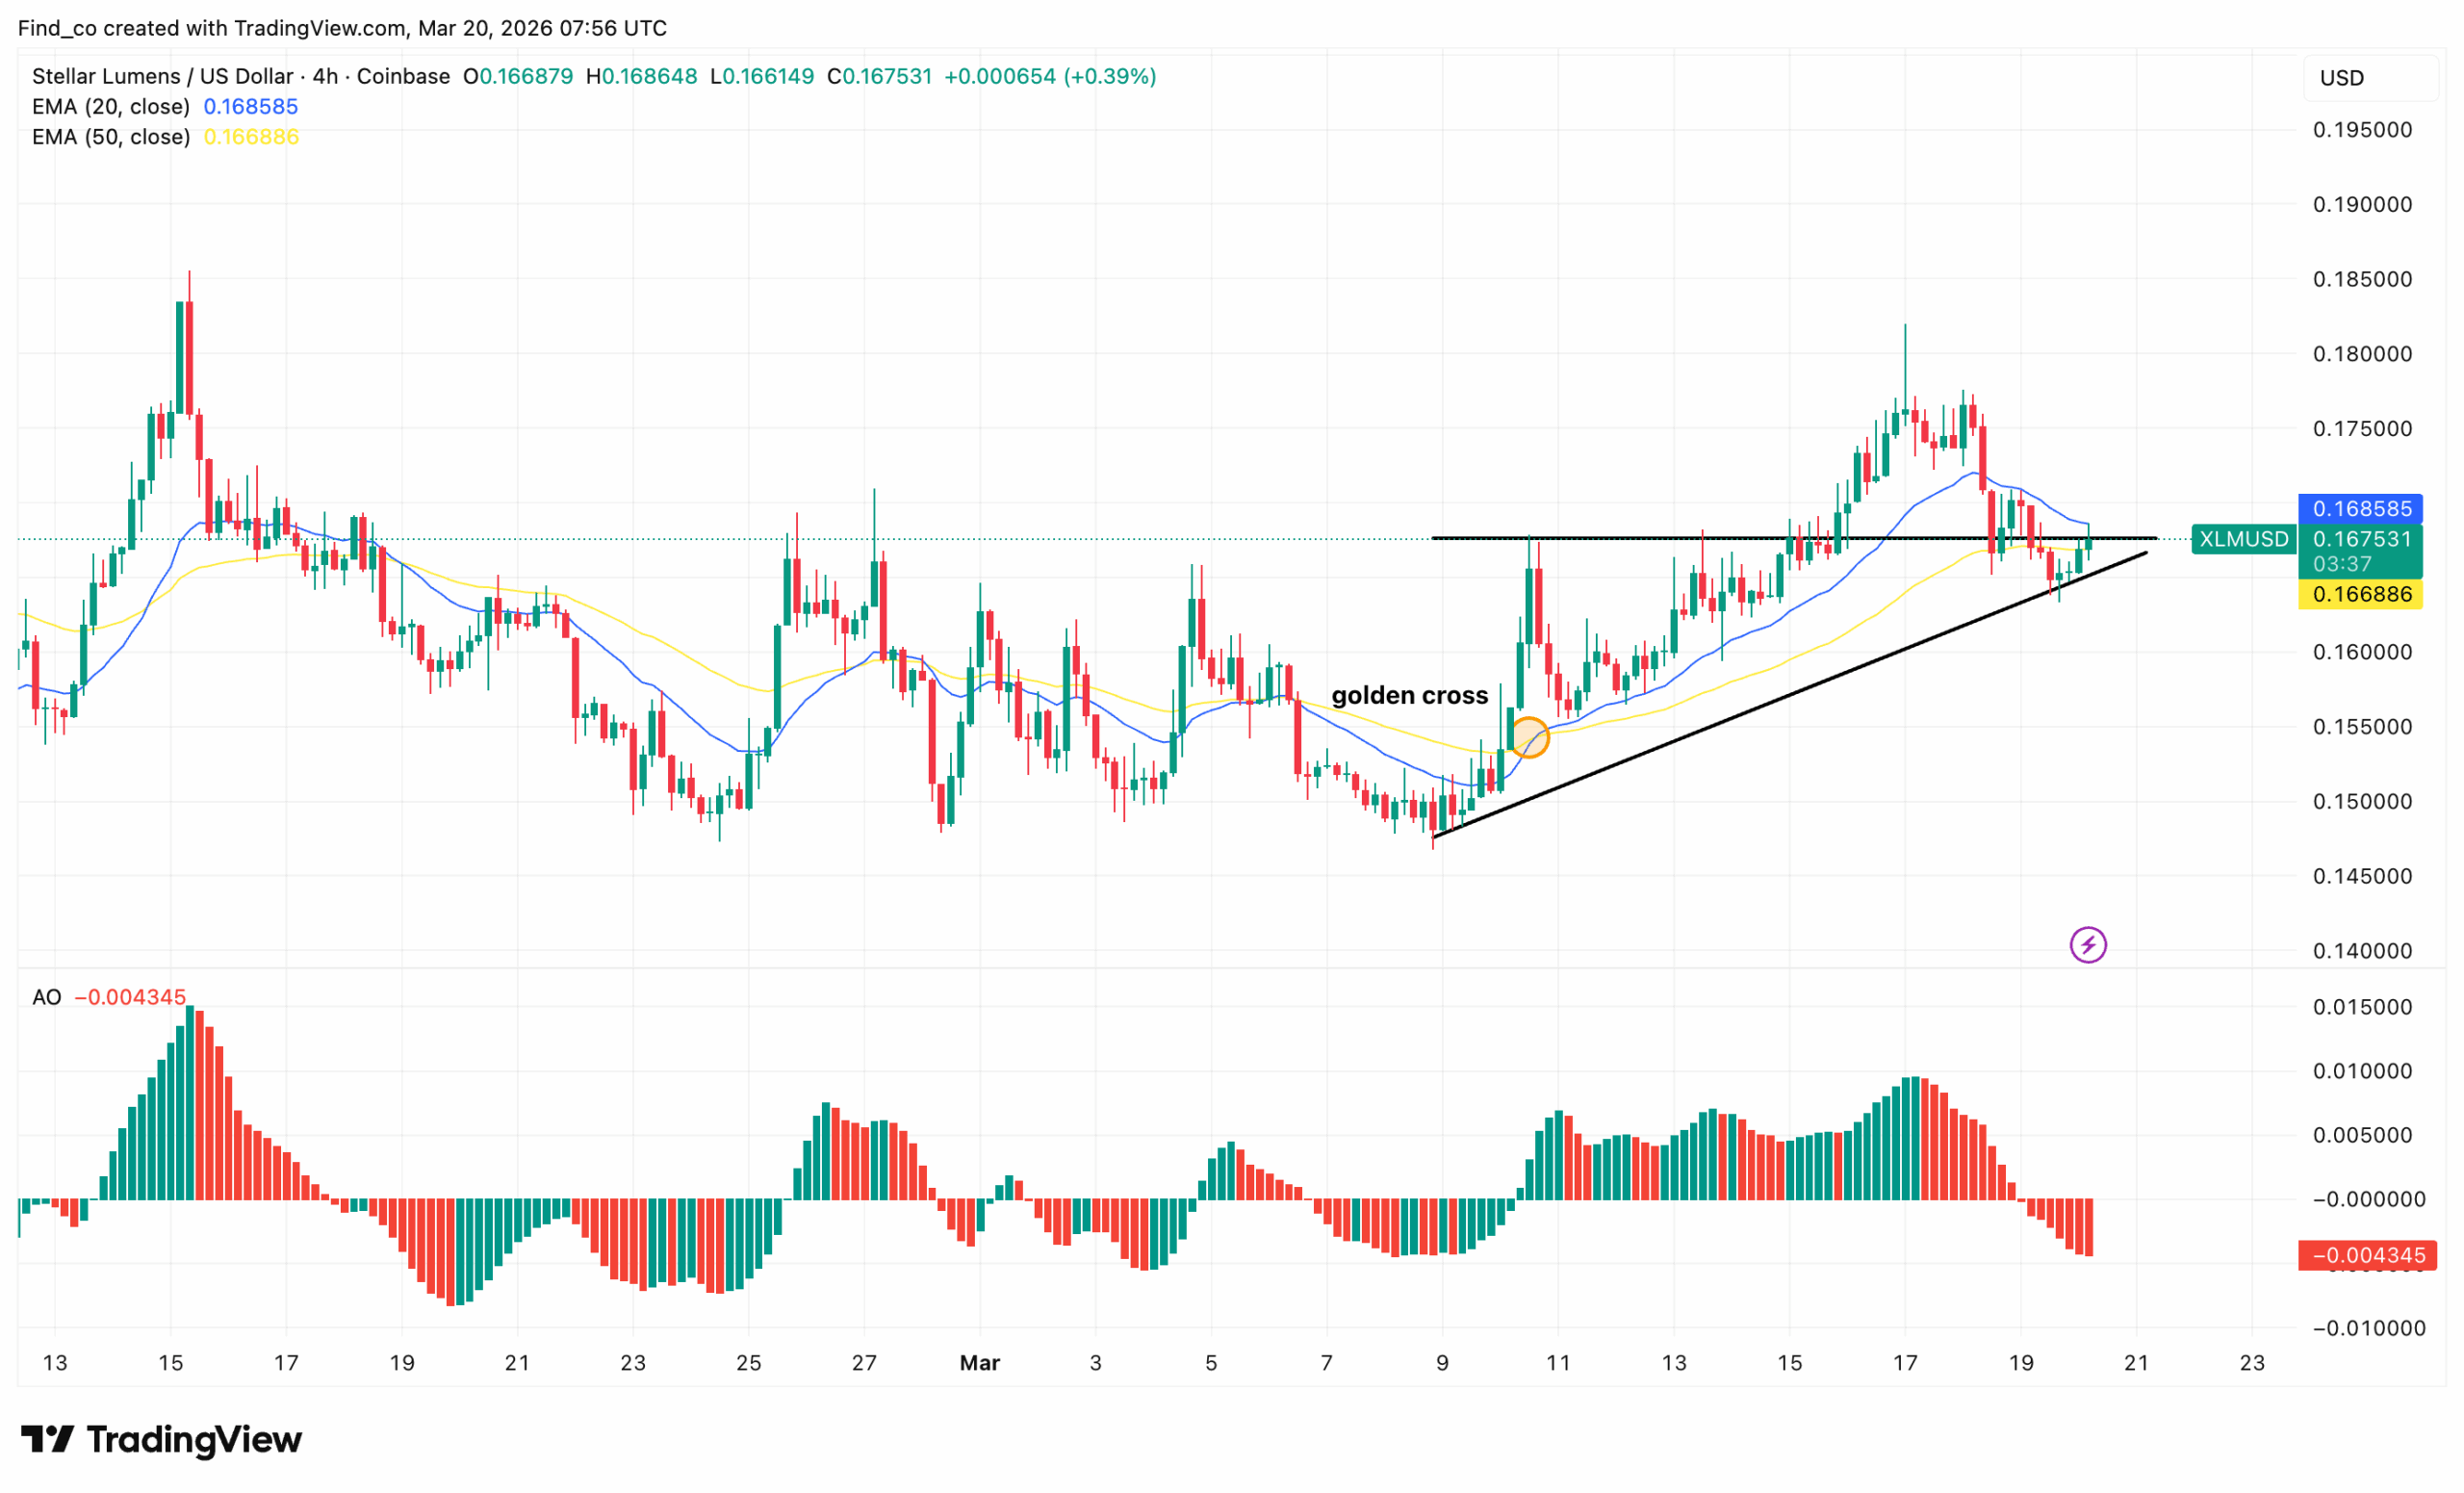
Following the development, the 4-hour chart shows that the XLM/USD trades at $0.17.
The most significant development came around March 9, when the 20 EMA crossed above the 50 EMA, triggering a golden cross.
As a result, XLM’s price rallied from lows near $0.15, reaching $0.18 before cooling off.
Since then, XLM has carved out an ascending triangle. A rising trendline has consistently caught dips, while a flat horizontal resistance near $0.16 has capped upside.
Both EMAs now converge tightly in that same zone, adding further weight to this level.
Currently, the price sits just beneath resistance, squeezing into the triangle’s apex. A close above $0.17 could trigger a breakout, potentially opening the door toward the $0.19 range.
However, traders might need to be careful. The Awesome Oscillator (AO) reads -0.004345, flashing bearish momentum in the short term.
Sellers are clearly defending the resistance zone. Until the AO flips positive and price breaks above the ceiling, the bulls haven’t fully taken control, leaving XLM at a critical juncture.
XLM Price Prediction
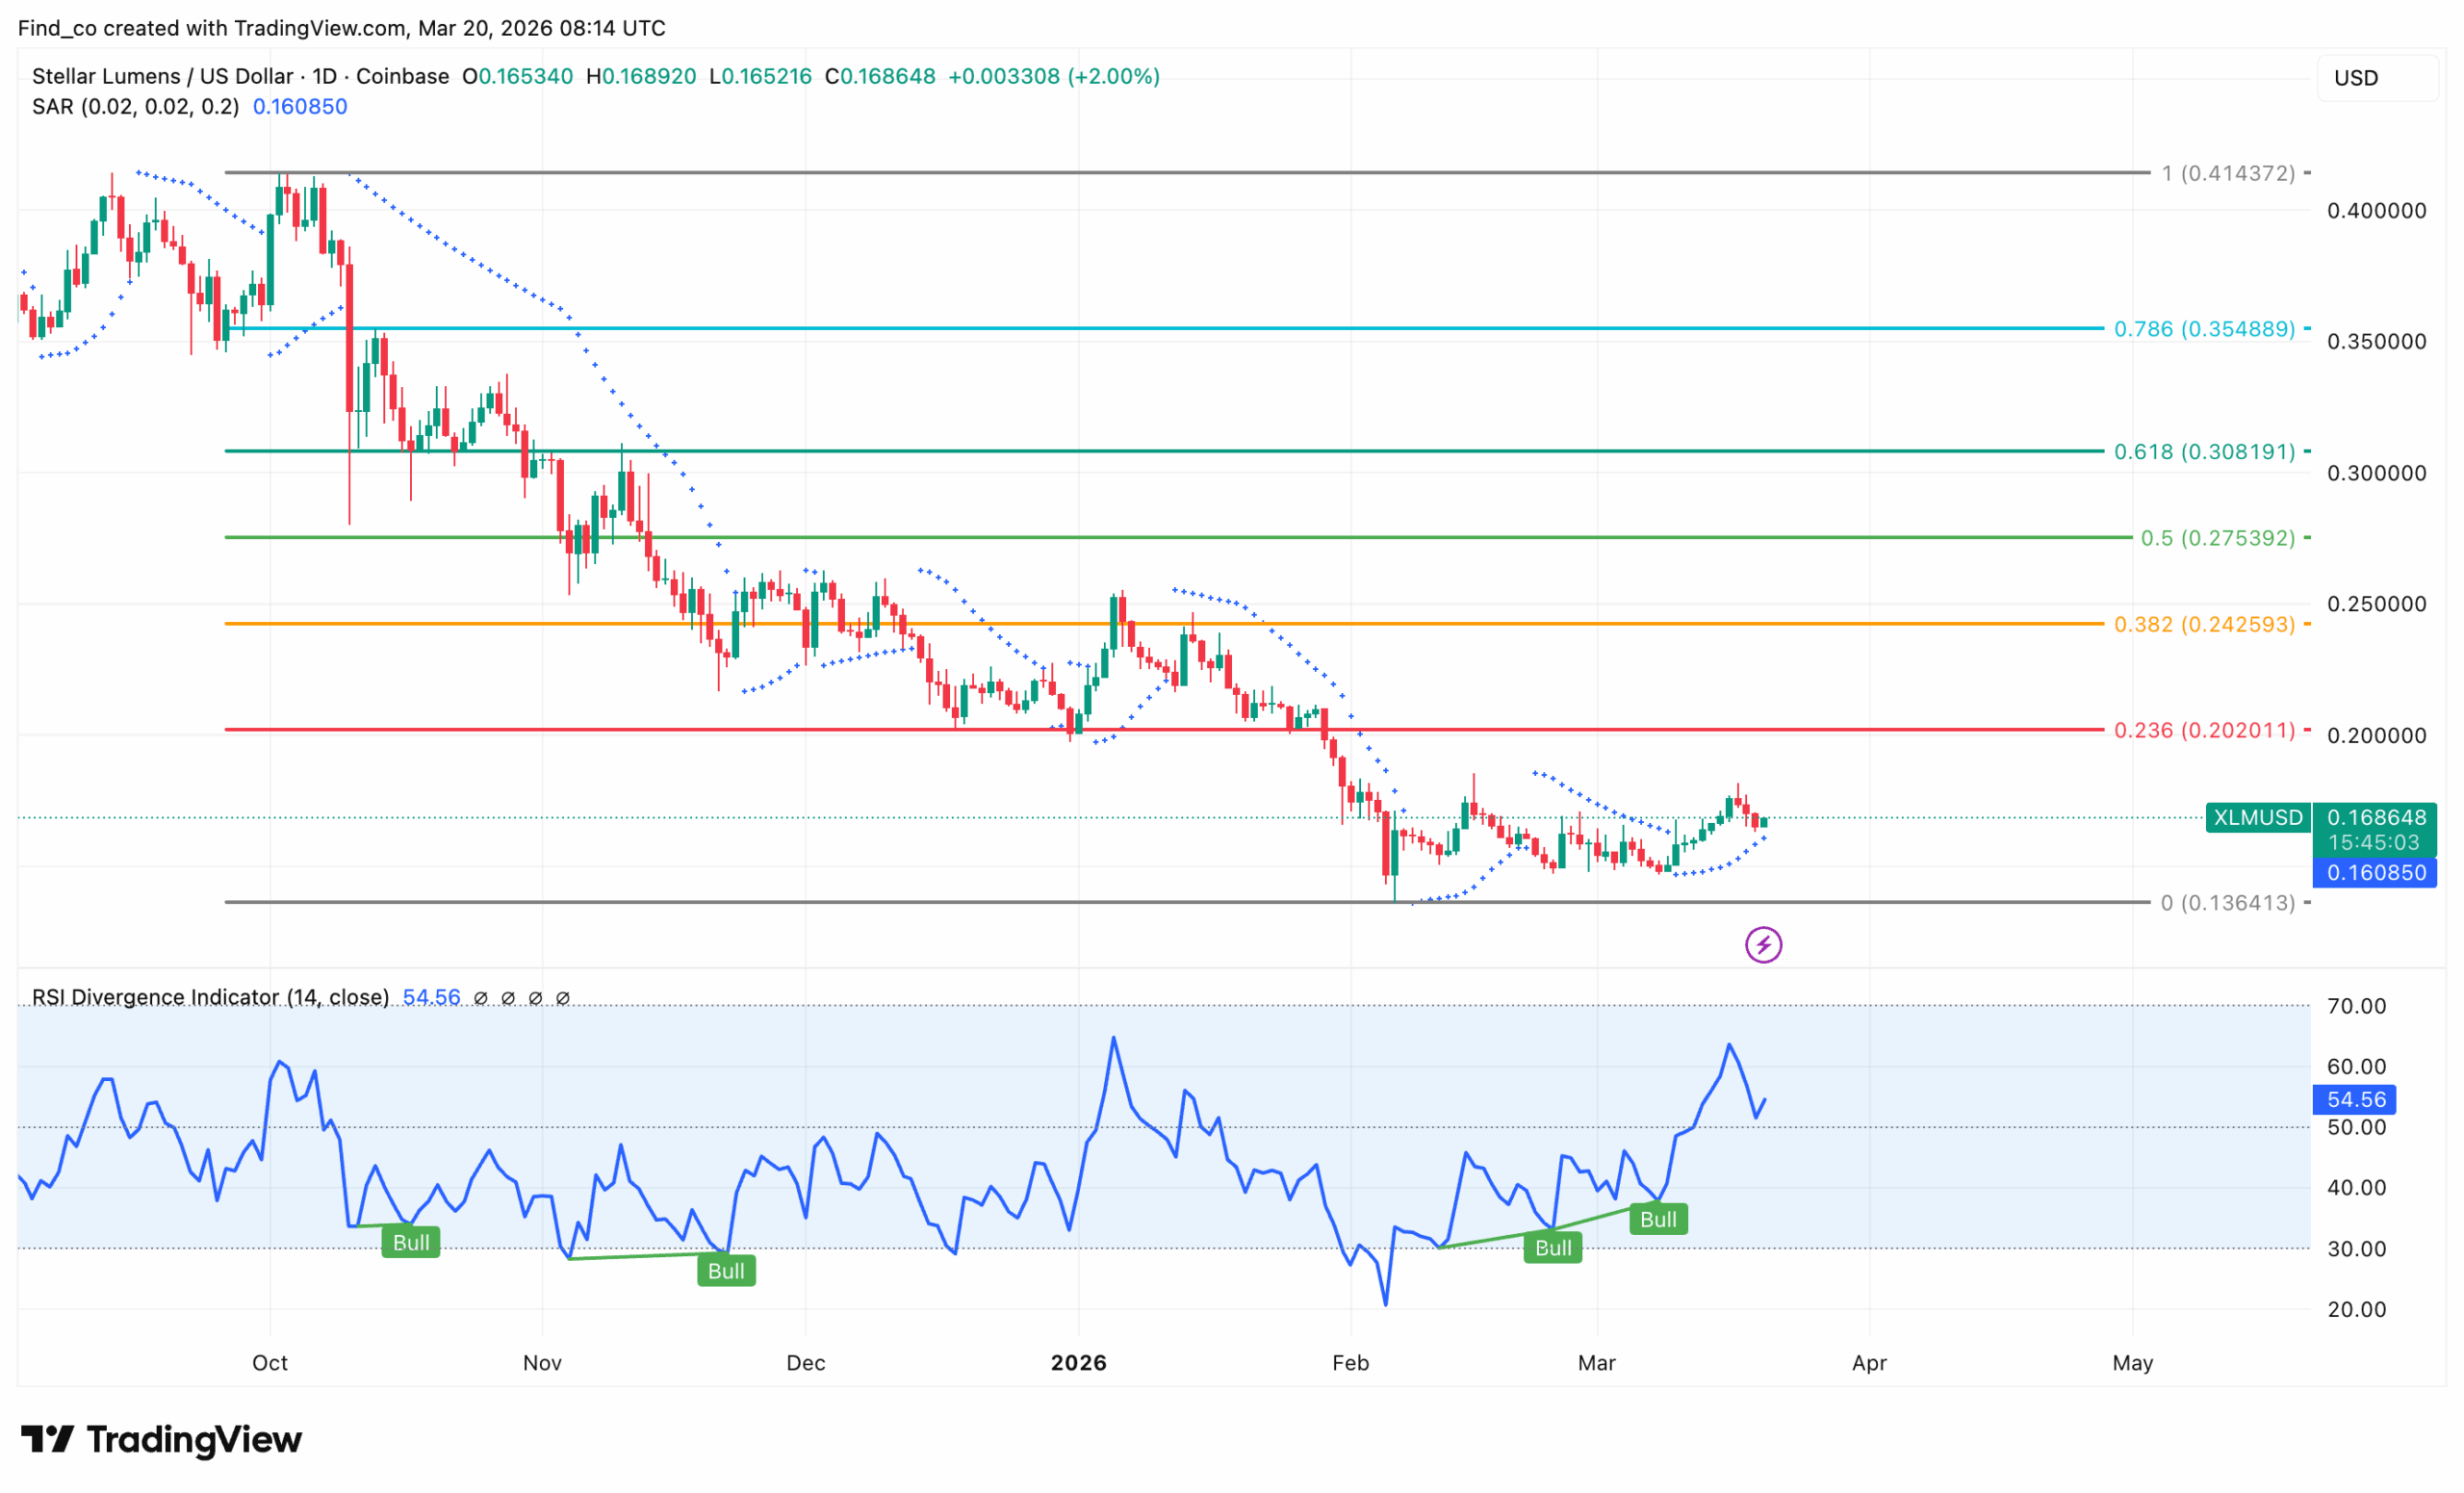
On the daily chart, XLM is showing signs of life, and the bigger picture paints a compelling recovery story.
Before now, the XLM price spent months in a brutal downtrend, sliding from highs near $0.414 to a February low of $0.136.
That bottom, however, may have been the turning point. The RSI Divergence Indicator flagged four successive bullish divergence signals — in October, November, December, and again in early March.
Notably, each one warned that selling pressure was quietly exhausting itself.
Now, momentum is responding. The RSI sits at 54.56, a neutral-to-bullish reading that suggests room to run.
The Fibonacci retracement levels lay out a clear roadmap ahead. The immediate target is the 0.236 level at $0.20 — a level XLM’s price must reclaim to validate the recovery.
Beyond that, the 0.382 level at $0.24 and the 0.5 level at $0.28 represent progressively stronger resistance checkpoints.
Disclaimer:
The information provided in this article is for informational purposes only. It is not intended to be, nor should it be construed as, financial advice. We do not make any warranties regarding the completeness, reliability, or accuracy of this information. All investments involve risk, and past performance does not guarantee future results. We recommend consulting a financial advisor before making any investment decisions.
Victor Olanrewaju is a crypto analyst and reporter at CCN with deep roots in on-chain research and technical analysis. His crypto journey began in 2017, but it was the 2020 Uniswap airdrop that sparked a full-time pivot into the space.
With a foundation in copywriting, Victor honed his craft creating high-converting content for leading crypto brokers — most notably an XRP price prediction that ranked #1 on Google during the 2021 bull run.
He later joined AMBCrypto in 2022, where he combined storytelling with technical and on-chain analysis to cover key market narratives.
In 2024, he expanded his expertise at BeInCrypto, collaborating with analysts and using tools like Glassnode, Santiment, and IntoTheBlock to break down Bitcoin and altcoin trends.
At CCN, Victor covers the top cryptocurrencies, memecoins, macro shifts, blending real-time insights with deep-dive metrics.
He holds a Bachelor’s degree in Physics from the University of Ibadan, equipping him to simplify complex data for a wide audience. Follow his work or connect on LinkedIn or X.