HODLers, Meet Homeowners: Fannie Mae to Accept Crypto as Mortgage Collateral for the First Time
Share
Key Takeaways
The Federal Reserve maintained interest rates at 3.5%–3.75% as Bitcoin’s price dropped.
Despite the price pullback to $69,810, current BTC holders are refusing to panic-sell.
The daily CMF must remain positive to prevent a deeper retracement toward the $65,766 support.
The Federal Reserve has spoken. Rates stay unchanged at 3.5% to 3.75%.
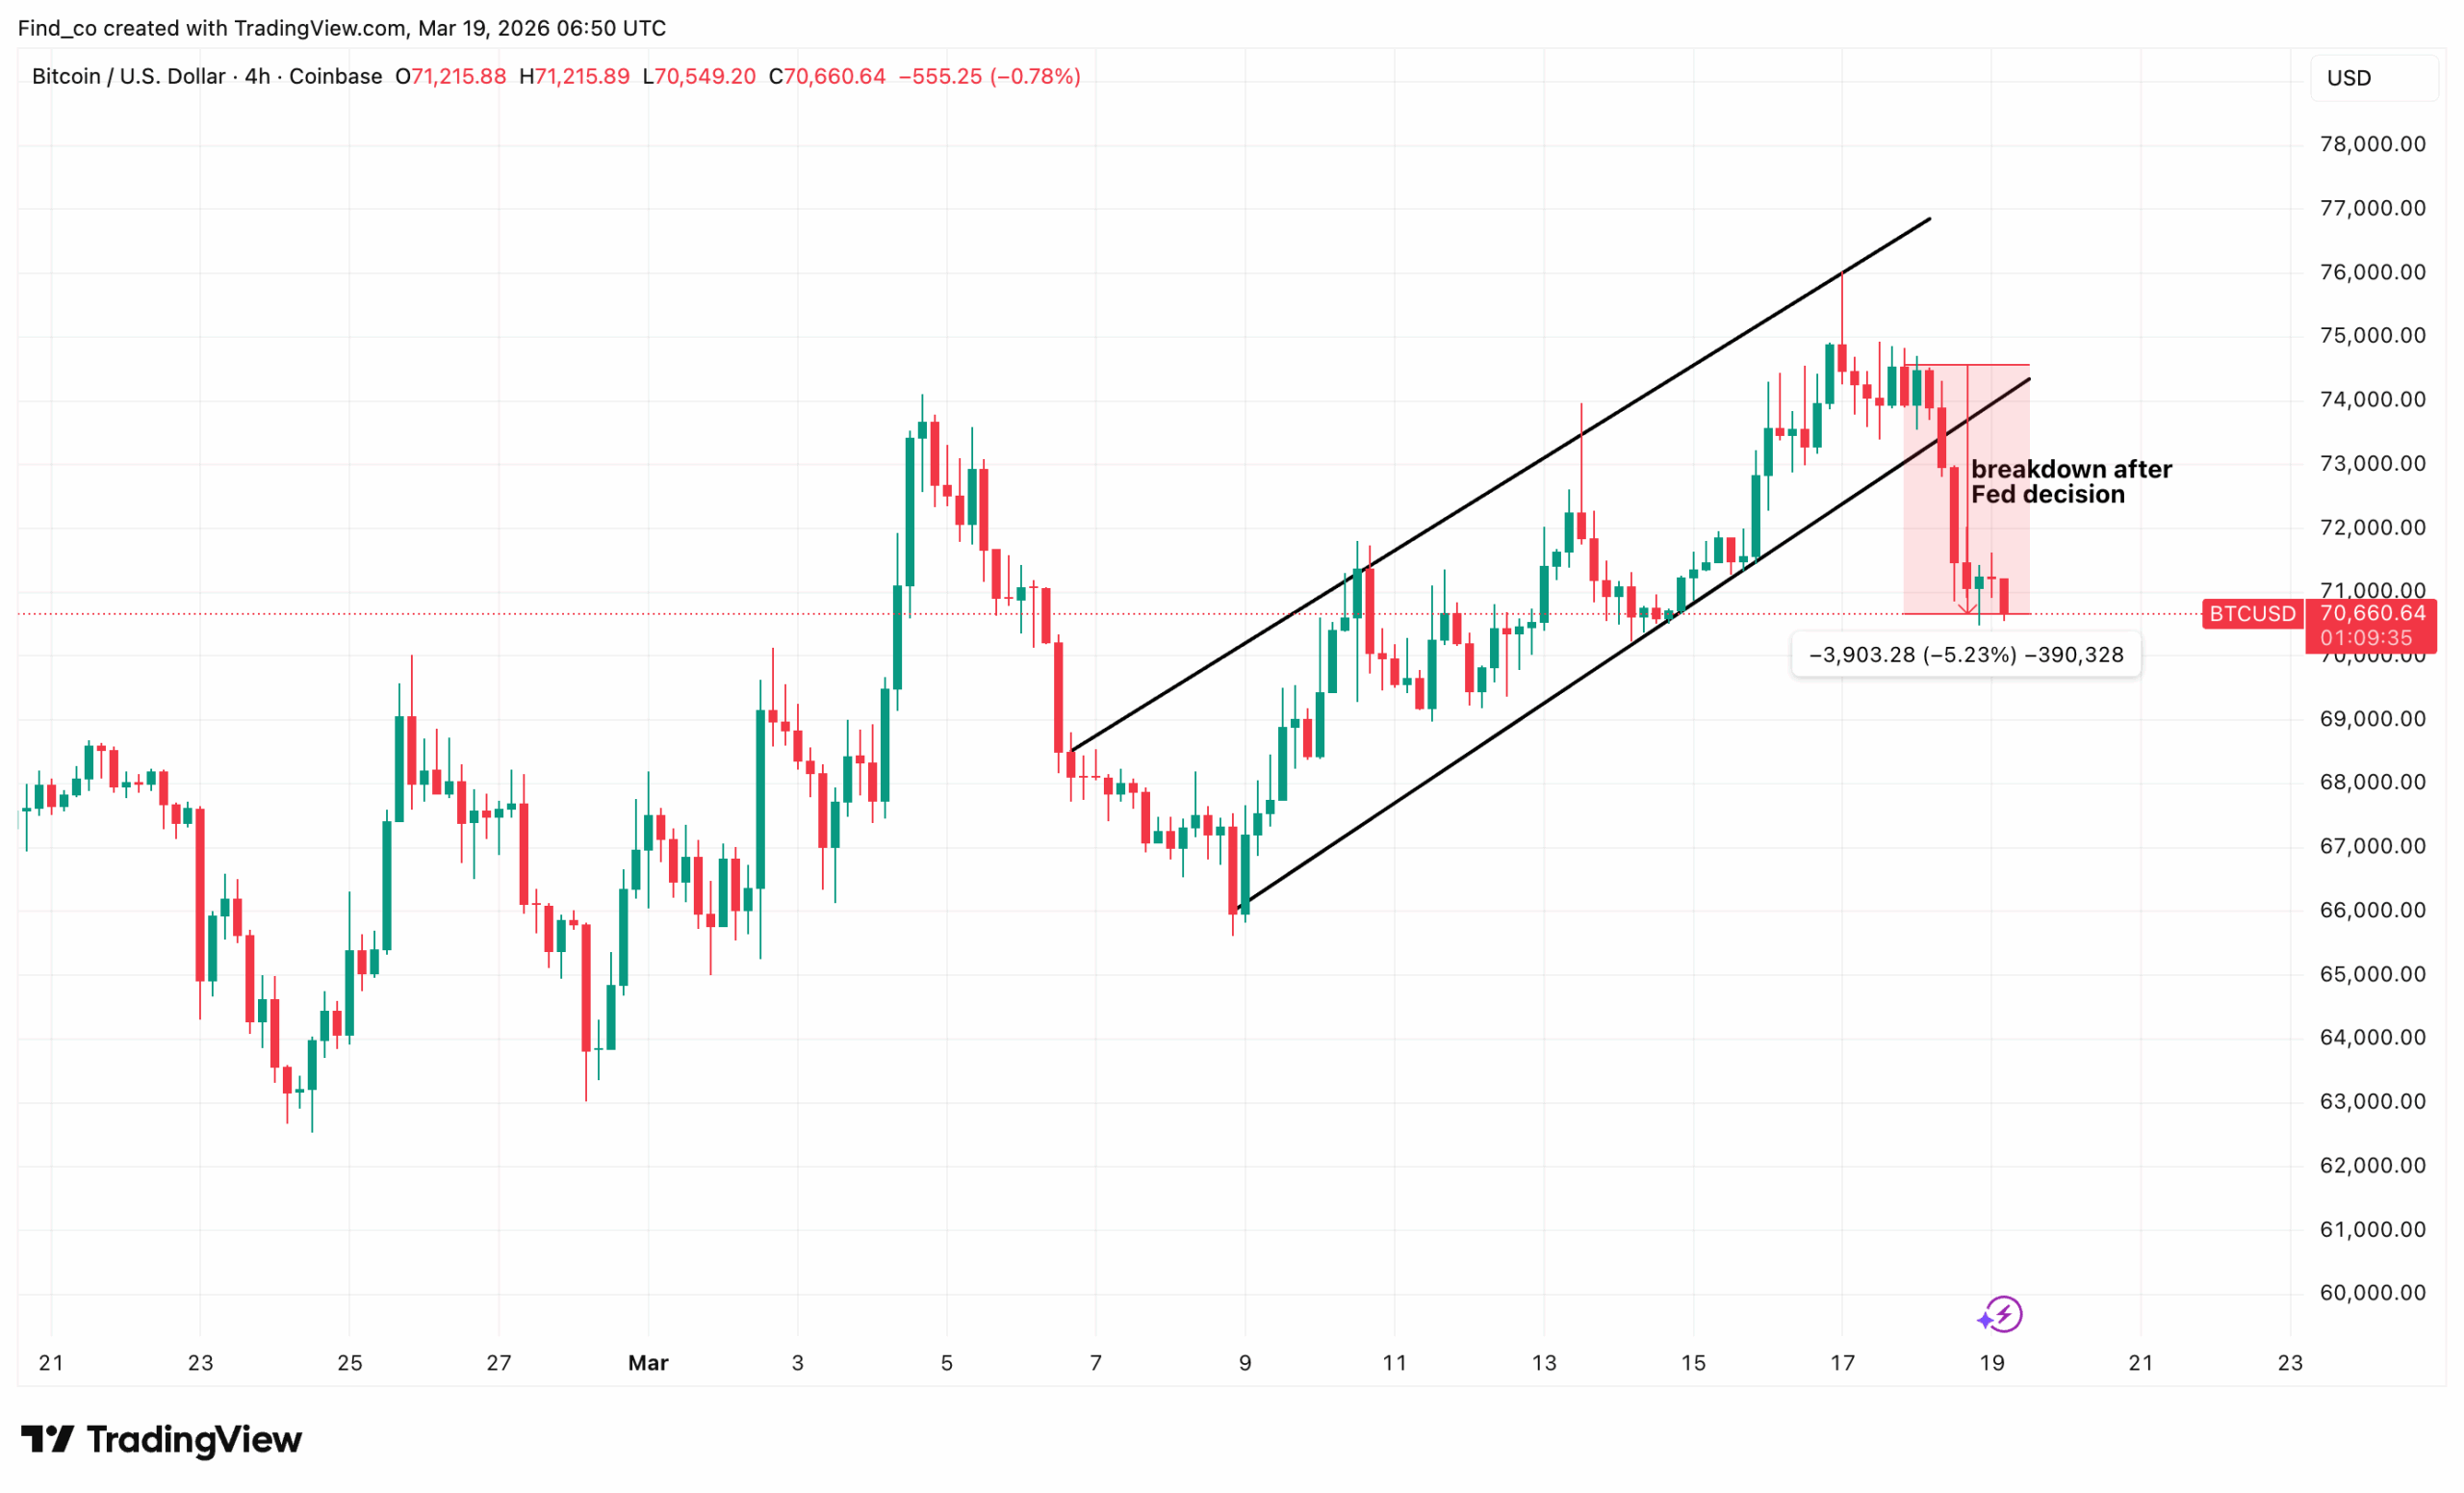
Therefore, Bitcoin’s (BTC) $80,000 target, which had been building momentum as a near-term possibility following BTC’s reclaim of $74,000, has just encountered its most formidable macro obstacle yet.
This decision was not a surprise in isolation. However, the context surrounding it is what makes it consequential for crypto markets specifically.
The Fed is not holding rates because inflation is defeated. It is holding rates due to the war-driven energy crisis.
As a result, it does not seem that Bitcoin’s price will sustain its recent momentum.
What the Fed’s Decision Actually Means for BTC
The Federal Reserve’s decision to leave its benchmark rate at 3.5% to 3.75% reflects a central bank navigating genuine uncertainty.
The Fed’s own statement acknowledged that US economic uncertainty remains elevated and that the impact of the ongoing Middle East conflict remains unclear.
“Uncertainty about the economic outlook remains elevated. The implications of developments in the Middle East for the U.S. economy are uncertain. The Committee is attentive to the risks to both sides of its dual mandate. In support of its goals, the Committee decided to maintain the target range for the federal funds rate at 3‑1/2 to 3‑3/4 percent,” The Fed official statement read.
That admission is critical. It tells the market that the Fed is not in a position to commit to rate cuts even if it wanted to.
Beyond that, crude oil trading above $108 per barrel also seems to have impacted the decision.
Before the disclosure, BTC tested $74,825. However, as of this writing, the market value has fallen below the psychological $70,000 mark.
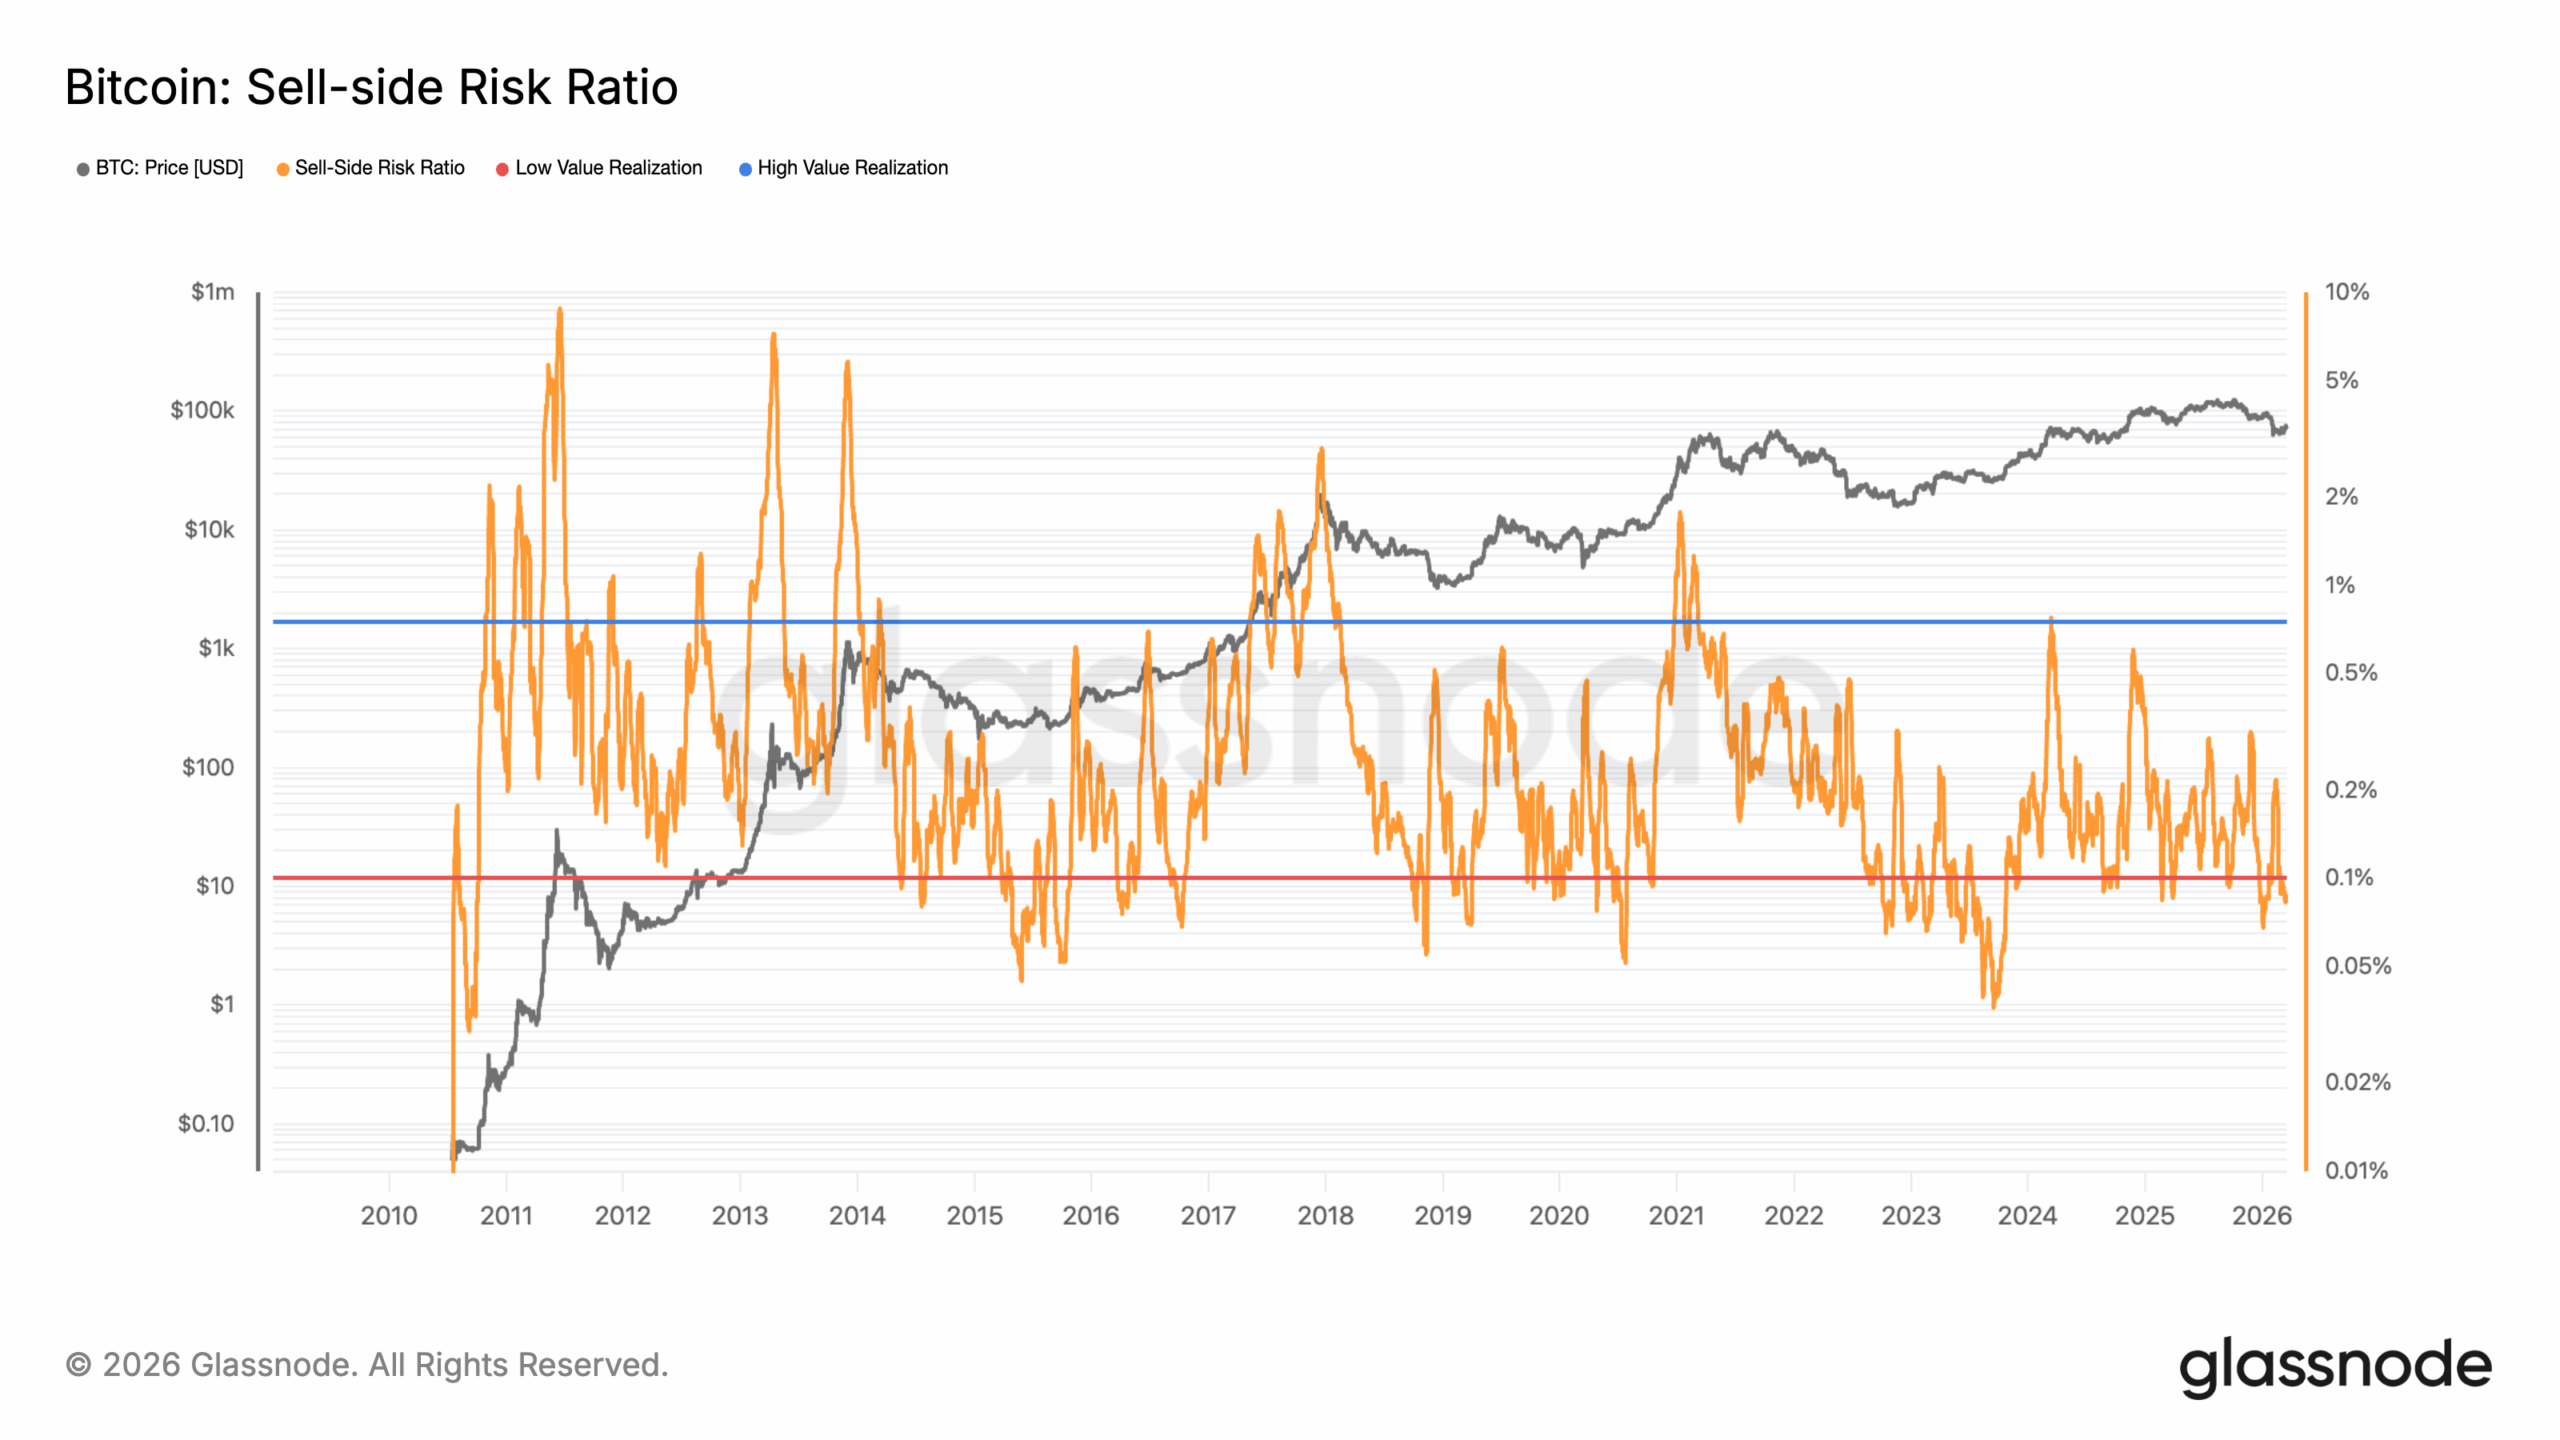
Looking at on-chain data, Glassnode shows that 15 years of Bitcoin price action point to the same conclusion — this is not the time to panic.
The Sell-Side Risk Ratio measures the total realised profit and loss of coins being moved on-chain relative to the overall size of the Bitcoin network.
Simply put, it answers the question: how aggressively are holders realising gains or losses right now?
The orange line is the ratio. The red horizontal is the Low Value Realization threshold. The blue horizontal is the High Value Realization threshold.
Right now, the ratio has dropped to the red line (approximately 0.1%).
That level has a consistent historical record stretching back to 2011.
Every time the ratio has touched or approached the red floor (2012, 2015, 2019, late 2022, briefly in 2024), it has marked either a major bottom or a significant accumulation zone before the next leg higher.
The interpretation is straightforward. When the ratio is this low, it means holders are neither taking significant profits nor panic-selling at large losses.
Furthermore, the current reading is arriving alongside every other accumulation signal identified this week: institutional Coinbase premium turning positive, BTC exchange outflows at -65K per period, STH supply at 0% profit, and the symmetrical triangle breakout on the daily chart.
Historically, the next phase after red-line readings has been a recovery toward the blue high-value threshold.
Despite this outlook, analyst Benjamin Cowen said Bitcoin’s price might not experience an explosive surge in the near future.
“Right now, the market is not pricing in a rate cut until 2027,” Cowen highlighted.
BTC Price Analysis: Consolidation to Linger
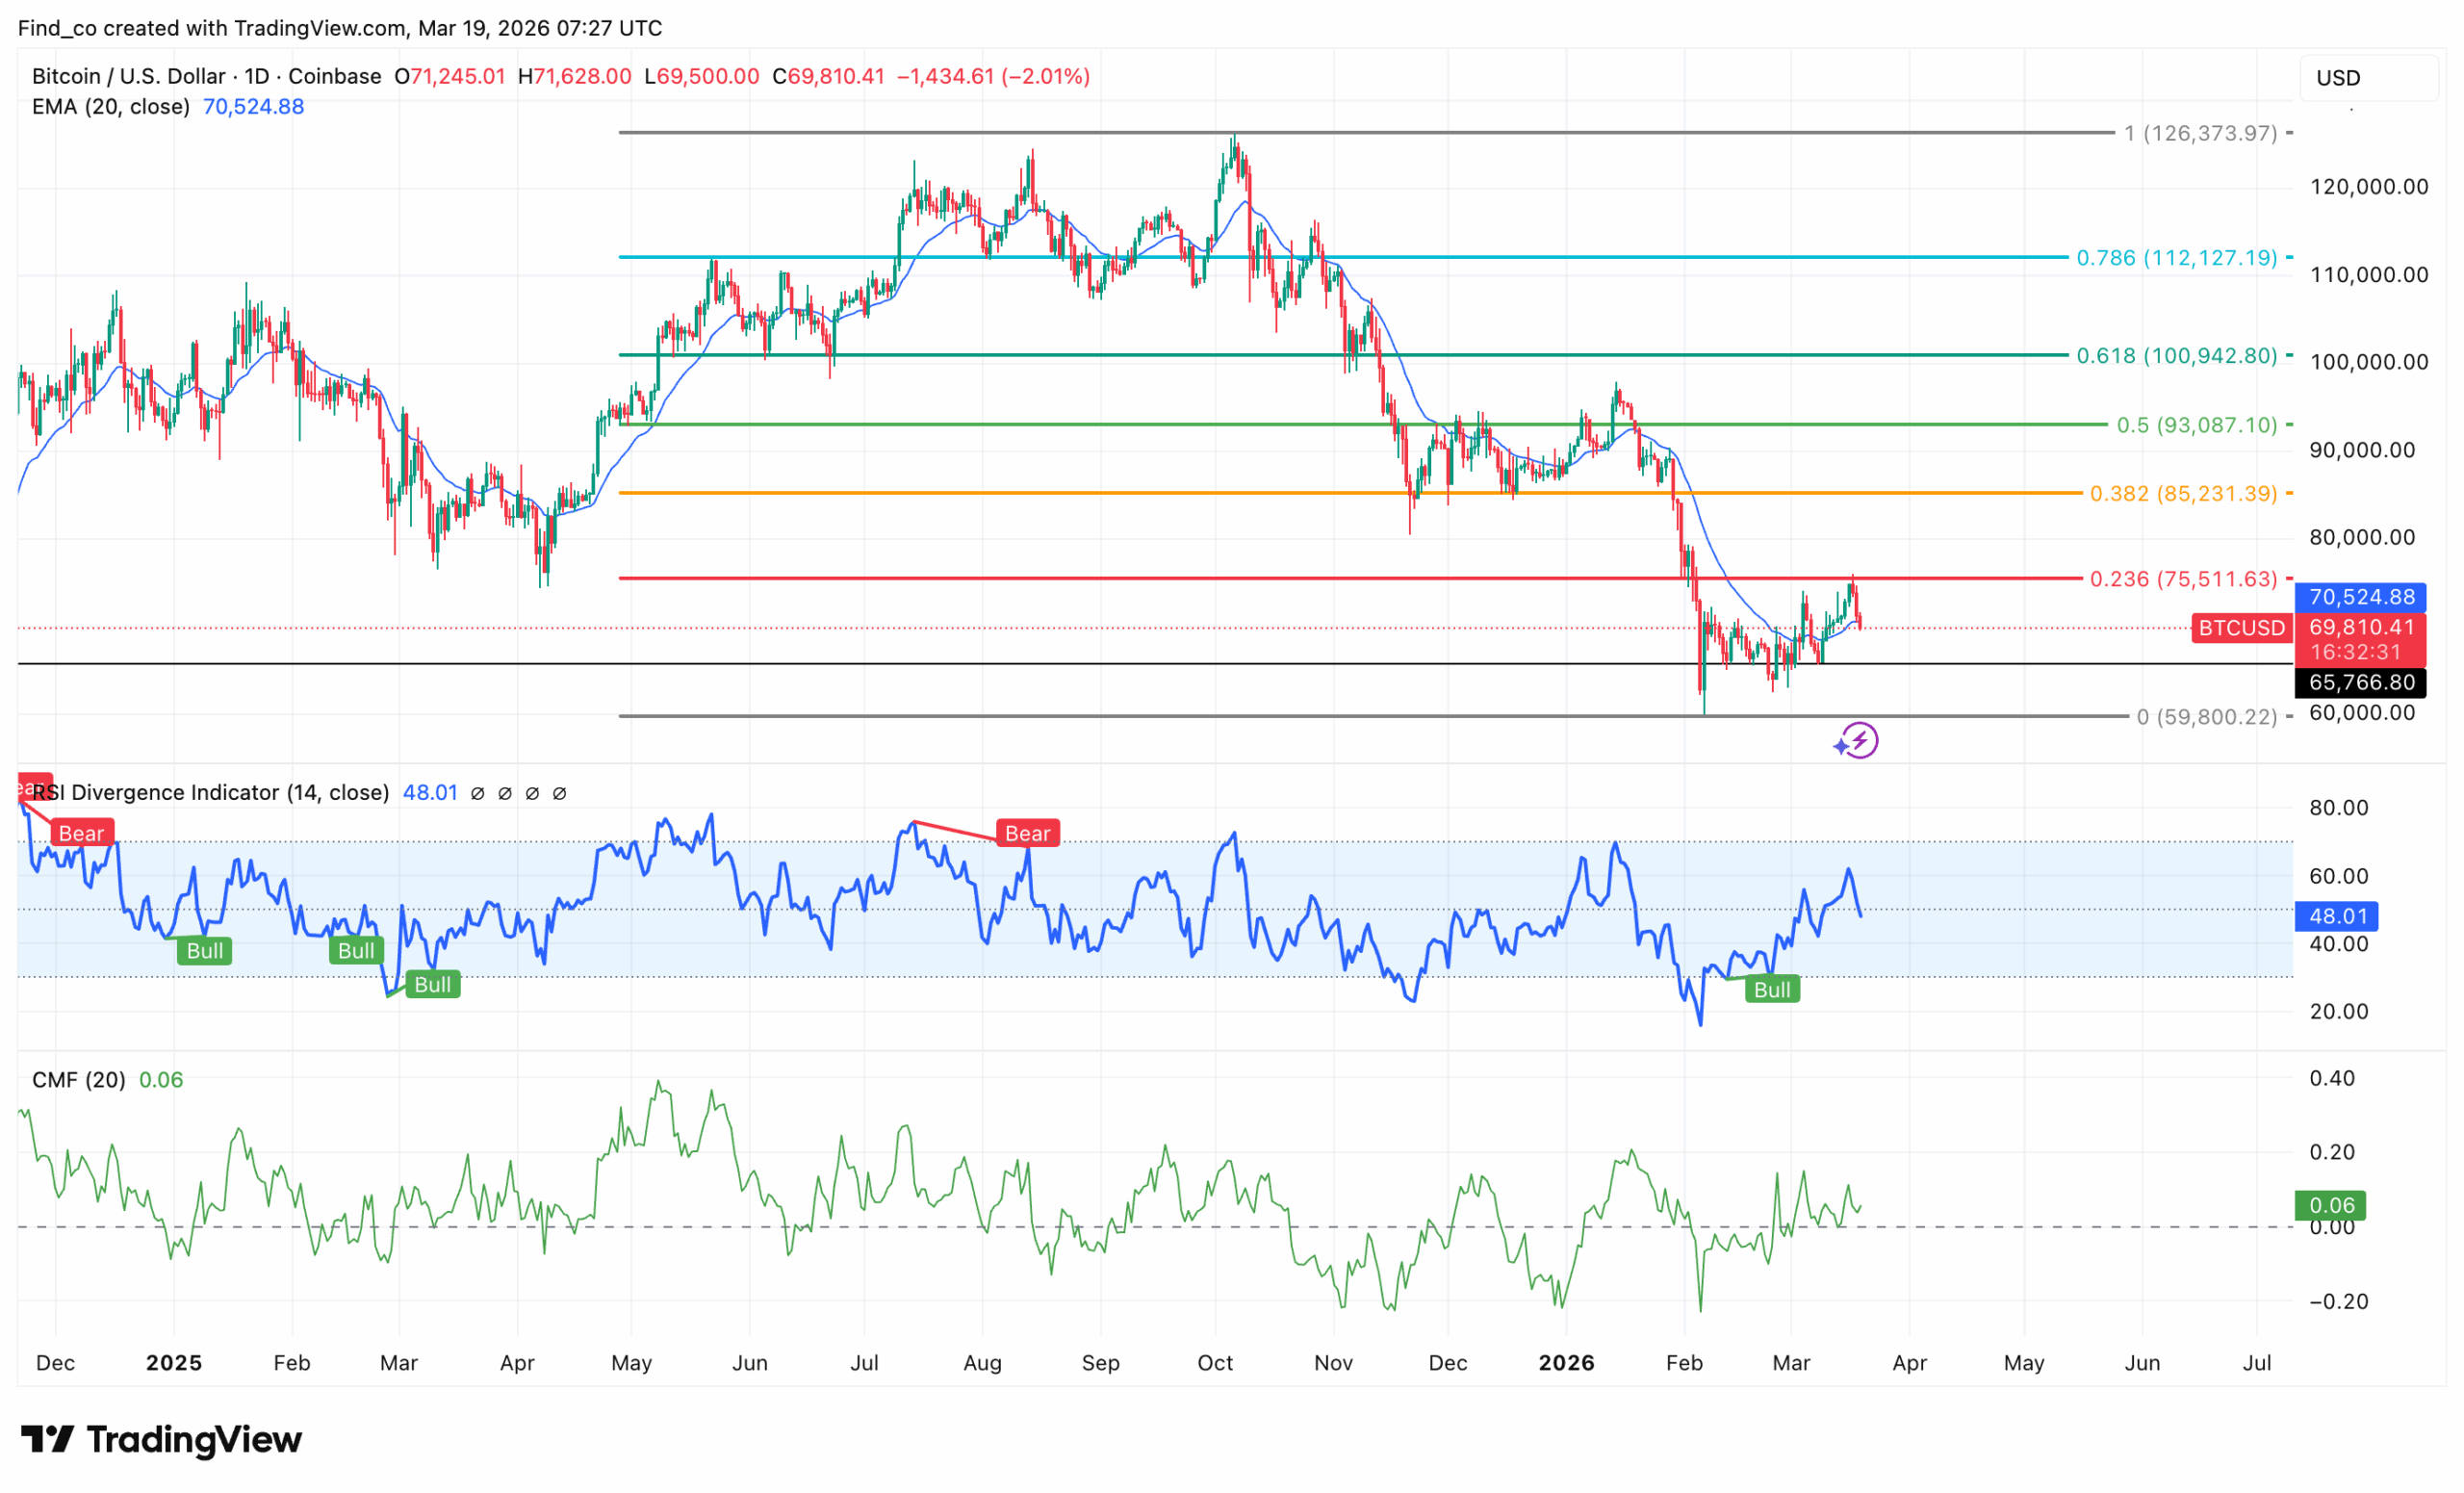
From a technical perspective, the daily chart shows that Bitcoin’s price is pulling back.
BTC trades at $69,810, below the 20-EMA at $70,524 after two days of selling pressure from the $75,000 resistance zone.
The RSI Divergence Indicator is the backbone of this chart, and its history demands critical assessment.
Two Bear divergence signals: one in January 2025 near the $109,000 peak and one in August 2025 near $88,000.
Interestingly, both called significant tops with accuracy. Conversely, three Bull divergence signals occurred in February 2025, March 2025, and, most recently, the February 2026 low — all preceded meaningful recoveries.
Meanwhile, the Chaikin Money Flow (CMF) at 0.06 remains positive. It’s marginal, but it has held above zero throughout the recovery from the lows, indicating that money continues to flow in on a net basis.
Notably, the CMF was deeply negative through November and January as Bitcoin’s price declined.
Consequently, today’s move is best read as a rejection of resistance, not a trend reversal.
The Bull divergence signal is still live. The CMF is still positive. The 20-EMA at $70,524 — barely above the current price — is the immediate retest.
Disclaimer:
The information provided in this article is for informational purposes only. It is not intended to be, nor should it be construed as, financial advice. We do not make any warranties regarding the completeness, reliability, or accuracy of this information. All investments involve risk, and past performance does not guarantee future results. We recommend consulting a financial advisor before making any investment decisions.
Victor Olanrewaju is a crypto analyst and reporter at CCN with deep roots in on-chain research and technical analysis. His crypto journey began in 2017, but it was the 2020 Uniswap airdrop that sparked a full-time pivot into the space.
With a foundation in copywriting, Victor honed his craft creating high-converting content for leading crypto brokers — most notably an XRP price prediction that ranked #1 on Google during the 2021 bull run.
He later joined AMBCrypto in 2022, where he combined storytelling with technical and on-chain analysis to cover key market narratives.
In 2024, he expanded his expertise at BeInCrypto, collaborating with analysts and using tools like Glassnode, Santiment, and IntoTheBlock to break down Bitcoin and altcoin trends.
At CCN, Victor covers the top cryptocurrencies, memecoins, macro shifts, blending real-time insights with deep-dive metrics.
He holds a Bachelor’s degree in Physics from the University of Ibadan, equipping him to simplify complex data for a wide audience. Follow his work or connect on LinkedIn or X.