Stellar (XLM) is one of the oldest cryptocurrencies.
The Stellar blockchain was a hard fork from Ripple.
XLM increased by over 200% in November 2024.
For most of 2024, XLM hovered around $0.10. However, the market increased in November due to Donald Trump’s re-election as U.S. President, and Stellar’s coin went up with it.
Although Stellar dropped after that, the downward movement has been much more gradual than its previous rally.
Let’s investigate our Stellar price prediction, made on Nov. 5, 2025. We will also examine Stellar’s price history and discuss what it is and does.
Let’s examine CCN’s XLM price predictions using the wave count method.
Minimum XLMPrice Prediction
Average XLM Price Prediction
Maximum XLM Price Prediction
2025
$0.144
$0.270
$0.315
2026
$0.128
$0.140
$0.192
2030
$0.430
$0.550
$0.670
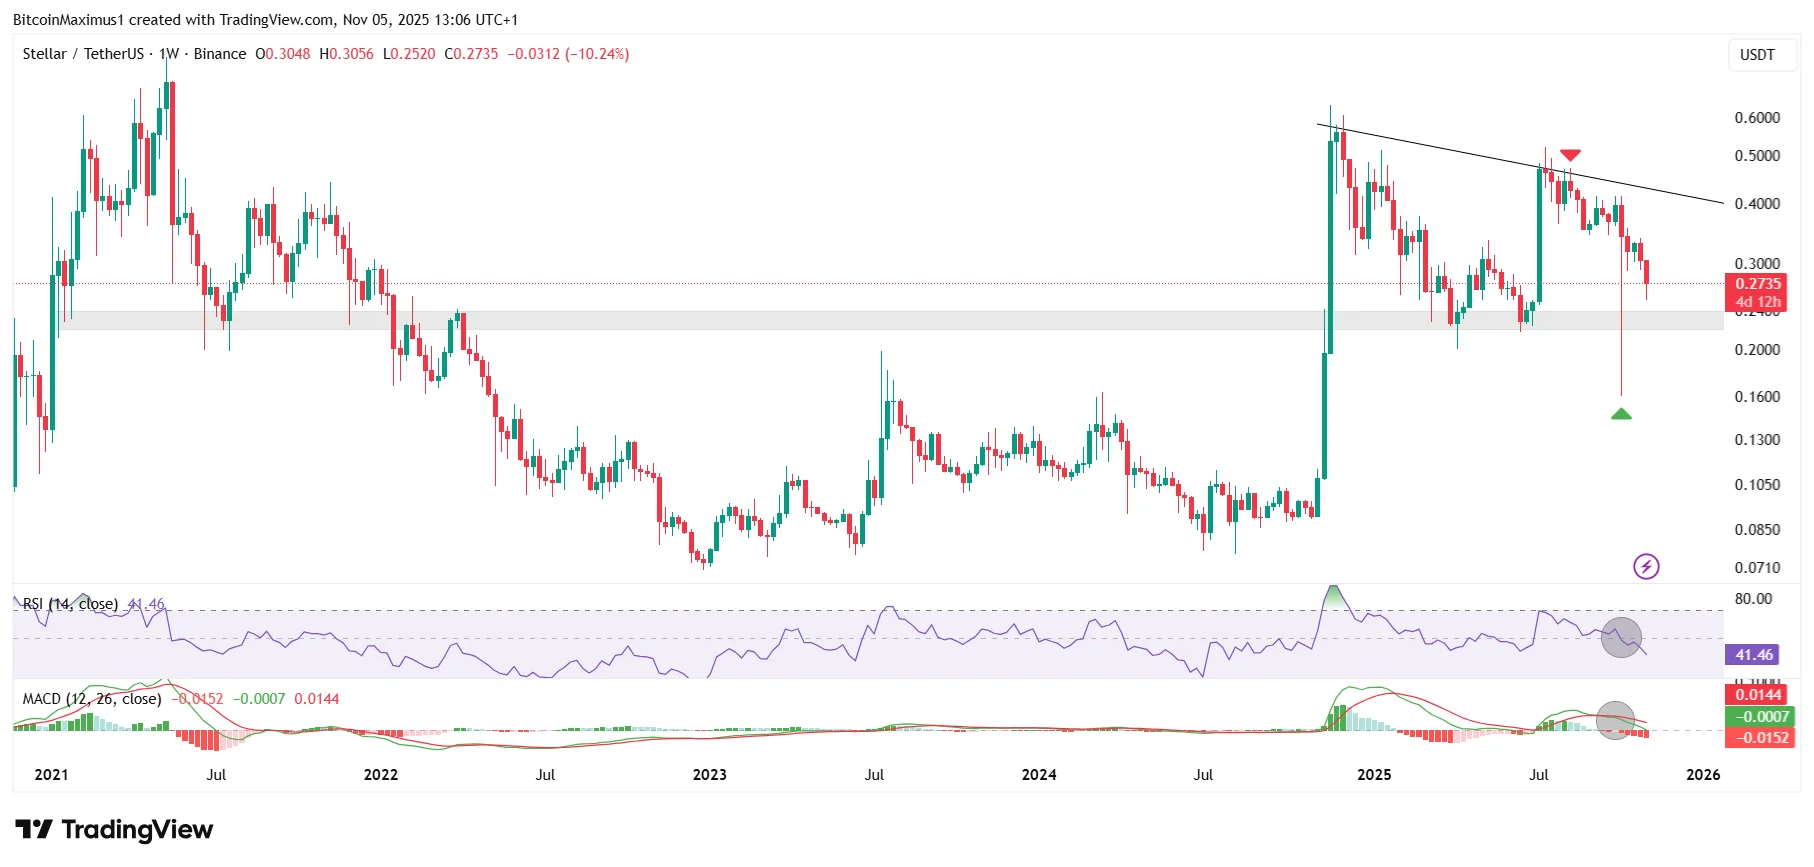
The most likely wave count shows that XLM completed a five-wave upward movement between 2015 and 2018 (green).
Since then, it has corrected inside a symmetrical triangle, likely finishing an A-B-C-D-E structure (red).
Try Our Recommended Crypto Exchanges
Sponsored
Disclosure
We sometimes use affiliate links in our content, when clicking on those we might receive a commission at no extra cost to you. By using this website you agree to our terms and conditions and privacy policy.
If the count is accurate, XLM has completed wave D in this correction. So, another downward movement exists before the XLM price reaches its bottom.
According to the count, the XLM price will continue correcting inside wave E and reach lows of $0.270 and $0.140 at the end of 2025 and 2026, respectively.
Momentum indicators are extremely bearish, supporting the hypothesis that new lows are likely to be in store. The Relative Strength Index (RSI) is below 50, while the Moving Average Convergence/Divergence (MACD) is negative.
The MACD also made a bearish cross, putting the final confirmation that the XLM price prediction is bearish.
Short-term Stellar Price Prediction
The XLM price prediction for the next 24 hours is bearish. Stellar will likely continue falling inside the descending parallel channel.
Stellar Average True Range (ATR): XLM Volatility
The Average True Range (ATR) measures market volatility by averaging the largest of three values:
The current high minus the current low;
The absolute value of the current high minus the previous close;
The absolute value of the current low minus the previous close over a period, typically 14 days.
A rising ATR indicates increasing volatility, while a falling ATR indicates decreasing volatility.
Since ATR values can be higher for higher-priced assets, normalize ATR by dividing it by the asset price to compare volatility across different price levels.
On Nov. 5, 2025, Stellar’s ATR was 0.066, suggesting comparatively high volatility.
Stellar Relative Strength Index (RSI): Is XLM Overbought or Oversold?
The Relative Strength Index (RSI) is a momentum indicator that traders use to determine whether an asset is overbought or oversold.
Movements above 70 and below 30 show over- and undervaluation, respectively. Movements above and below the 50 line also indicate if the trend is bullish or bearish.
On Nov. 5, 2025, the Stellar RSI was 41, indicating bearish conditions.
CCN Strength Index
The CCN Strength Index combines an array of advanced market signals to quantify the strength of individual cryptocurrencies over a recent 30-day period.
Every day, it assigns a strength score, ranging from 0 to 100, to the top 500 assets by market capitalization on CoinMarketCap, focusing on both trend direction and the intensity of price movements.
0 to 24: Assets exhibit significant weakness, showing signs of sustained downtrend behavior.
25 to 35: The price tends to move within stable bounds with minimal volatility.
36 to 49: Assets begin a stable uptrend but without strong surges.
50 to 59: Consistent growth with moderate price advances, building momentum.
60+: Sharp price movements and high demand indicate more volatility and trend shifts.
The index dynamically adapts to rapid changes. For example, an asset experiencing a 100% increase within a short timeframe would see a sharp jump in its score to reflect the intensity of the rise.
However, should that asset stabilize at this new price level, the score will gradually taper down and align with the dampened momentum as the movement normalizes.
On Nov. 5, 2025, Stellar scored 45.2 on the CCN Index, suggesting moderate momentum.
We looked at the Stellar price history and found the best times to buy XLM.
Day
Thursday
Week
19
Month
May
Quarter
Fourth
Advantages and Disadvantages of Stellar
CCN’s Senior Research Analyst, Toghrul Aliyev, looked at Stellar and found the following advantages and disadvantages.
Advantages of Stellar
Low Transaction Costs: Stellar’s average transaction cost is about 4,000-5,000 stroops, or 0.0004-0.0005 XLM, which is a fraction of a cent. To put it in perspective, it takes more than 20,000 transactions to spend just $1.
Credit: IntoTheBlock
Fast Transaction Speed: Stellar’s transactions are fast, averaging 5.19 seconds per transaction.
Efficient Cross-Border and Cross-Exchange Transactions: Stellar excels in international payments and transfers between exchanges due to its fast transaction speed, low costs, and relatively stable price throughout the day. Users can move funds quickly and inexpensively, minimizing the risk of losing value during transactions.
Real-world Asset Tokenization: Stellar’s network has more than $400 billion in commodities and tokenized U.S. treasuries, making it the second largest after Ethereum.
Safety Advantage: Stellar prioritizes safety to ensure transaction integrity. Stellar reduces the likelihood of conflicting transactions and double-spending attacks by requiring consensus from trusted nodes.
Disadvantages of Stellar
Competition: Stellar faces competition from other blockchain networks and payment systems, such as Ripple, which could affect its market position.
Extensive Holdings by SDF: As of June 2024, the Stellar Development Foundation (SDF) holds 20,592,611,381 XLM, which accounts for 70% of the circulating supply and 41% of the total supply. The significant concentration of ownership poses a risk, as any large-scale movement or sale of these tokens by SDF could influence the market price and create volatility.
Low Developer Activity: Stellar has relatively low developer activity, with only 500 weekly commits, ranking 42nd overall. It ranks 68th in sub-ecosystems with 12 sub-ecosystems, 46th in repositories with about 2000 repos, and 41st in weekly active developers with 92 developers. This low level of developer engagement can impact the network’s growth and innovation.
Centralization: The structure of quorum slices in Stellar creates centralization. Each node selects a set of trusted nodes, forming its quorum slice to agree on transactions. Many nodes often choose the same few trusted entities, such as those controlled by the Stellar Development Foundation. The concentration of trust can lead to network centralization and vulnerability, where the failure or compromise of these key nodes could halt the entire network.
Reliance on Trusted Nodes: Stellar’s increased safety relies heavily on the assumption that trusted nodes will not fail or act maliciously. While the network is safer from specific attacks, it remains vulnerable to centralization issues if these assumptions do not hold.
Liveness: Prioritizing safety over liveness can halt the network if specific nodes fail or are compromised. This trade-off can, therefore, cause significant downtimes.
Limited Validator Participation: The network only has 60 complete validators. Not all asset issuers and exchanges run public validators, leading to potential discrepancies in consensus.
Stellar Price History
Let’s look at some key dates in the Stellar price history. While past performance does not indicate future results, knowing what the coin has done can help give context when making or interpreting a Stellar price prediction.
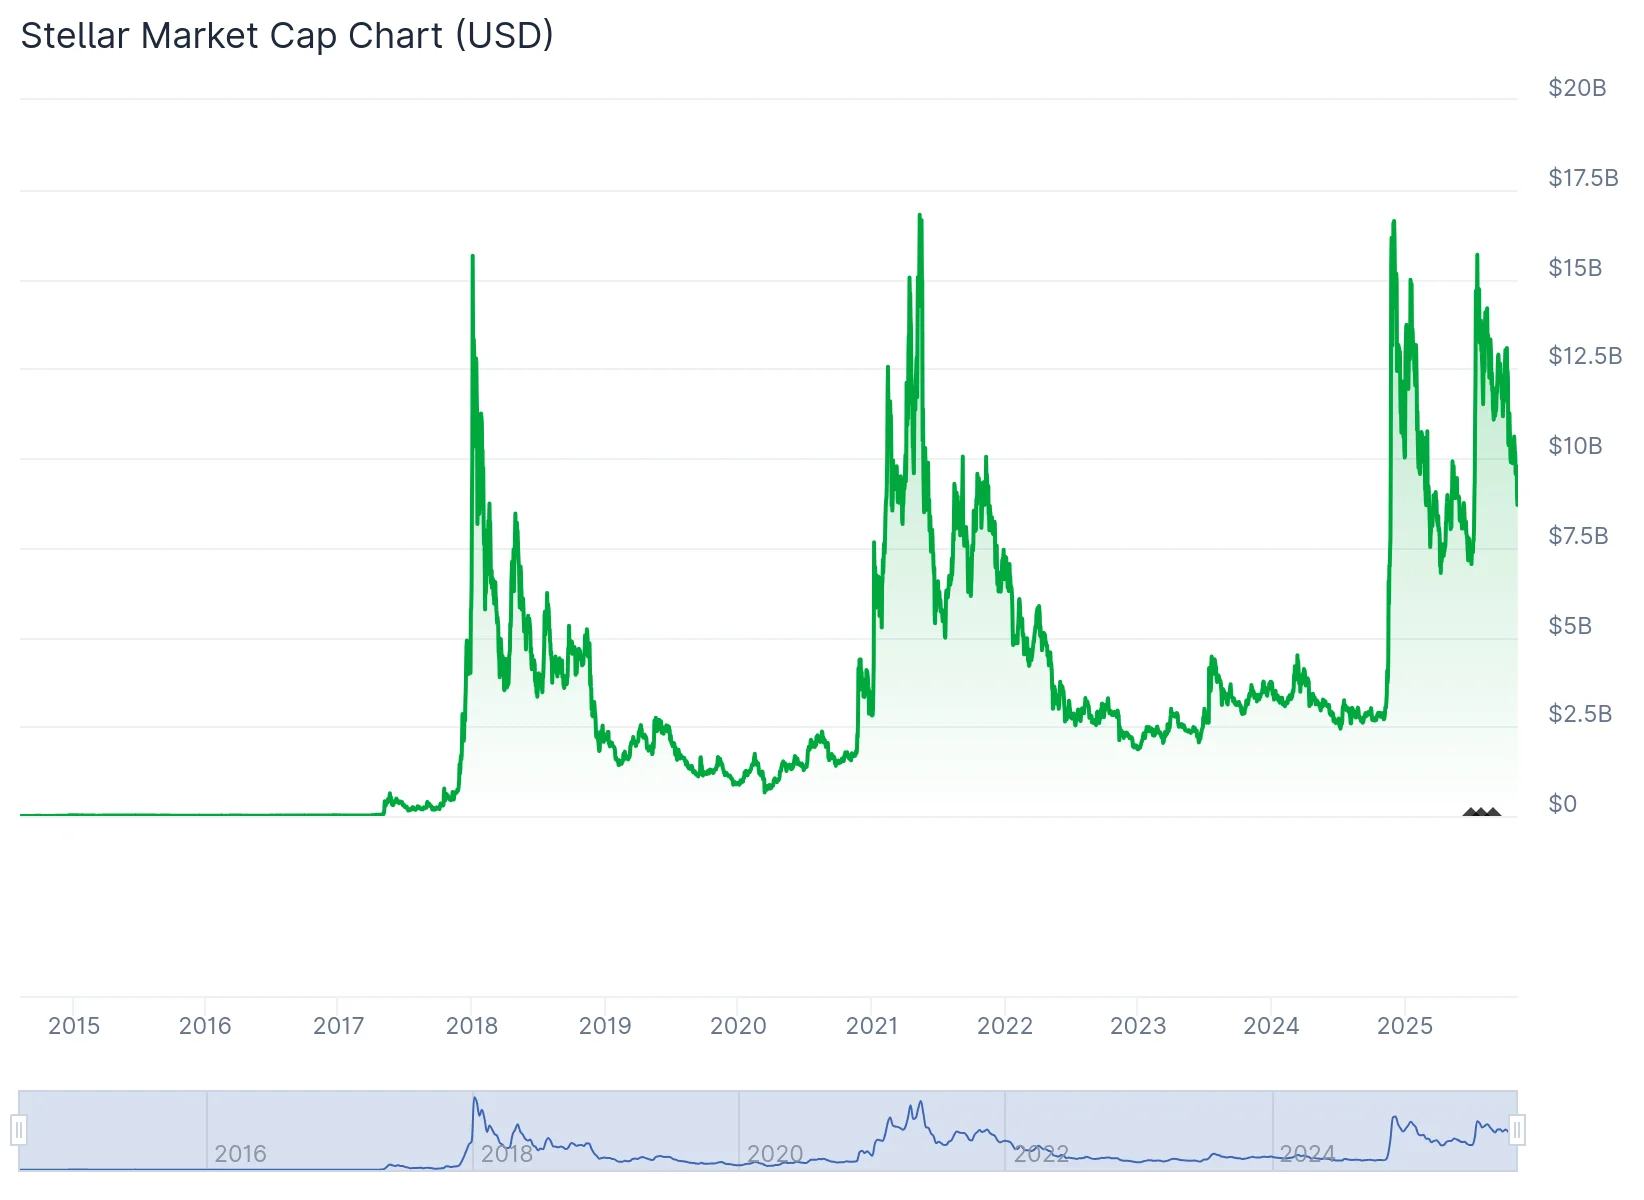
On Nov. 5, 2025, Stellar’s market cap was $8.82 billion, making it the 18th-largest crypto by that metric.
Stellar Supply and Distribution Fact Box
Supply and distribution
Figures
Maximum Supply
50,001,806,812
Circulating supply as of Nov. 5, 2025
32,079,610,151 (62.82% of the maximum supply)
From the Stellar Whitepaper
In its technical documentation or whitepaper, Stellar says it aims to fix the problem of closed financial systems.
It says: “We need a worldwide financial network open to anyone so that new organizations can join and extend financial access to unserved communities. The challenge for such a network is ensuring participants record transactions correctly.”
“With a low barrier to entry, users won’t trust providers to police themselves, and with worldwide reach, providers won’t all trust a single entity to operate the network.”
“A compelling alternative is a decentralized system in which participants together ensure integrity by agreeing on the validity of one another’s transactions. Such agreement hinges on a mechanism for worldwide consensus.”
What Is Stellar?
The Stellar blockchain makes cheap and quick transactions. Crypto entrepreneur Jed McCaleb, better known for his involvement in Ripple’s XRP cryptocurrency, and lawyer Joyce Kim founded it.
The system, a Ripple spin-off, allows people to transfer assets, including fiat currency, into crypto.
Stellar is supported by its native token, properly called Stellar Lumens, but often just referred to as either Stellar or by its ticker handle, XLM.
How Stellar Works
Stellar uses a platform called Stellar Core, which utilizes a technology called Horizon 2.0. Stellar has three kinds of network operators or nodes.
Complete validators submit transactions, validate transactions, and publish history. Basic Validators submit and validate transactions, while Archivers can submit transactions and publish history.
XLM allows one to pay for transactions on the network and is also used to reward node operators.
Is Stellar a Good Investment?
Stellar is one of crypto’s medium-sized institutions and has been a fixture of the second tier for a long time.
XLM performed well at the end of 2024 but was previously weak.
That said, Stellar has a strong base of developers and investors, and updates and improvements to the platform occur constantly.
As always with crypto, you should research before deciding whether or not to invest in XLM.
Will Stellar go up or down?
It is difficult to determine. While the Stellar crypto price predictions are optimistic, they have a well-earned reputation for being wrong. Keep in mind that prices can and do go down and up.
Should I invest in Stellar?
Before deciding whether to invest in Stellar, you must research XLM and other similar coins and tokens, such as Ethereum (ETH) or Solana (SOL). Either way, you must also ensure you never invest more money than you can afford to lose.
FAQs
How many Stellar are there?
On Nov. 11, 2025, there were 30.77 billion XLM in circulation out of a total supply of 50 billion.
Will Stellar Reach $1?
It could happen. The XLM price is correcting inside a long-term symmetrical triangle pattern, a breakout from which could take XLM to $1.
What is Stellar used for?
The XLM crypto pays for transactions on the Stellar blockchain. People can also buy, sell, and trade it on exchanges.
Victor Olanrewaju is a crypto analyst and reporter at CCN with deep roots in on-chain research and technical analysis. His crypto journey began in 2017, but it was the 2020 Uniswap airdrop that sparked a full-time pivot into the space.
With a foundation in copywriting, Victor honed his craft creating high-converting content for leading crypto brokers — most notably an XRP price prediction that ranked #1 on Google during the 2021 bull run.
He later joined AMBCrypto in 2022, where he combined storytelling with technical and on-chain analysis to cover key market narratives.
In 2024, he expanded his expertise at BeInCrypto, collaborating with analysts and using tools like Glassnode, Santiment, and IntoTheBlock to break down Bitcoin and altcoin trends.
At CCN, Victor covers the top cryptocurrencies, memecoins, macro shifts, blending real-time insights with deep-dive metrics.
He holds a Bachelor’s degree in Physics from the University of Ibadan, equipping him to simplify complex data for a wide audience. Follow his work or connect on LinkedIn or X.
Valdrin Tahiri is a cryptocurrency analyst and reporter at CCN, specializing in technical analysis with a focus on Elliott Wave theory, on-chain metrics, and fundamental research. He brings over seven years of experience in the crypto space as both a trader and writer.
He discovered cryptocurrencies in 2017 while earning his MSc in Financial Markets at the Barcelona School of Economics, which sparked a deep interest in blockchain and market dynamics. Since then, he’s contributed to top crypto outlets like BeInCrypto and CoinGape.
Valdrin also served as Community Manager of BeInCrypto’s Telegram group for three years, helping grow it into one of the largest crypto communities worldwide. His expertise in market structure and price patterns allows him to break down complex trends into clear, actionable insights.
He’s published thousands of articles covering altcoins, Bitcoin cycles, and macro trends.