XLM remains trapped in a downtrend despite new CME futures | Credit: Hameem Sarwar
Share
Key Takeaways
XLM’s 30% monthly decline remains intact, with the CME futures launch failing to spark a sustained reversal.
DMI and MFI readings continue to favor sellers, keeping XLM restricted below descending trendline resistance.
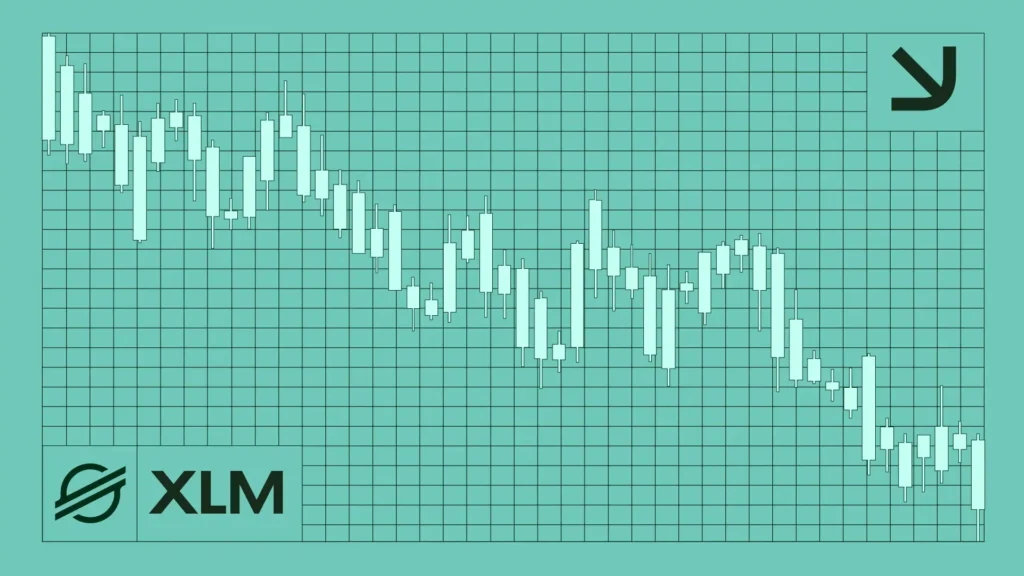
Price is hovering near the zero Fib level around $0.15, as a breakdown would expose it to the $0.13 zone.
Stellar (XLM) has struggled to regain upside momentum after dropping roughly 30% over the past month.
This has occurred despite optimism around the recent CME futures launch, which briefly lifted sentiment.
However, the development proved short-lived, as XLM’s price failed to build on its initial bounce.
Instead of sparking a structural reversal, the launch coincided with renewed selling pressure. As a result, XLM has been trapped below key resistance levels, raising questions about what lies ahead for price action.
The negative -DMI (red) holds at 28.78, well above the positive +DMI (blue) at 14.25, signaling a clear bearish advantage.
Each short-lived bounce meets renewed selling pressure, reinforcing the downtrend rather than weakening it.
Get These Top Crypto Casino Offers Now!
Sponsored
Disclosure
We sometimes use affiliate links in our content, when clicking on those we might receive a commission at no extra cost to you. By using this website you agree to our terms and conditions and privacy policy.
The Average Directional Index (ADX) sits near 24.90, suggesting the bearish trend remains strong even if momentum is not accelerating aggressively.
Furthermore, the Money Flow Index (MFI) further supports this outlook. Hovering around 40.52, the MFI reflects weak buying volume as momentum repeatedly stalls.
Thus, a move below $0.15 could expose the $0.13 region, where the lower boundary of the descending channel aligns with prior demand.
In addition, unless buyers reclaim the $0.18 resistance range and break above the channel structure, XLM’s price might remain vulnerable to further downside.
Derivatives Rollout Fails Rally
Interestingly, this move occurred amid the CME Group’s rollout of futures on Cardano, Chainlink, and Stellar (XLM).
Specifically, they began trading on Feb. 9 in both standard and micro contract sizes, broadening regulated exposure to major altcoins and offering capital-efficient hedging and trading tools.
“Cardano, Chainlink, and Stellar futures are now available to trade. Expand your trading strategy with the capital efficiency and flexibility of these new contracts, available in both larger and micro sizes.” CME stated,
Despite the launch, XLM’s price remained largely muted, underscoring that the derivatives’ debut alone did not spark a strong spot market rally.
According to CCN’s findings, this is largely due to extreme market fear. Assuming broader market conditions were better, XLM’s price might have risen by double digits.
XLM Price Forecast: Bearish
As stated earlier, the announcement initially sparked optimism, reflected in a brief green candle.
But the rally quickly fizzled as XLM hit strong resistance at $0.17. Traders appear cautious, with the futures launch driving headlines more than immediate spot demand.
The Relative Strength Index (RSI) is near the oversold zone, suggesting selling pressure may be nearing exhaustion. However, a relief bounce requires a rebound above neutral levels with improving volume.
Without that confirmation, XLM’s price risks lingering in weak territory, leaving the price exposed to further downside.
The Awesome Oscillator (AO) has also flipped green while remaining in negative territory, signaling that bearish momentum is weakening rather than reversing.
This shift suggests potential short-term stabilization.
At the time of writing, XLM trades around $0.16 within a descending channel, sitting just above the zero Fib level.
Disclaimer:
The information provided in this article is for informational purposes only. It is not intended to be, nor should it be construed as, financial advice. We do not make any warranties regarding the completeness, reliability, or accuracy of this information. All investments involve risk, and past performance does not guarantee future results. We recommend consulting a financial advisor before making any investment decisions.
Victor Olanrewaju is a crypto analyst and reporter at CCN with deep roots in on-chain research and technical analysis. His crypto journey began in 2017, but it was the 2020 Uniswap airdrop that sparked a full-time pivot into the space.
With a foundation in copywriting, Victor honed his craft creating high-converting content for leading crypto brokers — most notably an XRP price prediction that ranked #1 on Google during the 2021 bull run.
He later joined AMBCrypto in 2022, where he combined storytelling with technical and on-chain analysis to cover key market narratives.
In 2024, he expanded his expertise at BeInCrypto, collaborating with analysts and using tools like Glassnode, Santiment, and IntoTheBlock to break down Bitcoin and altcoin trends.
At CCN, Victor covers the top cryptocurrencies, memecoins, macro shifts, blending real-time insights with deep-dive metrics.
He holds a Bachelor’s degree in Physics from the University of Ibadan, equipping him to simplify complex data for a wide audience. Follow his work or connect on LinkedIn or X.