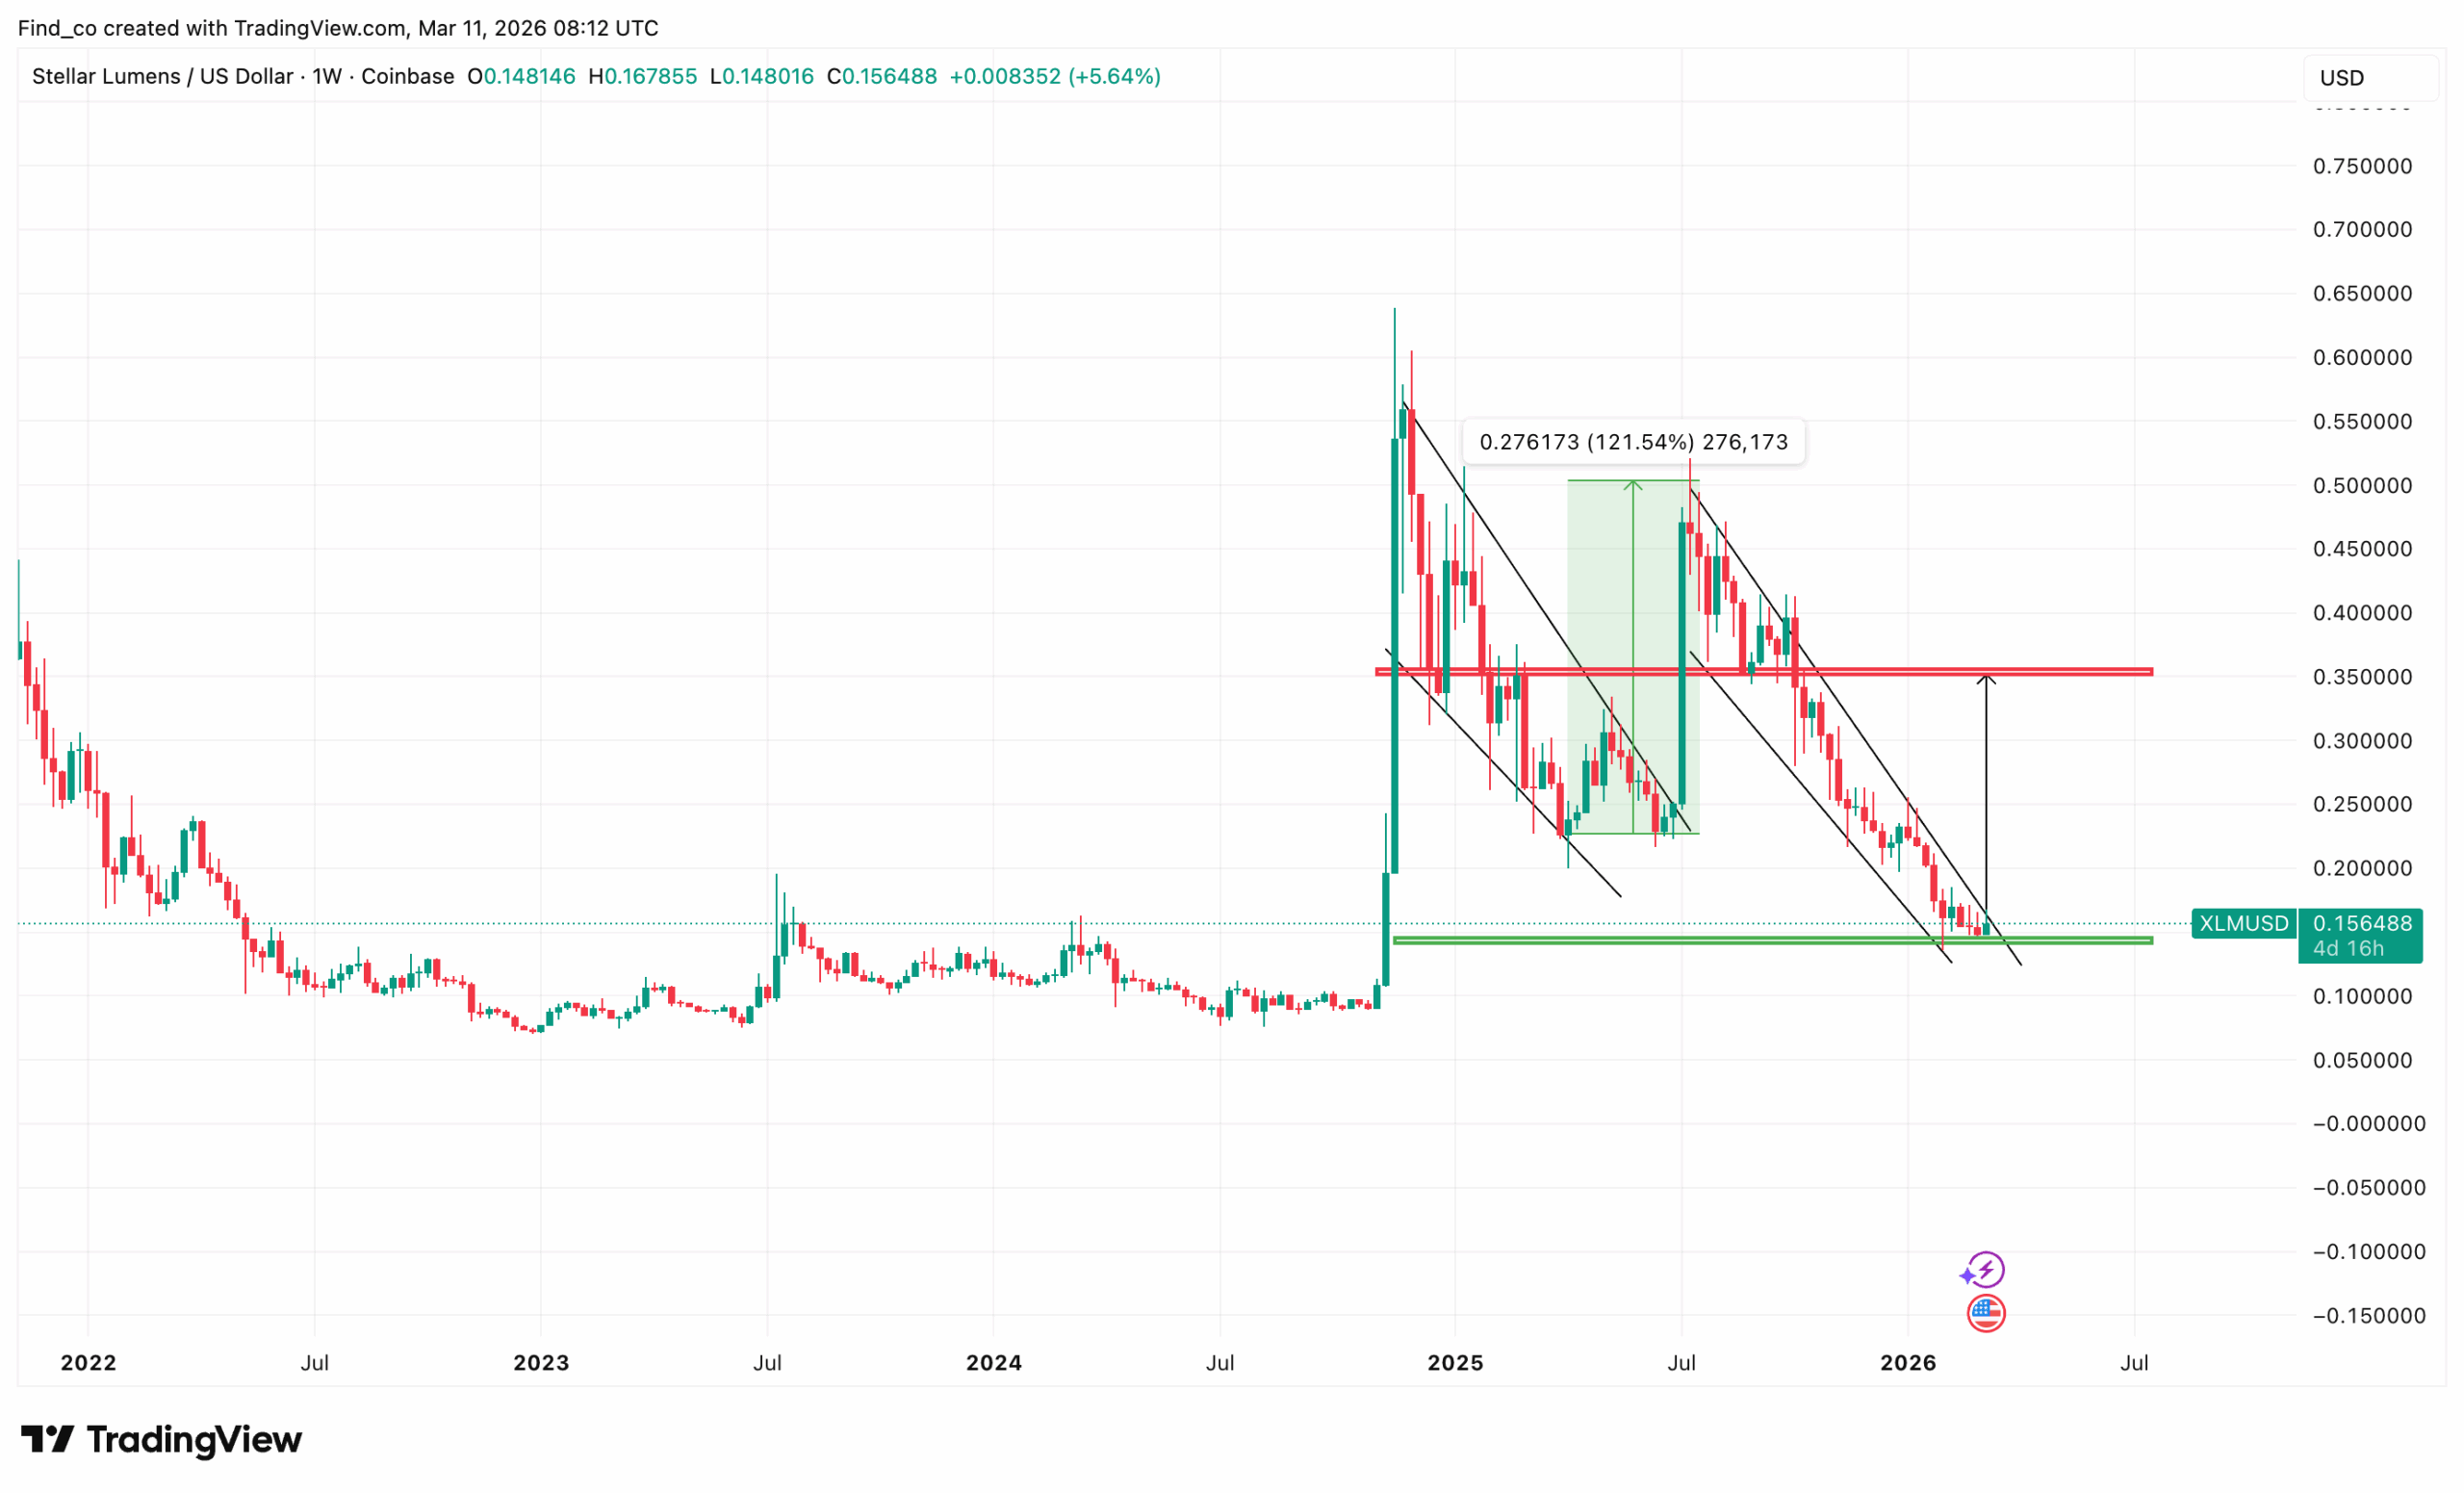
As seen below, the altcoin trades at $0.16, up 5.64% this week. At the same time, it is holding the green support zone at $0.15 that has held through multiple tests dating back to 2022.
That’s a multi-year base, and since the price is bouncing off it again, XLM could be poised to break out.
Get These Top Crypto Casino Offers Now!
Sponsored
Disclosure
We sometimes use affiliate links in our content, when clicking on those we might receive a commission at no extra cost to you. By using this website you agree to our terms and conditions and privacy policy.
However, this will only be the case if demand for XLM increases and the broader crypto market condition improves.
Evidence Flashes On-Chain
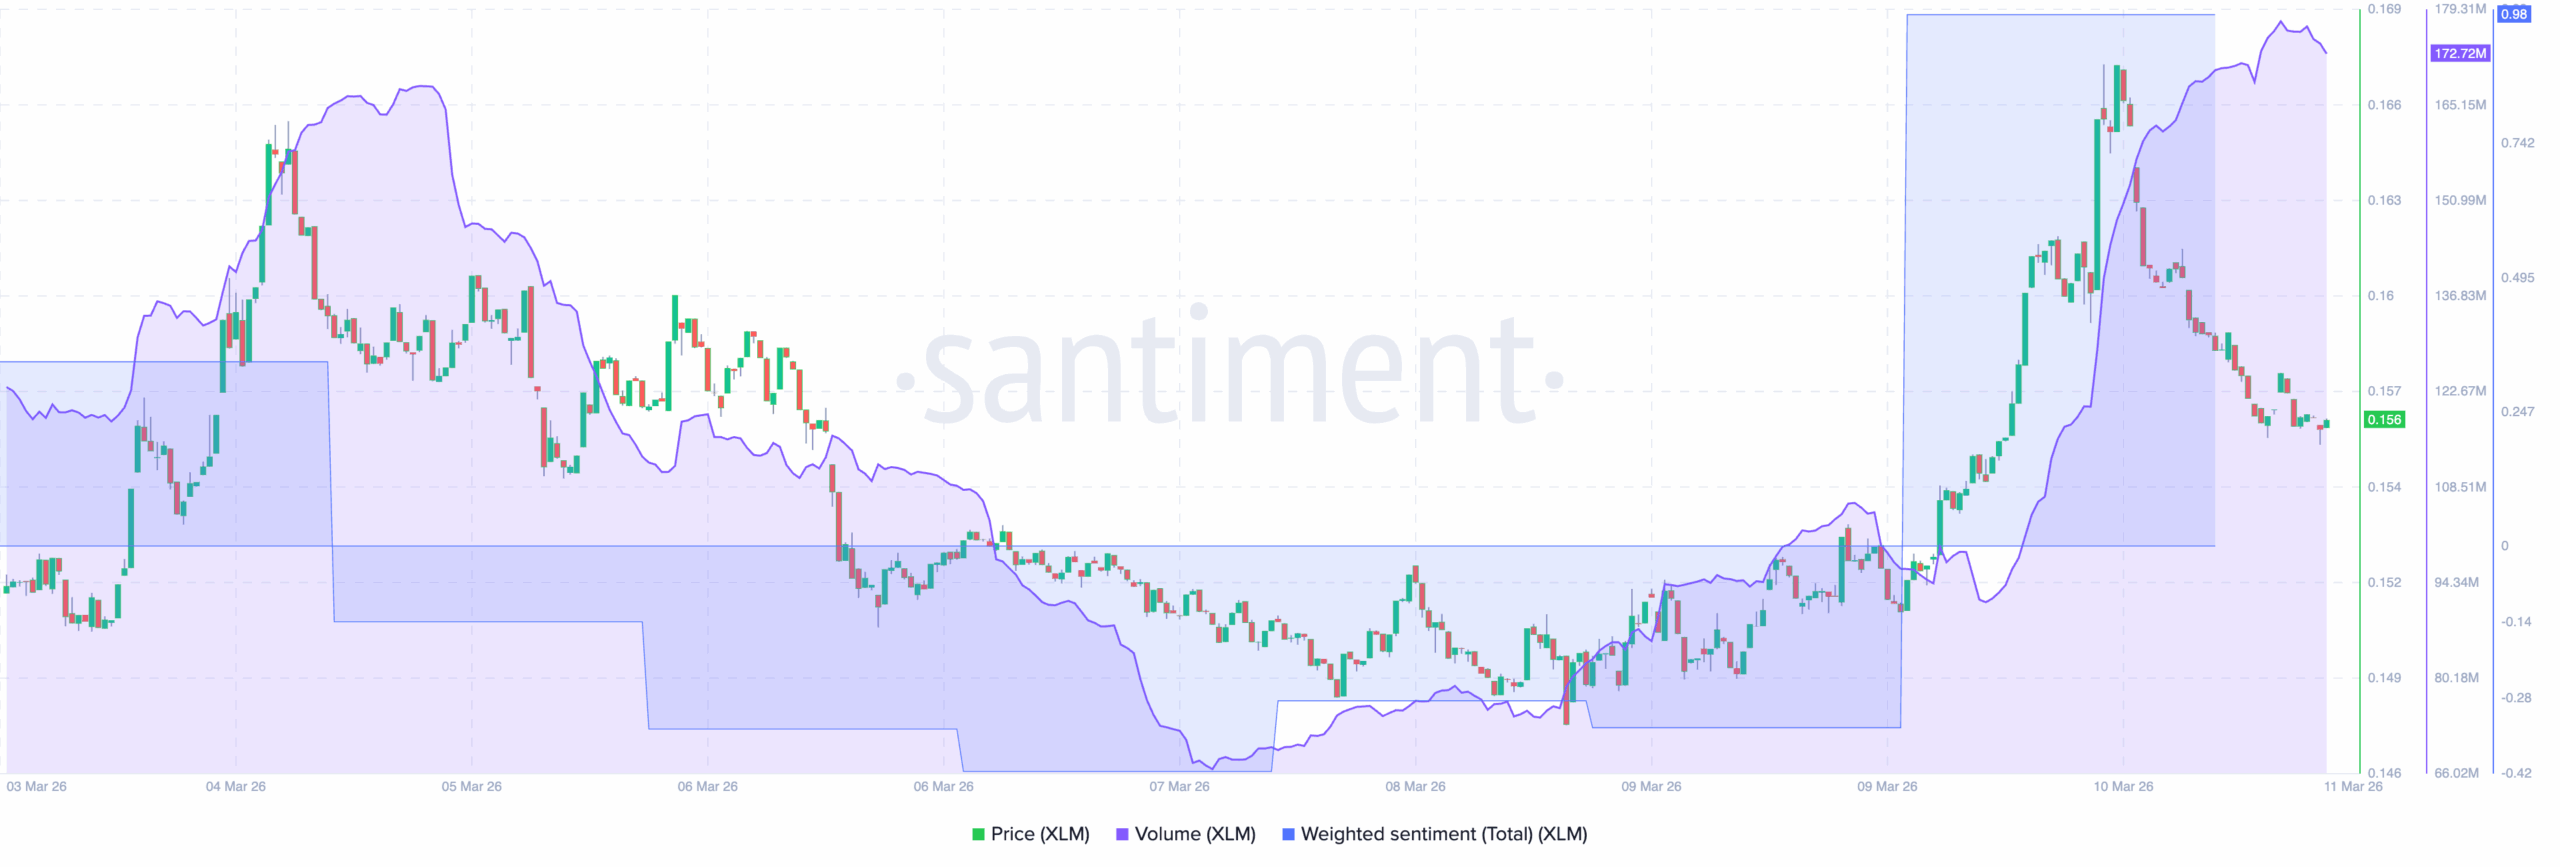
Amid this, the on-chain data reveals a sentiment-volume divergence that demands attention.
According to Santiment data, volume spiked to 179.31 million on March 9 as XLM’s price surged near $0.17.
However, the weighted sentiment peaked at just 0.98 during that move, remarkably subdued for a rally of that size. So, this means that the crowd barely noticed.
That’s the contrarian positive. A volume-driven price surge with low social enthusiasm means the move was likely institutionally or technically driven, not retail FOMO.
From a price perspective, this suggests XLM may be in an accumulation phase. So, if the trading volume continues to hold above $150 million, and sentiment remains positive, demand might increase.
XLM Weighted Sentiment and Trading Volume | Credit: Santiment
Should this be the case, XLM’s price might rally much higher in the coming weeks, potentially testing $0.20.
XLM Short-Term Price Prediction
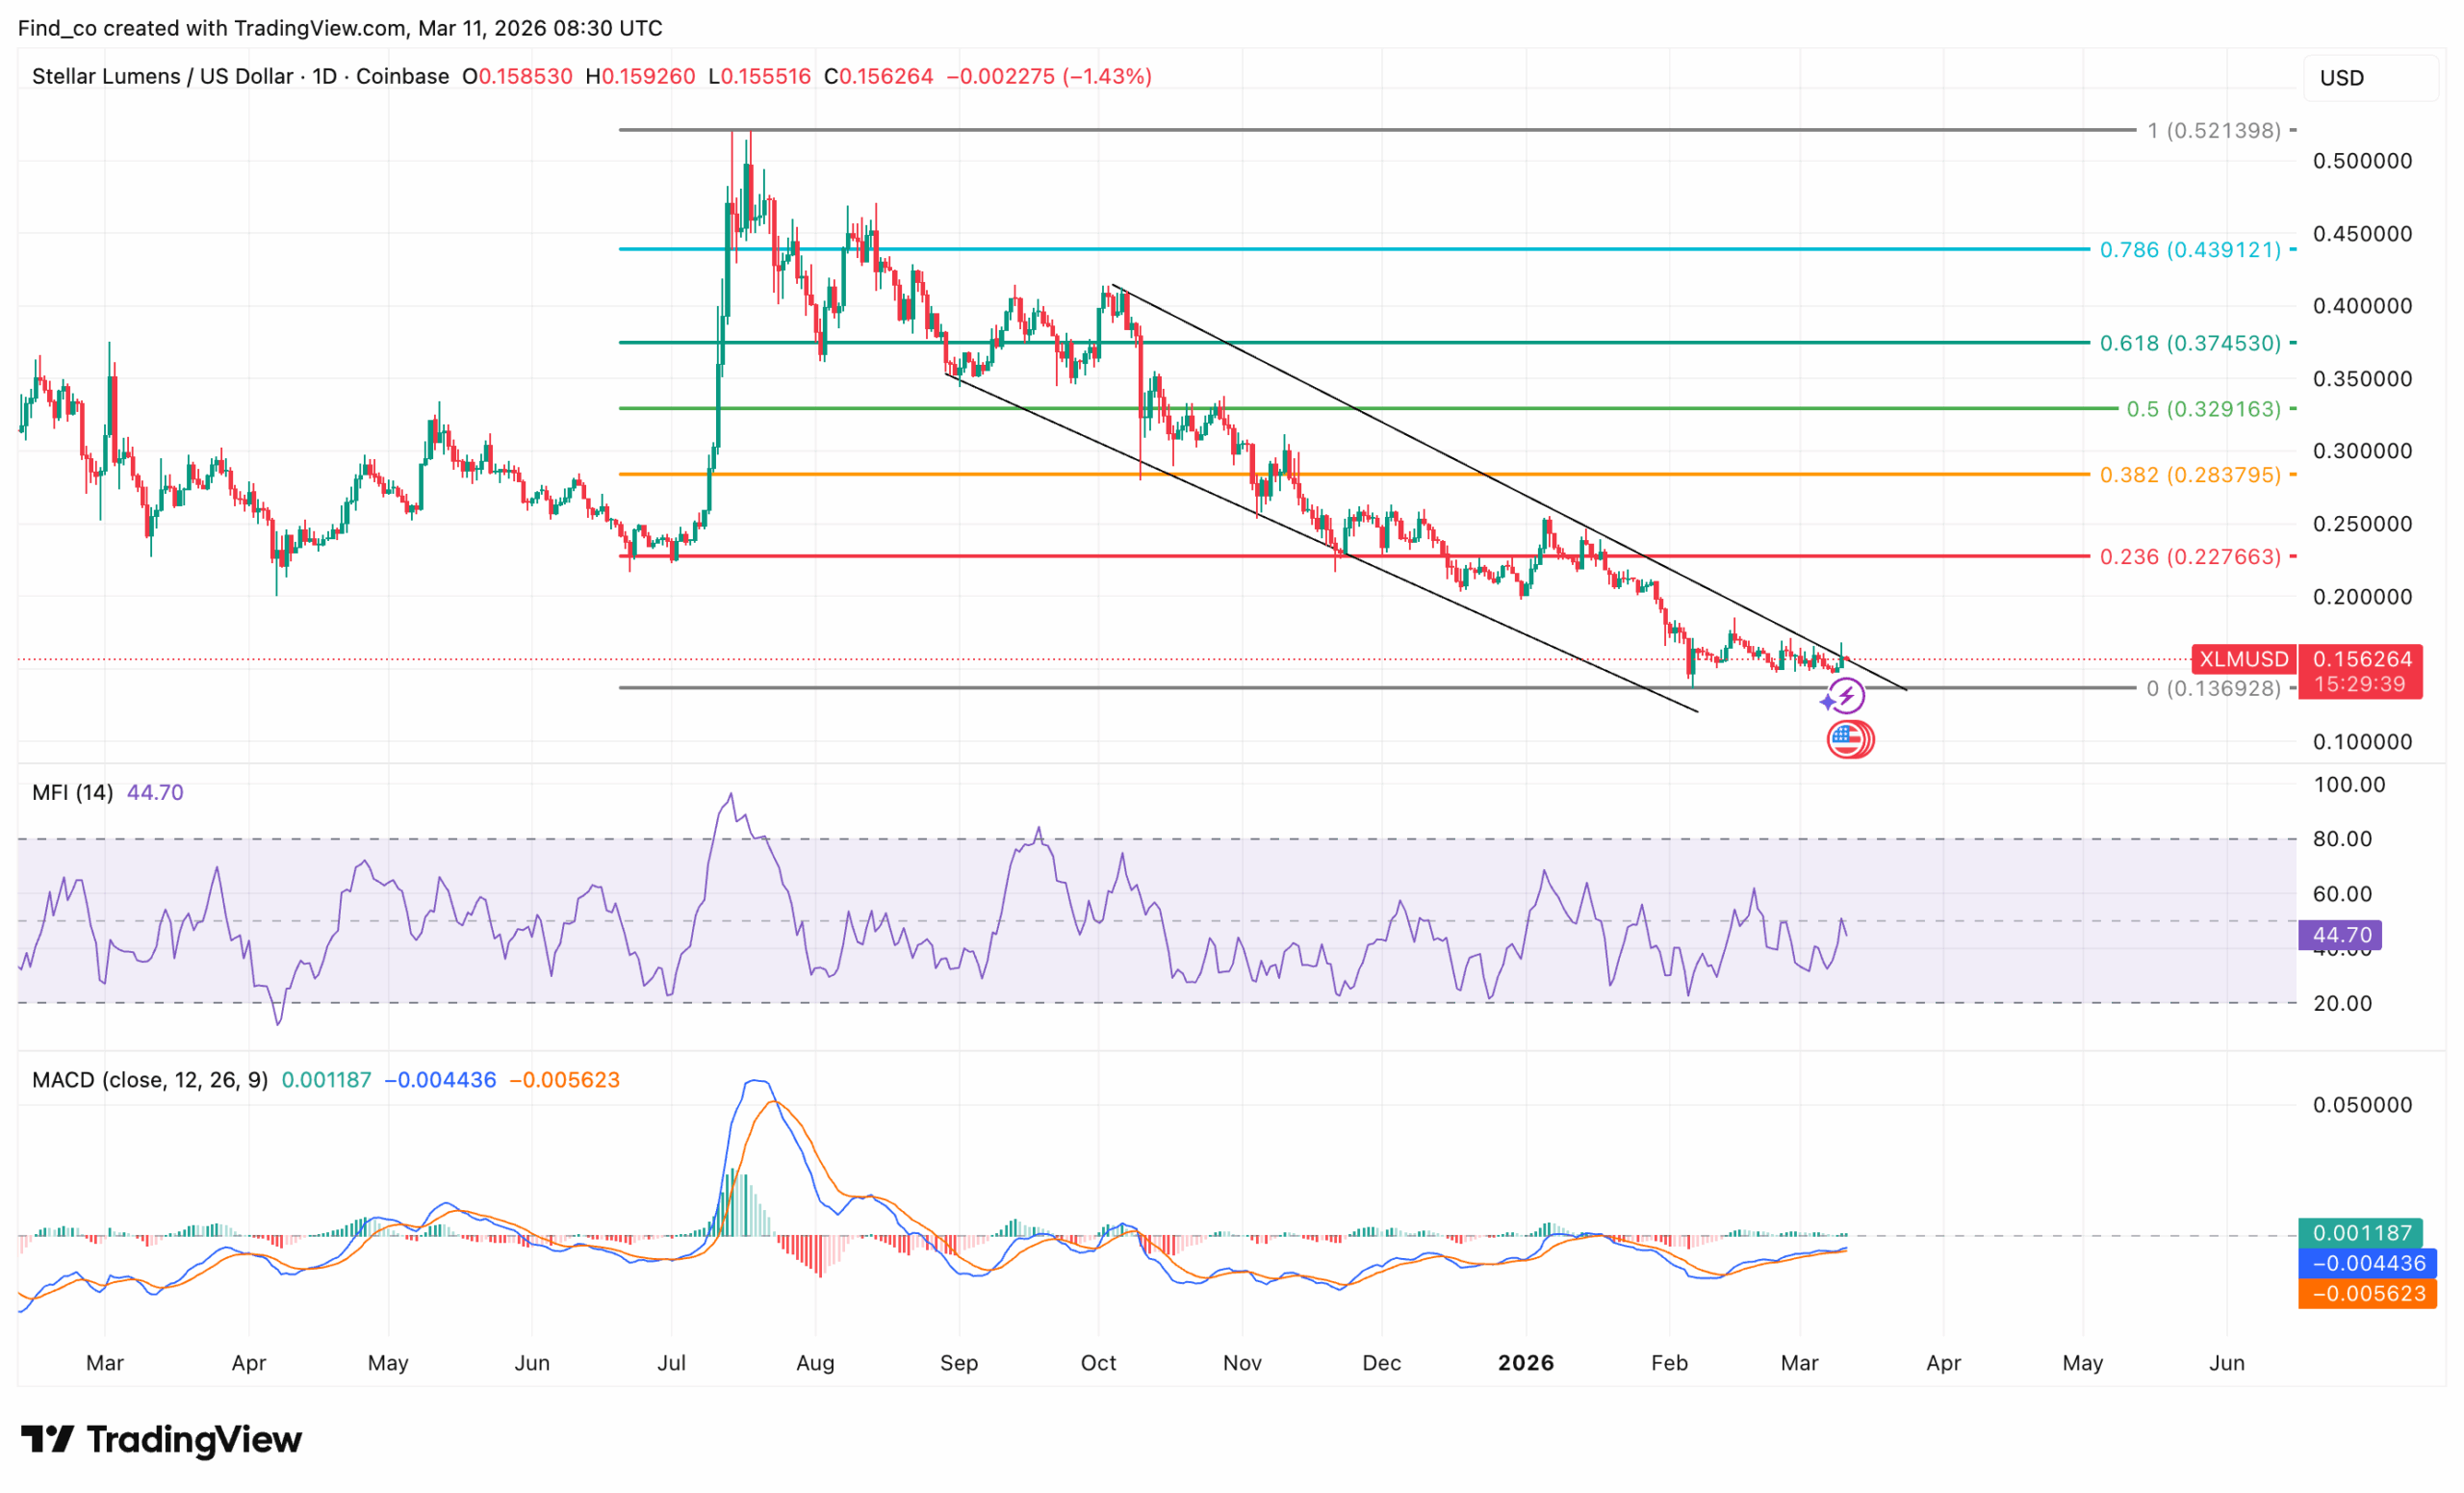
On the daily chart, XLM’s price is at the apex of a descending channel. Notably, this is the first bullish signal in months
As it stands, the altcoin is pressing against both the channel’s upper trendline and the $0.1 zero Fib floor.
However, a potential resolution is imminent.
The MACD has crossed bullish. The line (0.001187) has moved above the signal (-0.004436) for the first time since the July 2025 peak.
It’s a fresh, fragile crossover as the signal line remains deeply negative at -0.005623, but the direction has shifted.
Furthermore, the MFI at 44.70 is neutral with room to run in either direction before hitting overbought or oversold extremes.
Disclaimer:
The information provided in this article is for informational purposes only. It is not intended to be, nor should it be construed as, financial advice. We do not make any warranties regarding the completeness, reliability, or accuracy of this information. All investments involve risk, and past performance does not guarantee future results. We recommend consulting a financial advisor before making any investment decisions.
Victor Olanrewaju is a crypto analyst and reporter at CCN with deep roots in on-chain research and technical analysis. His crypto journey began in 2017, but it was the 2020 Uniswap airdrop that sparked a full-time pivot into the space.
With a foundation in copywriting, Victor honed his craft creating high-converting content for leading crypto brokers — most notably an XRP price prediction that ranked #1 on Google during the 2021 bull run.
He later joined AMBCrypto in 2022, where he combined storytelling with technical and on-chain analysis to cover key market narratives.
In 2024, he expanded his expertise at BeInCrypto, collaborating with analysts and using tools like Glassnode, Santiment, and IntoTheBlock to break down Bitcoin and altcoin trends.
At CCN, Victor covers the top cryptocurrencies, memecoins, macro shifts, blending real-time insights with deep-dive metrics.
He holds a Bachelor’s degree in Physics from the University of Ibadan, equipping him to simplify complex data for a wide audience. Follow his work or connect on LinkedIn or X.