ETH’s Seller Exhaustion Constant has hit its lowest reading in over 35 days. This signals that panic sellers have largely exited, and a price bottom may be forming.
Spot Ethereum ETFs recorded $18.28 million in net inflows this week. It indicates that institutional investors are beginning to position for a recovery despite ongoing geopolitical tensions.
ETH’s Smart Money Index continues to climb on the daily chart, with bulls targeting a break above $2,158 resistance.
Leading altcoin Ethereum (ETH) has spent the past month trading in a tight range.
With the coin’s price oscillating between resistance at $2,158 and support formed at $1,800 for more than 30 days, the market’s sentiment has been dampened, with many traders adopting a wait-and-see approach.
However, one key on-chain metric points to a bullish outlook and hints at a possible recovery toward $2,700.
ETH’s Panic Sellers Have Dried Up — A Bottom May Be In
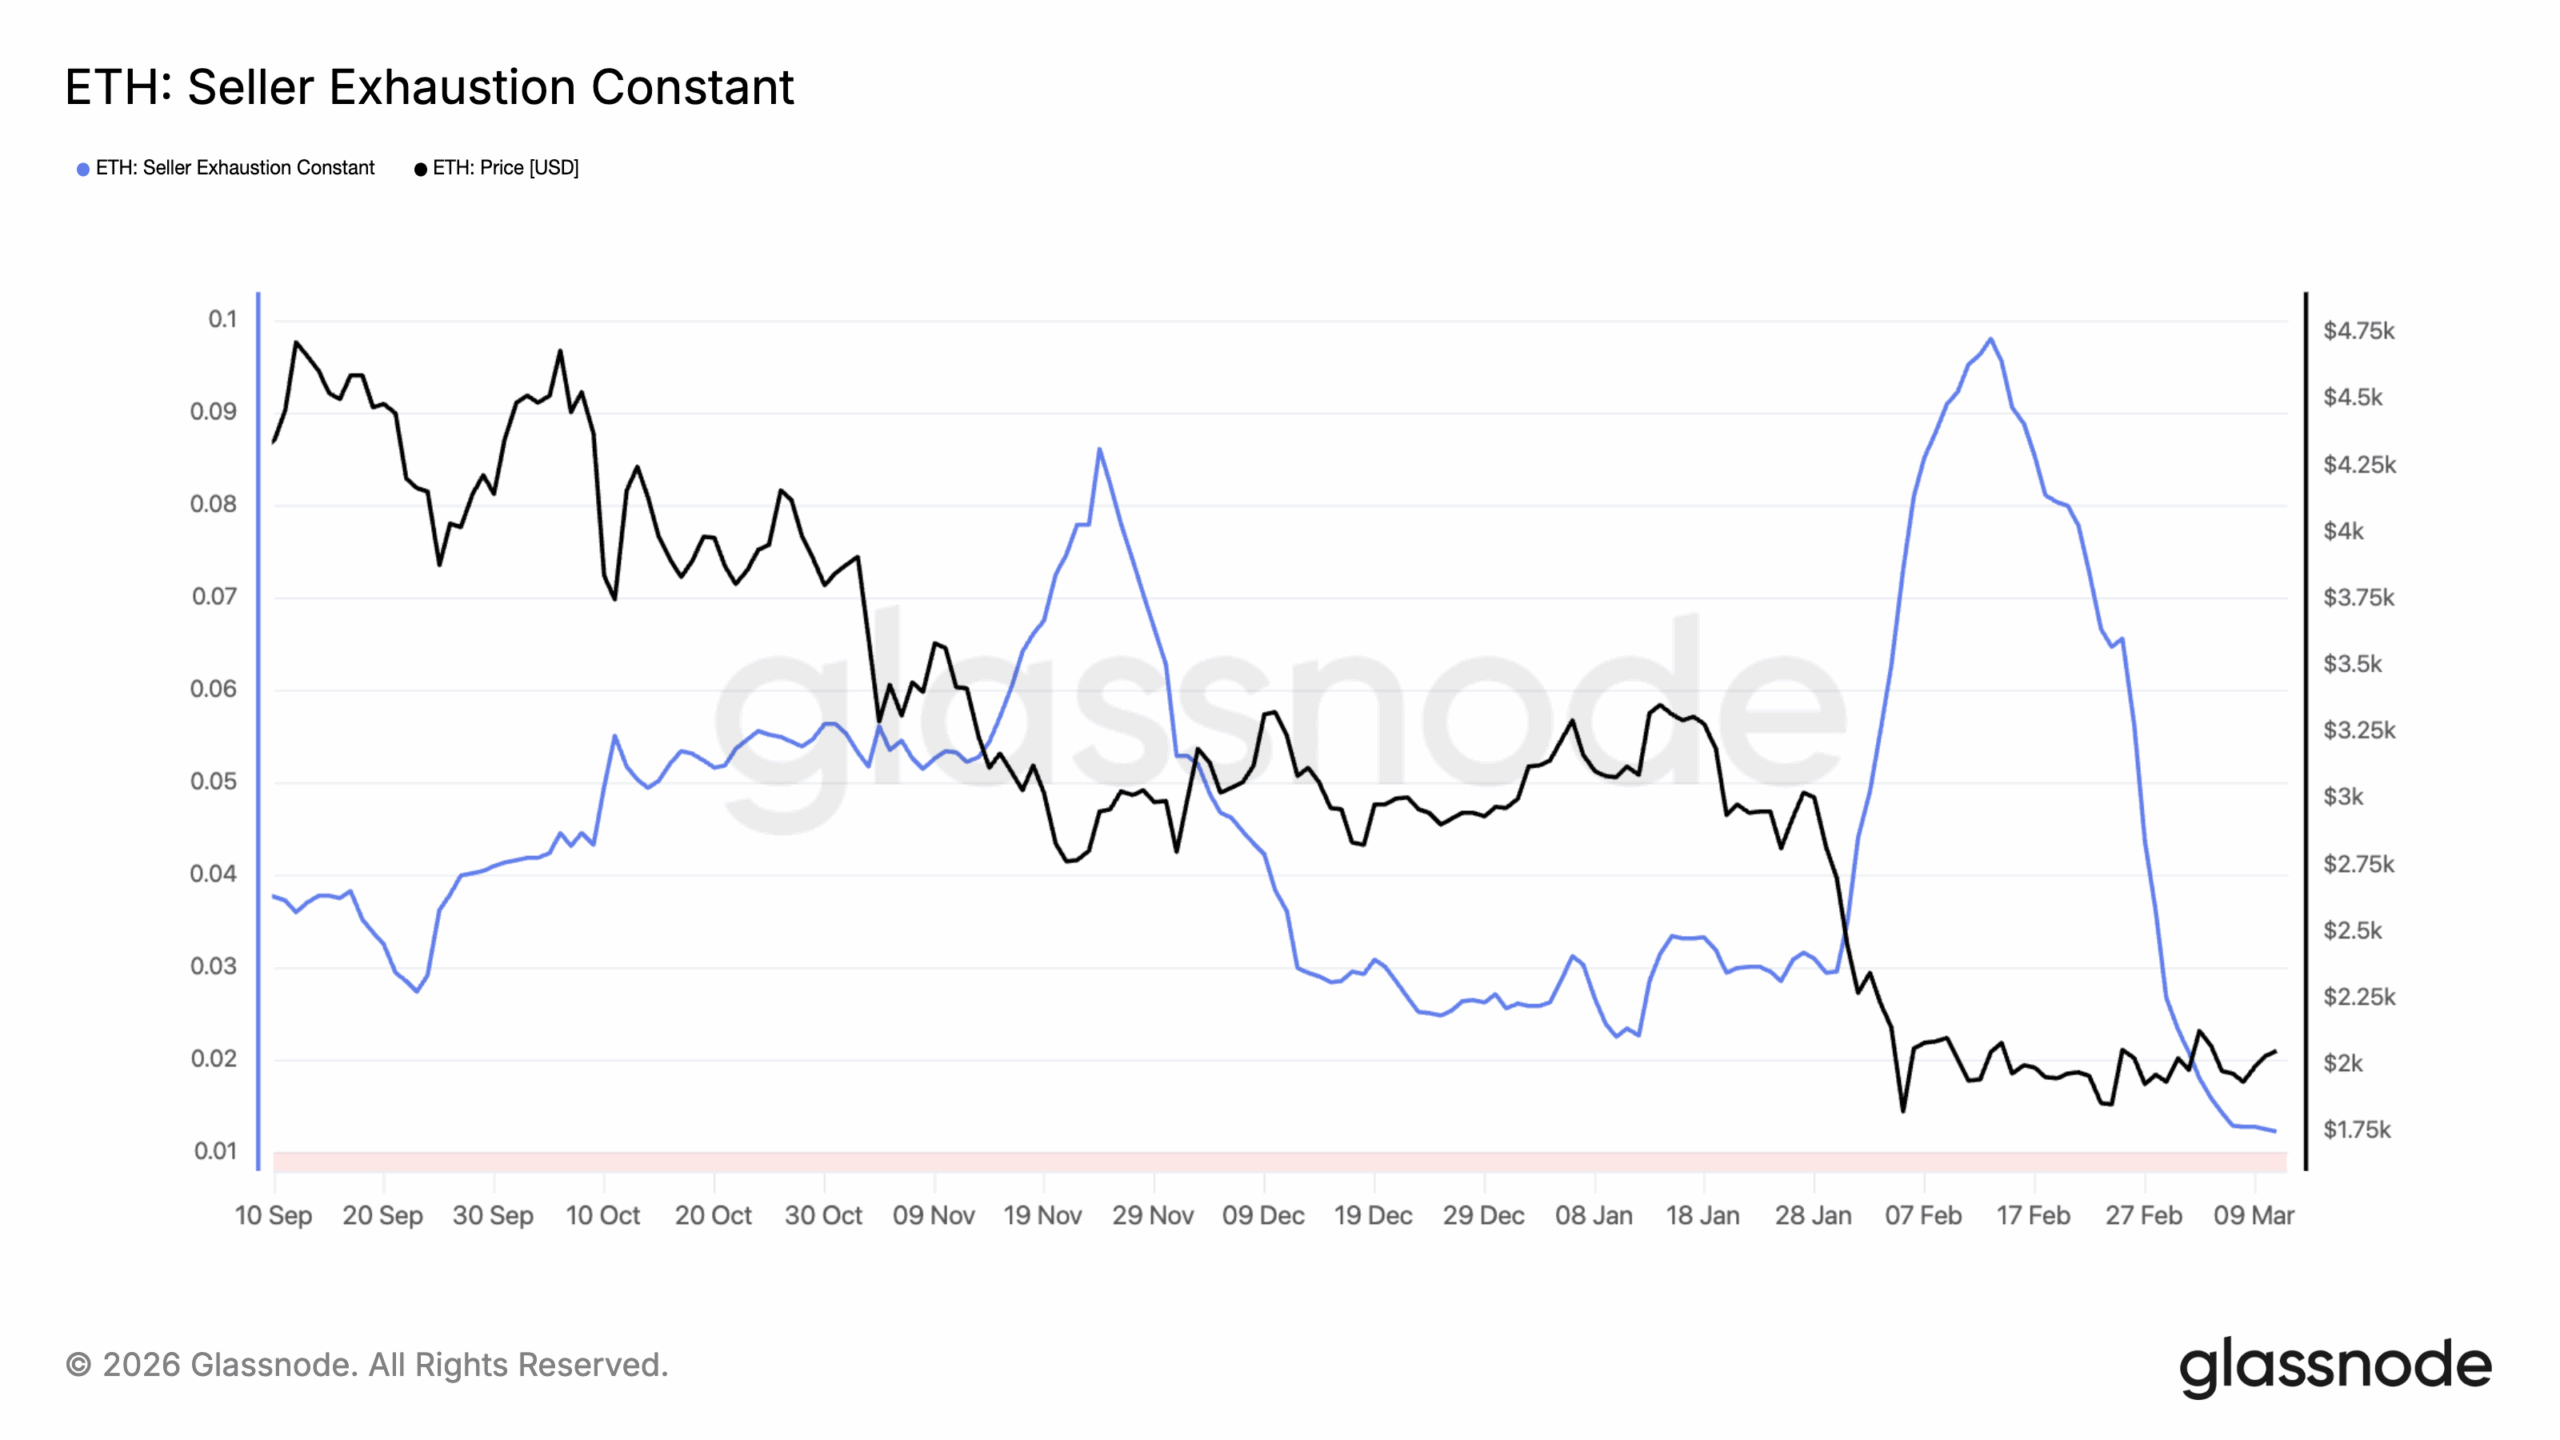
The metric in focus here is ETH’s Seller Exhaustion Constant. According to Glassnode, it has fallen to its lowest reading in over a month. Per the data provider, the metric has steadily declined from 0.018 on February 13 to approximately 0.013 as of March 11.
The metric identifies potential market bottoms by multiplying the percentage of an asset’s supply in profit by its 30-day price volatility.
When an asset’s Seller Exhaustion Constant trends lower, it means a large portion of its supply is underwater, and the price has stopped moving violently.
When the market reaches this point, it is deemed that participants who were going to sell have largely already done so, and the remaining holders are either unwilling or unable to add further downside pressure.
This points to a price bottom that is often followed by an upward move.
Historically, a collapse in ETH’s Seller Exhaustion Constant has often preceded an uptrend. On November 21, 2025, for instance, the metric bottomed at 0.074, triggering a rally that pushed ETH to $2,954 within three days.
A more recent example followed on February 5, when the metric fell to its year-to-date low of 0.073. This was followed by a price surge to ETH’s year-to-date high of $2,048 by February 13.
Now, with the Seller Exhaustion Constant at its lowest level in over 30 days, sell-side pressure is at its weakest in weeks, and a recovery may be imminent.
Institutional Money Is Returning to Ethereum
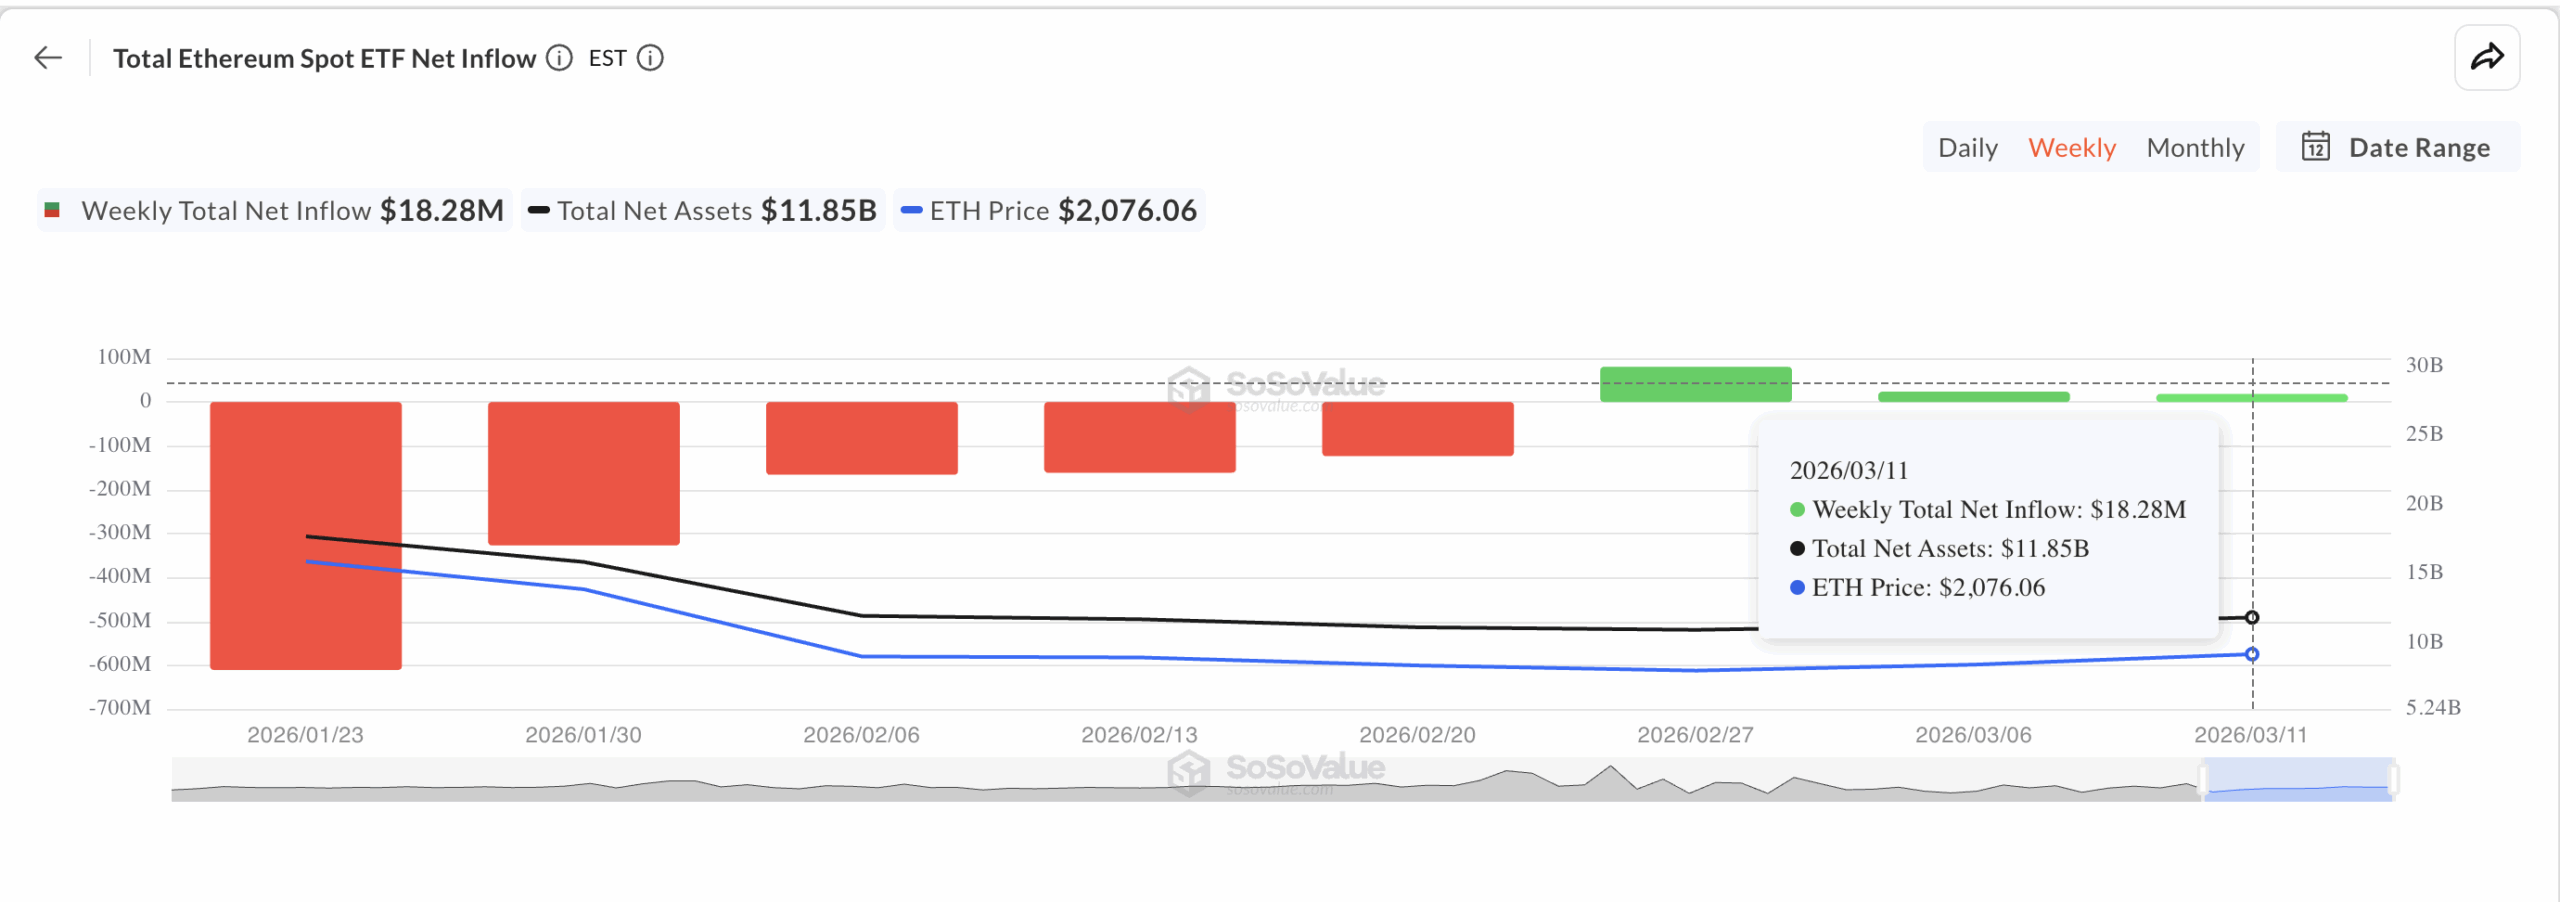
Spot Ethereum ETFs have recorded consistent inflows since Tuesday, adding to the bullish outlook.
This trend is notable given that investor sentiment has been rattled by ongoing geopolitical tensions following the US-Israel military operation against Iran.
According to SosoValue, so far this week, inflows into spot ETH ETFs have totaled $18.28 million, showing that some investors are looking past the geopolitical noise and positioning for a recovery.
Total Ethereum Spot ETF Net Inflow | Credit: SosoValue
Break $2,158 Toward $2,784 or Fall to April 2025 Lows?
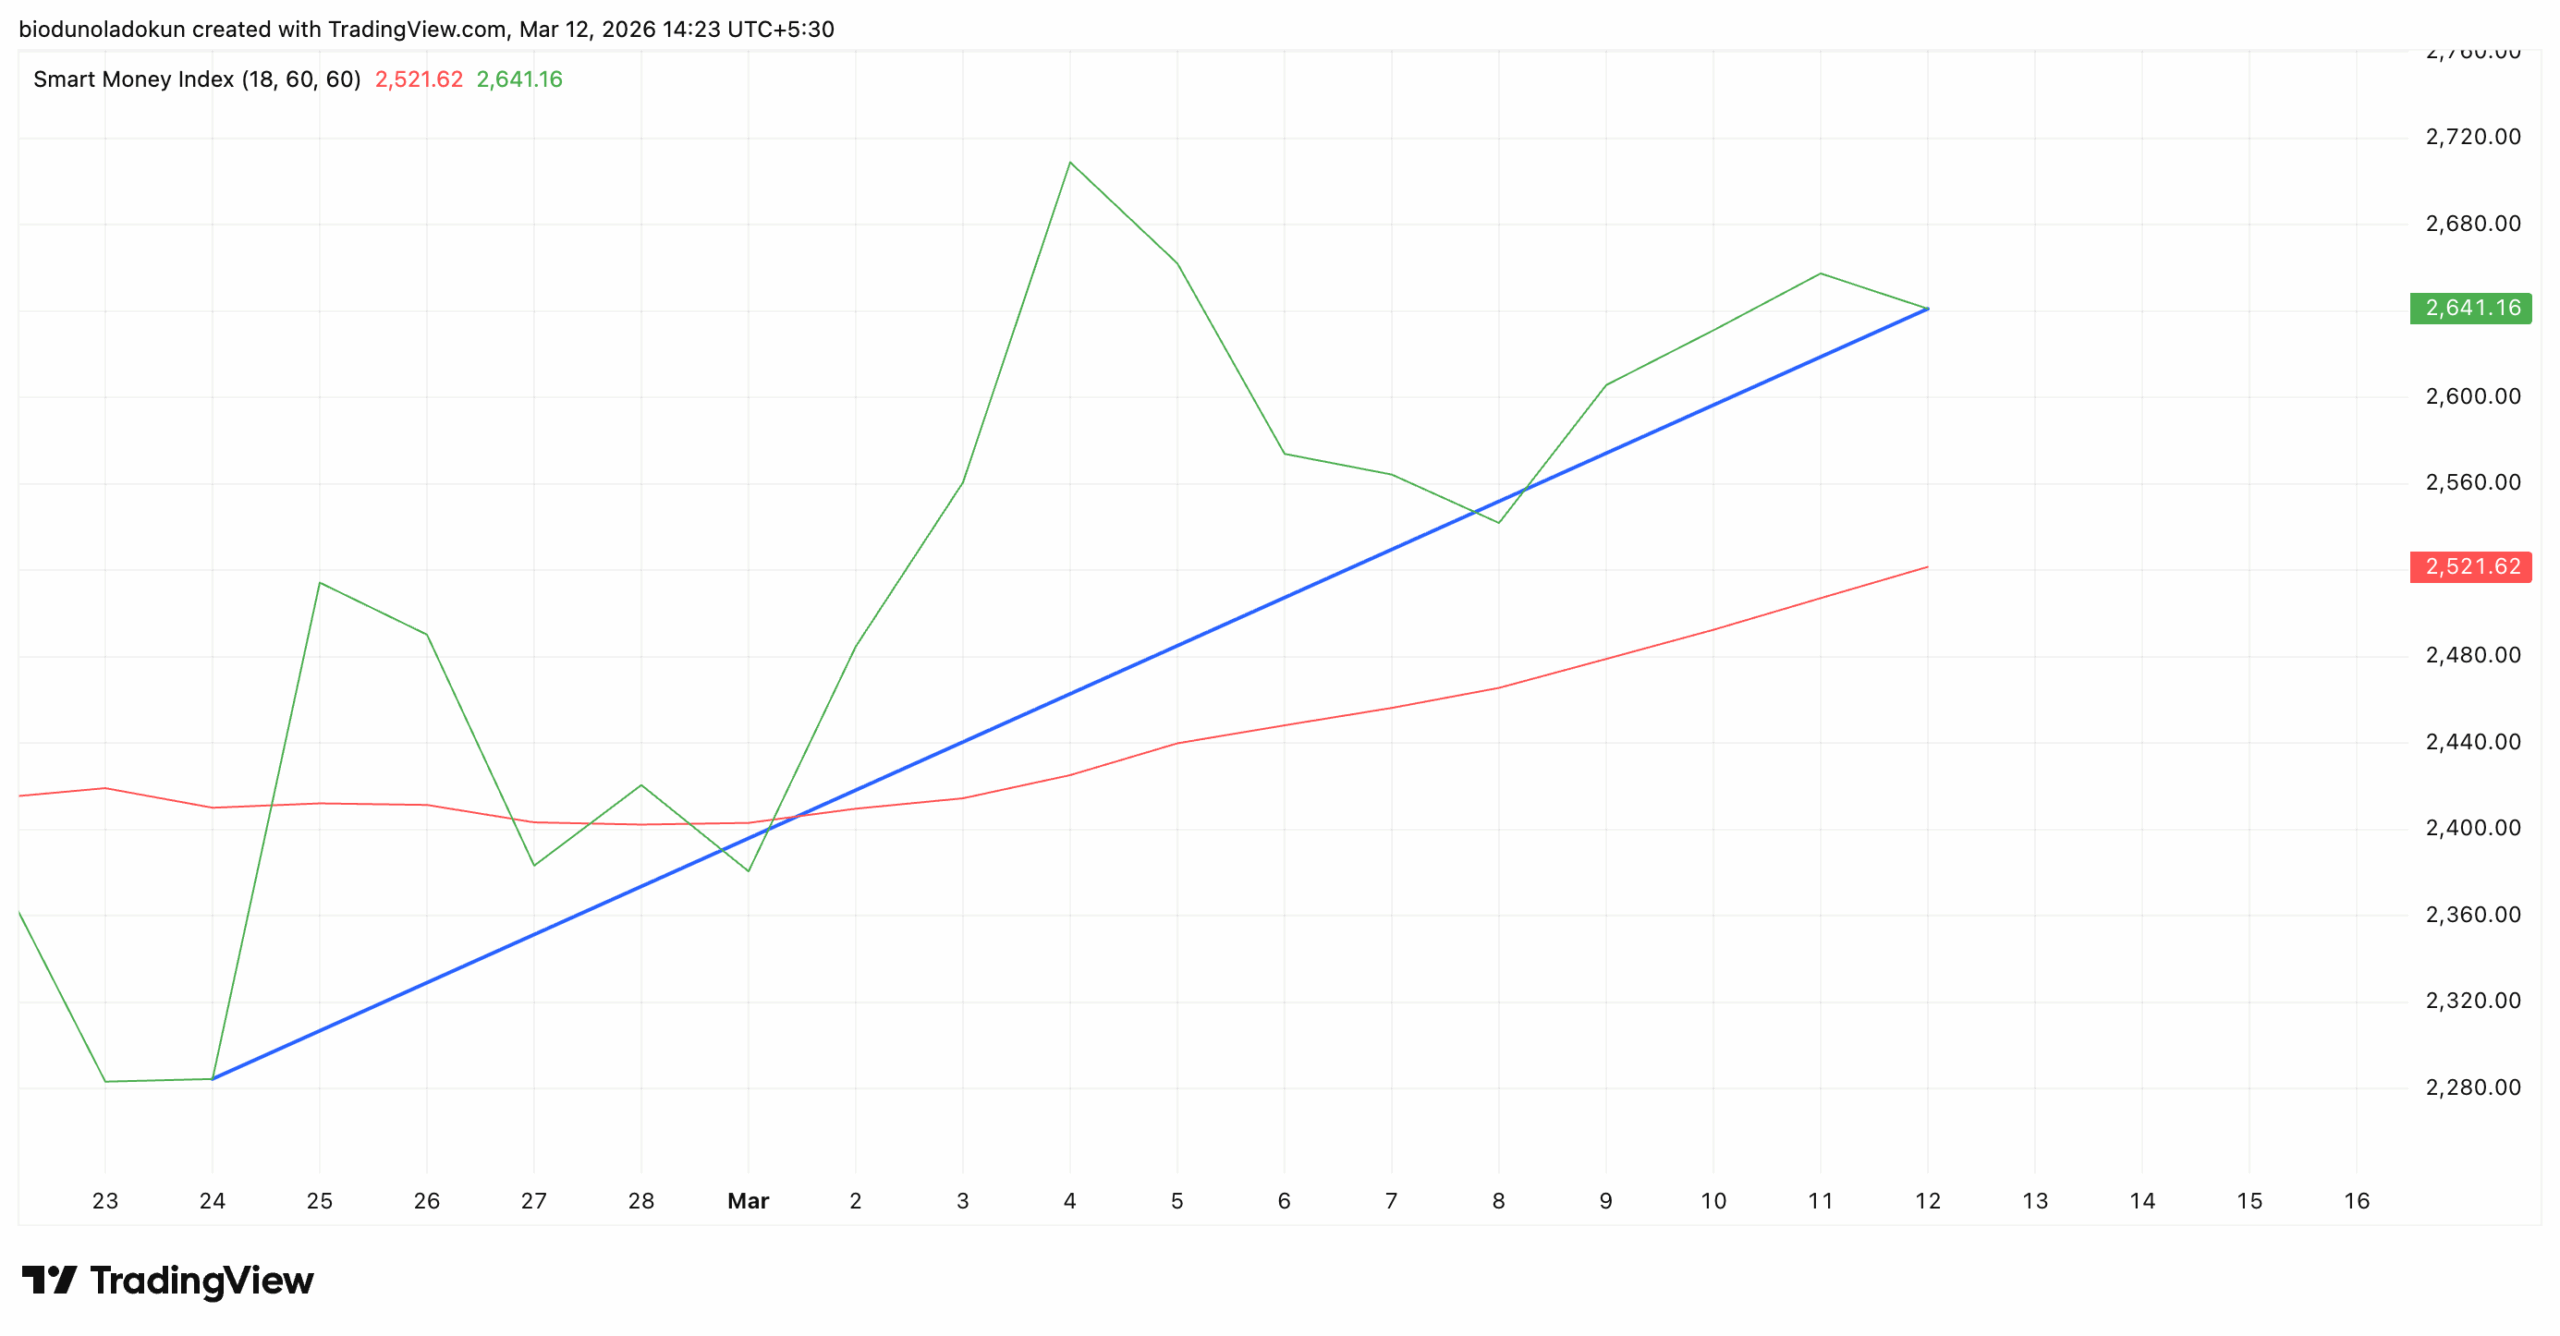
Readings from the ETH/USD one-day chart support this bullish outlook. The coin’s Smart-Money Index (SMI) continues to climb, despite some reversals.
The SMI measures institutional investor activity by tracking price movements at specific points in the trading day. It reflects how “smart money” trades during the end-of-day sessions, after retail-driven volatility in the morning.
When an asset’s SMI spikes, it signals increased confidence from institutional investors, often indicating a bullish outlook.
This trend indicates that some institutional players in the ETH market have seen its lackluster price performance as an opportunity to position for further upside as the market awaits recovery.
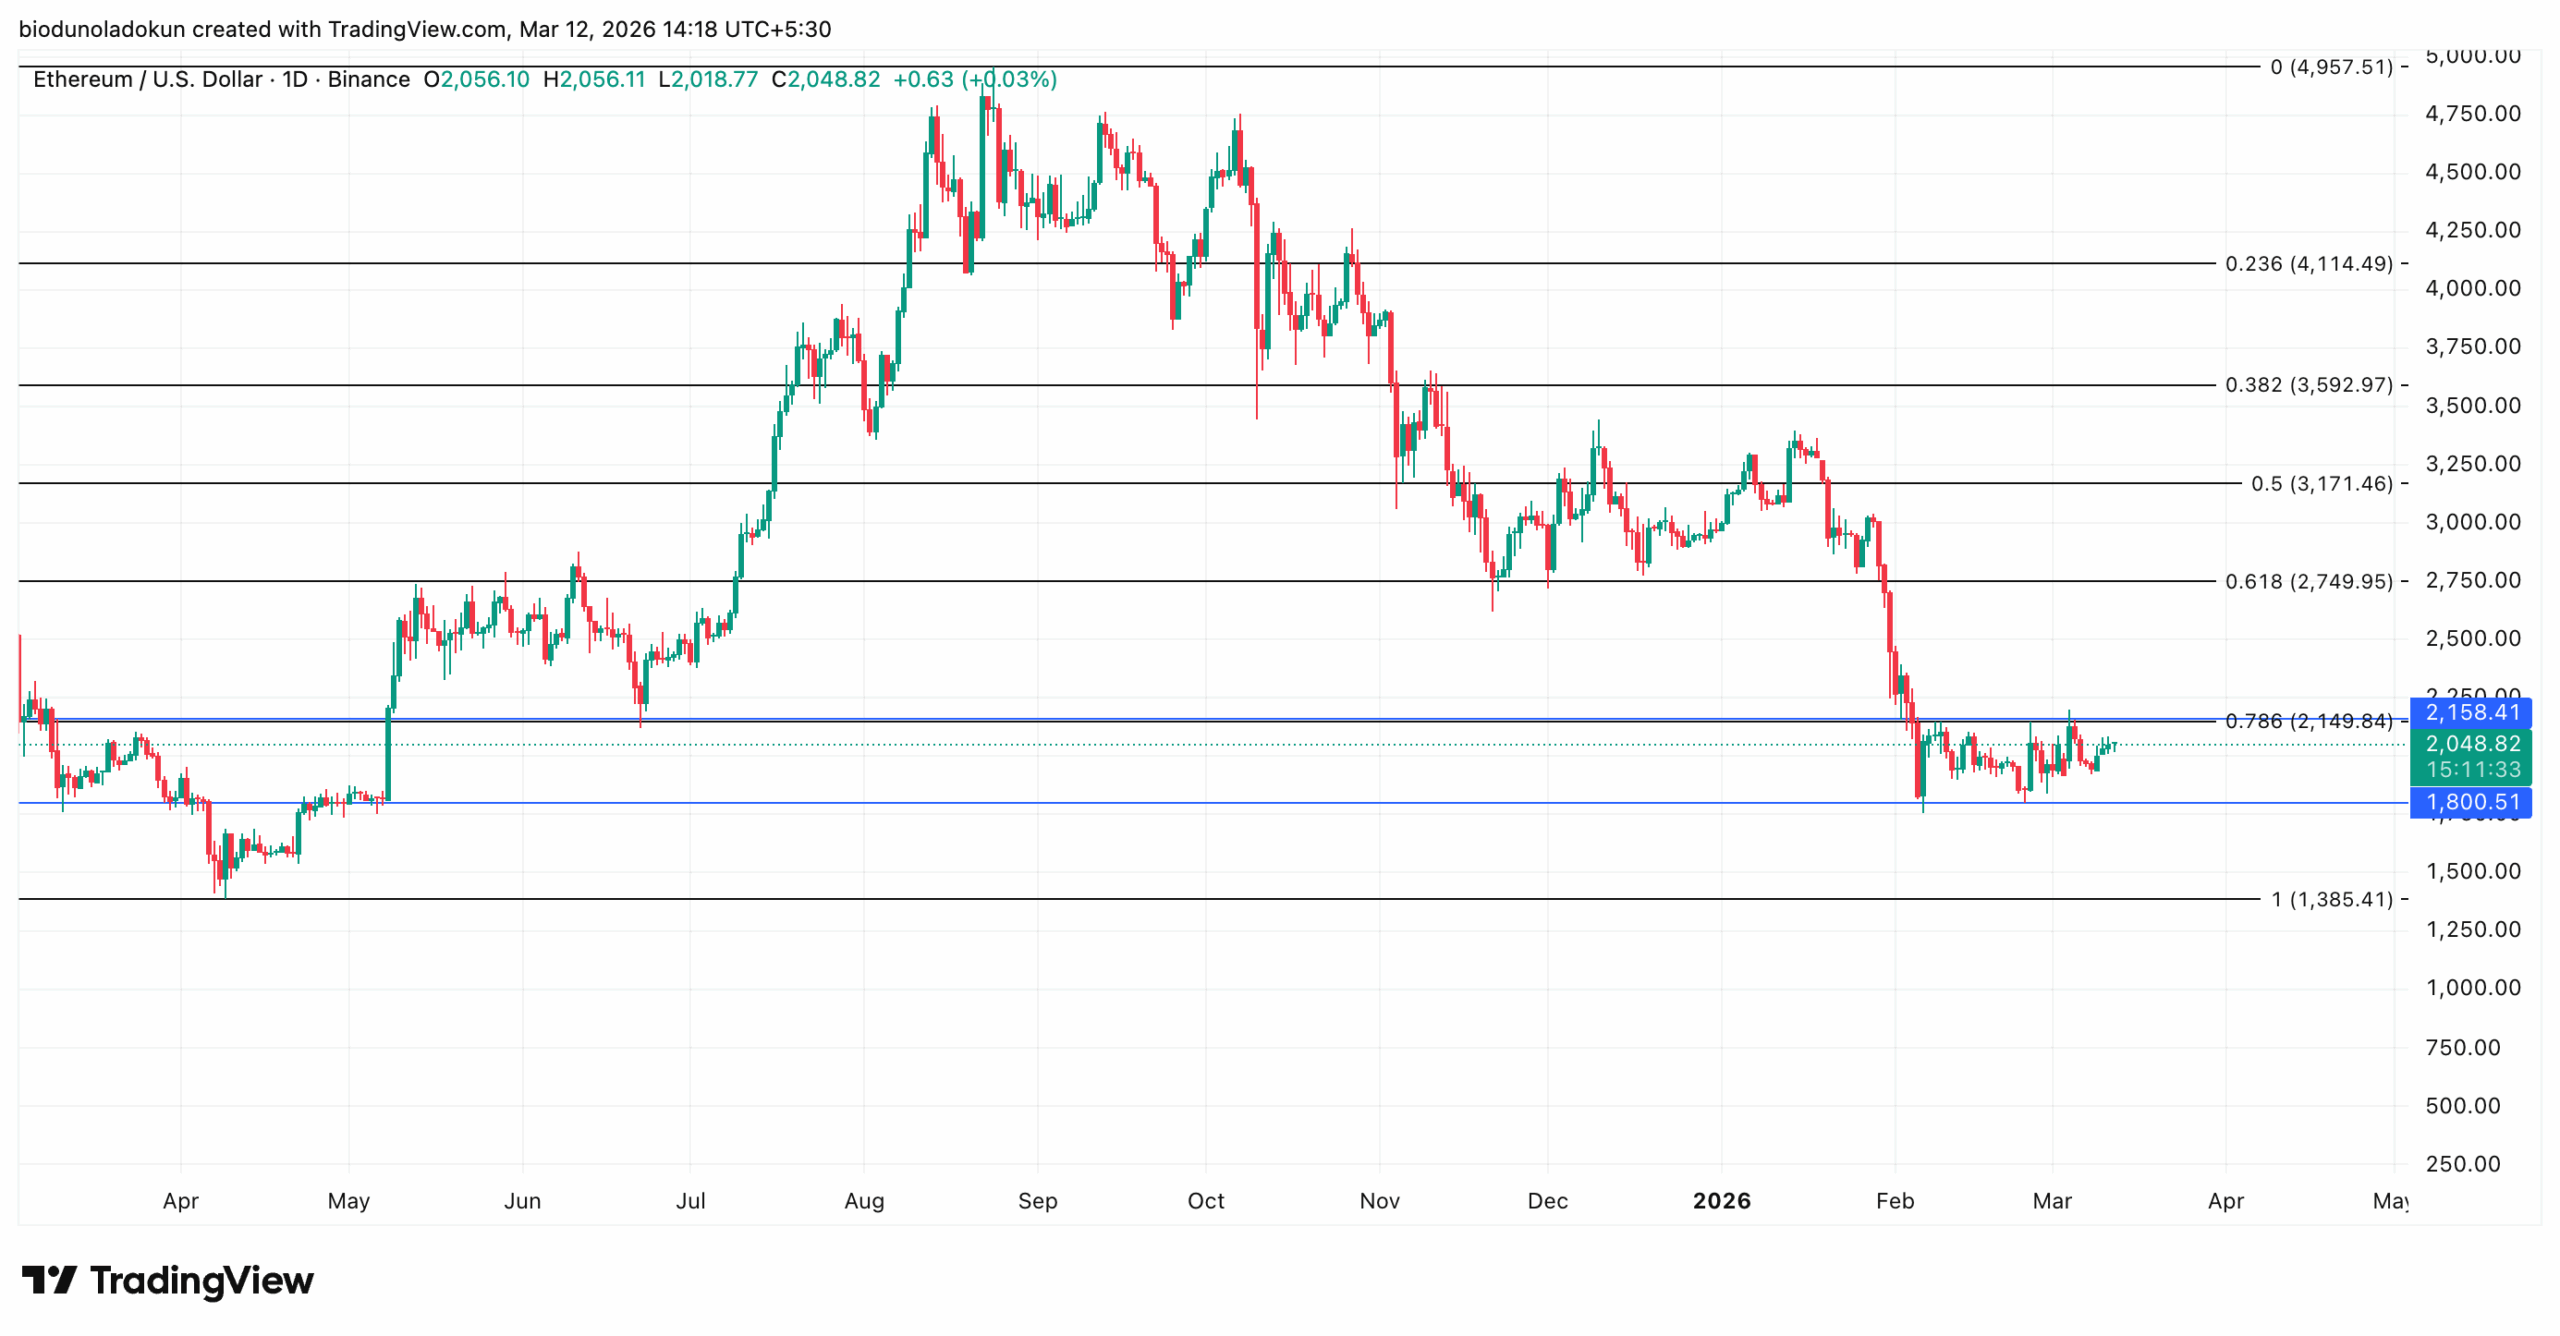
If buy-side pressure strengthens and pushes ETH above the $2,158 resistance, it will open the door to a rally toward $2,749.
ETH/USD Daily Chart | Credit: TradingView
On the other hand, if demand weakens, the coin could fall below the $1,800 support, toward $1385, a low last reached in April 2025.
[You-may-like]
Disclaimer:
The information provided in this article is for informational purposes only. It is not intended to be, nor should it be construed as, financial advice. We do not make any warranties regarding the completeness, reliability, or accuracy of this information. All investments involve risk, and past performance does not guarantee future results. We recommend consulting a financial advisor before making any investment decisions.
Abiodun Oladokun is a Research Analyst at CCN, where he covers cryptocurrency markets with a focus on on-chain analysis, technical assessments, and emerging trends across decentralized finance (DeFi), real-world assets (RWA), artificial intelligence (AI), decentralized physical infrastructure networks (DePIN), Layer 2s, and meme coins.
Prior to CCN, he served as a Senior On-Chain Analyst at BeInCrypto, producing market reports spanning diverse crypto sectors.
Before that, he conducted technical analysis and market assessments of various altcoins at AMBCrypto, where he also contributed long-form quarterly research papers on DeFi, NFTs, DAOs, and scaling architectures, leveraging on-chain platforms including Messari, Santiment, DefiLlama, and Dune Analytics.
He began his crypto career as a research analyst at SixthSense DAO, developing blockchain forensic tools to trace the history of stolen assets.
Abiodun is a lawyer called to the Nigerian Bar and the founder of Ilé Ijó, a Lagos-based electronic dance music collective.