XLM price is likely to see more gains — Here is why | Credit: Hameem Sarwar
Share
Key Takeaways
The crypto market has added nearly $250 billion in three days, lifting the total capitalization $2.45 trillion.
On the lower timeframe, XLM is building a structure above the $0.15 zone after bouncing from a sell-off.
If buyers succeed, $0.25 becomes the next key resistance level and a potential upside target for XLM.
The last few days have been subtly positive for the broader crypto market.
Specifically, the total market capitalization climbed from $2.20 trillion on March 2 to $2.45 trillion today, an increase of $250 billion.
This development signals a sharp return of liquidity and risk appetite. Amid that, Stellar (XLM) price is attempting to stabilize after weeks of choppy, corrective price action.
In this analysis, CCN reveals what could be next for XLM’s price if the broader market remains relatively stable.
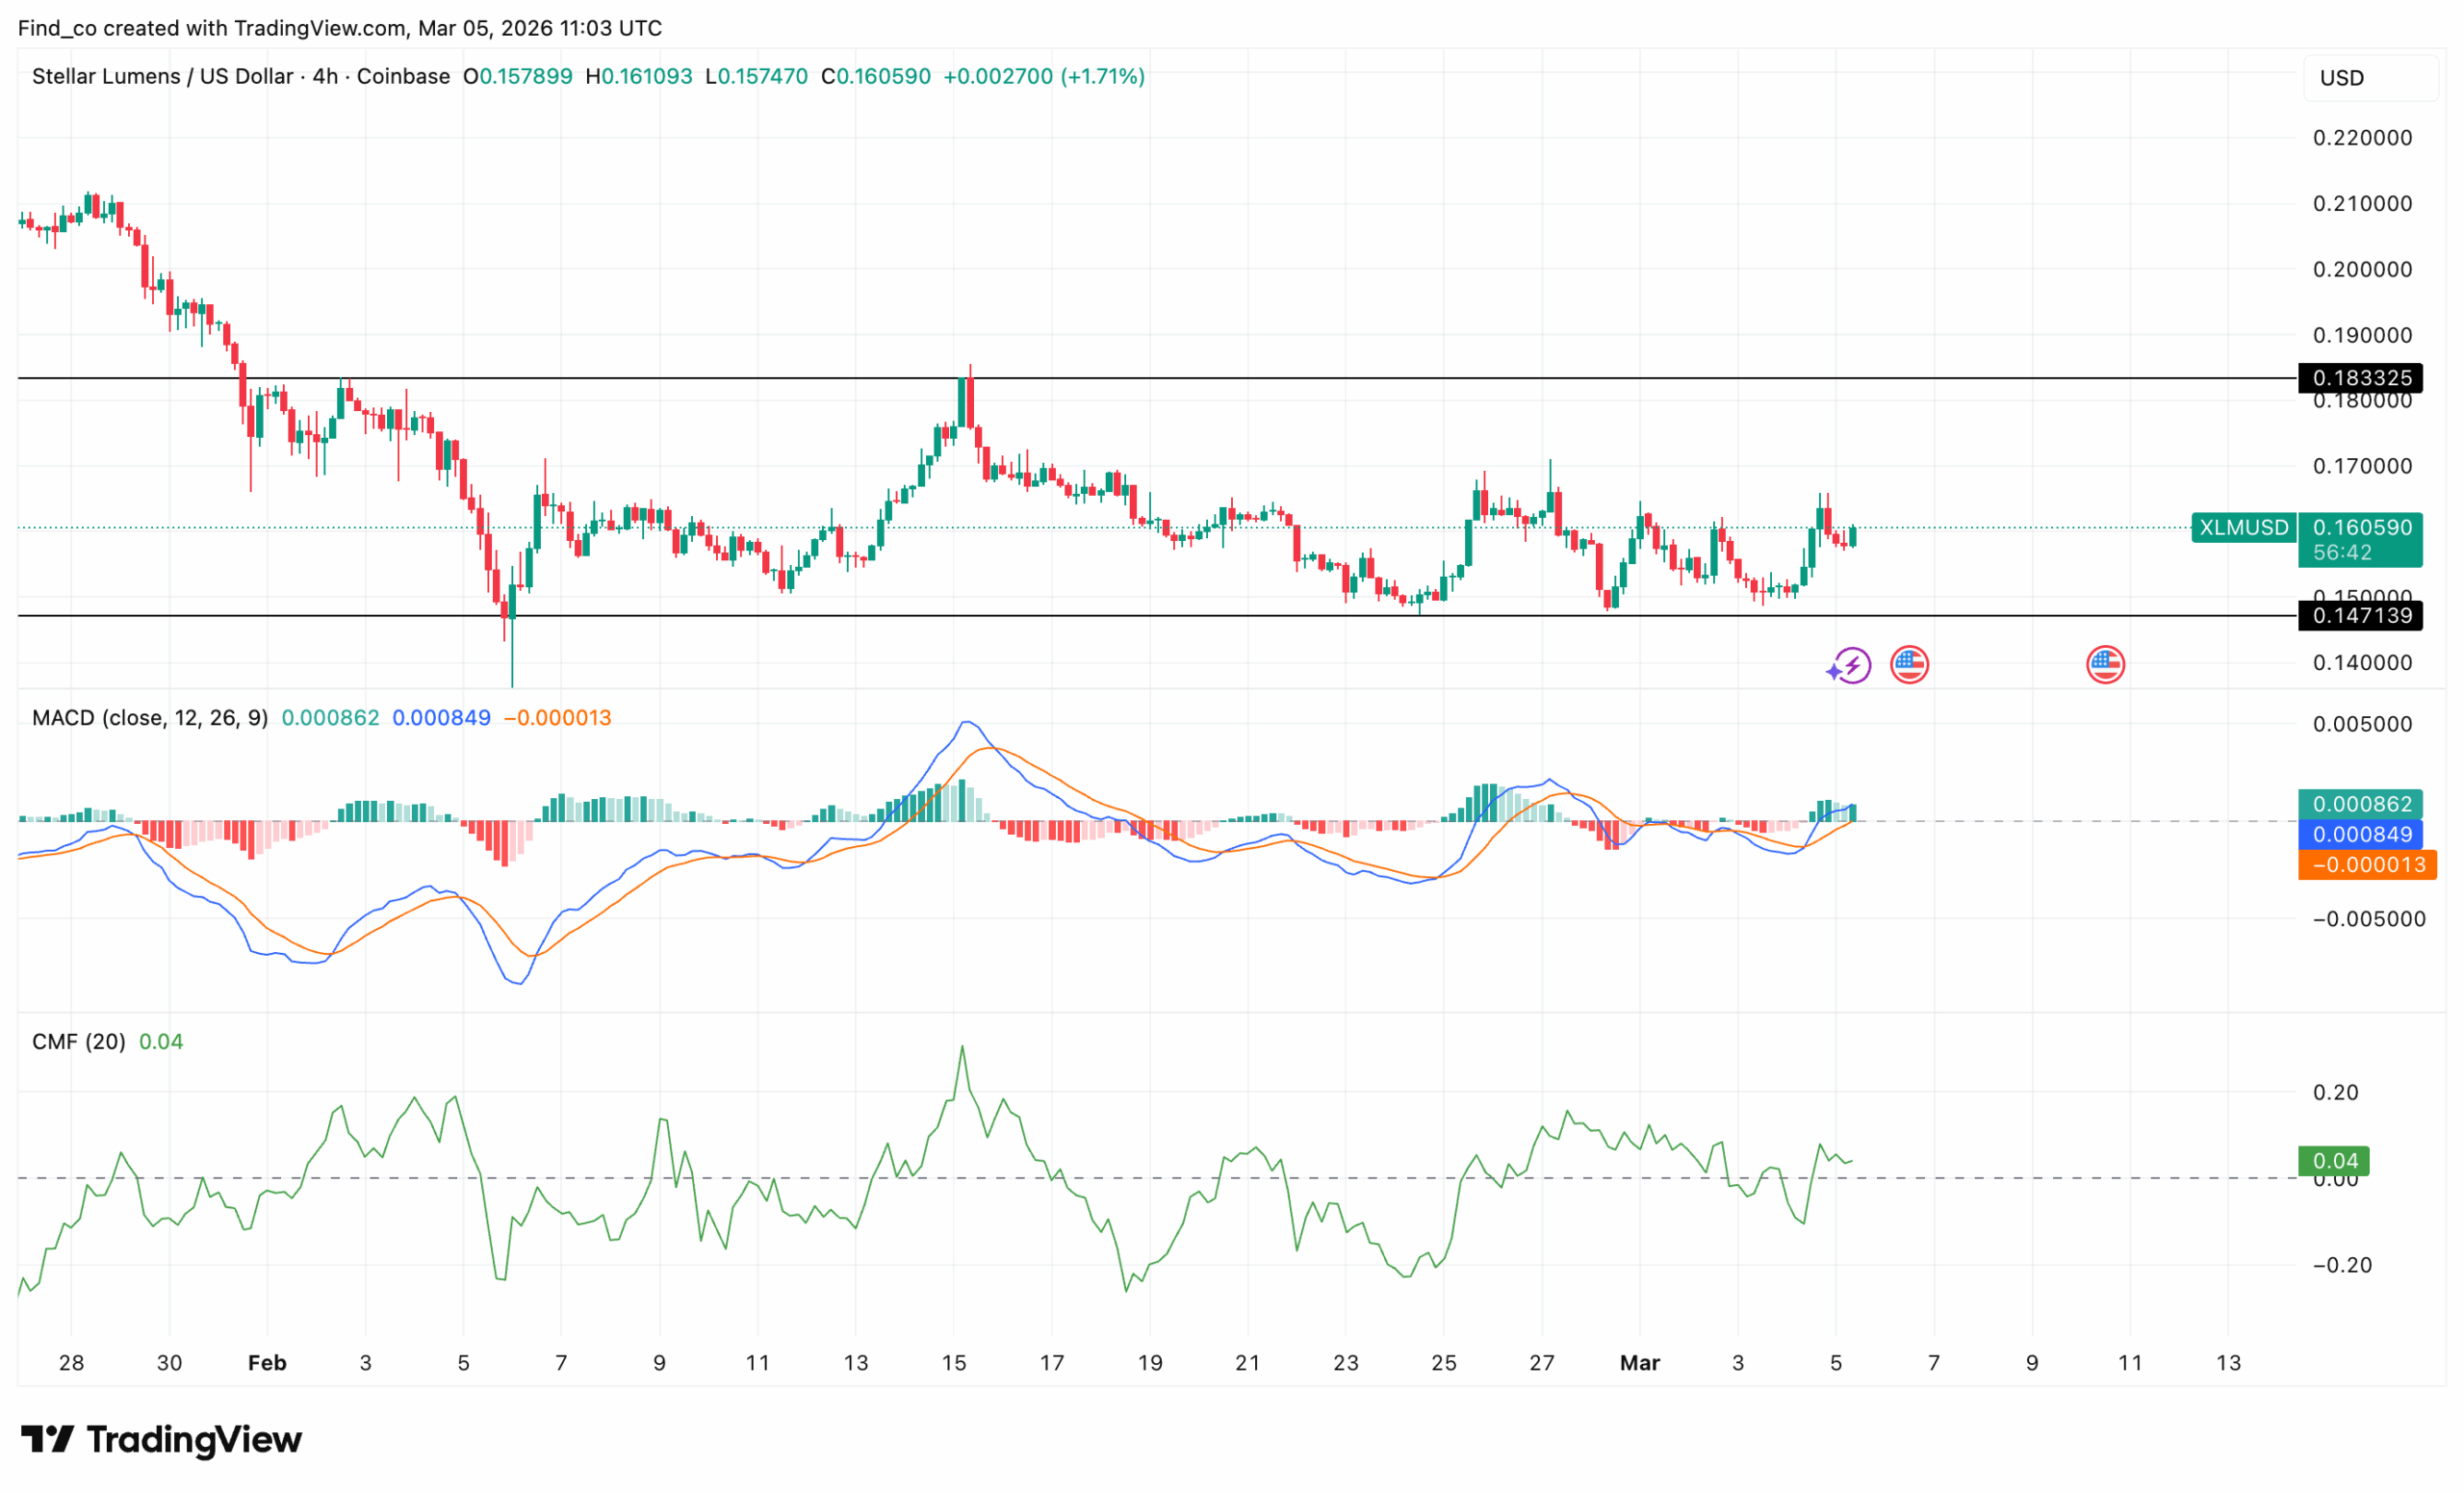
While the broader crypto market is surging, XLM is attempting to build structure above the $0.15 zone.
From the image below, XLM’s price earlier printed a sell-off toward $0.14, prompting buyers to step in.
Get These Top Crypto Casino Offers Now!
Sponsored
Disclosure
We sometimes use affiliate links in our content, when clicking on those we might receive a commission at no extra cost to you. By using this website you agree to our terms and conditions and privacy policy.
That wick marked a local exhaustion low. Since then, the altcoin has formed higher lows, signaling early structural repair.
However, upside momentum remains measured rather than explosive.
The Moving Average Convergence Divergence (MACD) has flipped bullish.
The signal line crossover is now supported by expanding green histogram bars.
Although momentum remains modest, the shift confirms that buyers are regaining short-term control, and as such, XLM’s price might evade another correction.
Meanwhile, the Chaikin Money Flow (CMF) prints 0.03. That reading matters, as a positive CMF typically suggests that capital inflows outweigh outflows.
Still, momentum lacks breakout intensity. Therefore, bulls must defend current levels to sustain upside pressure.
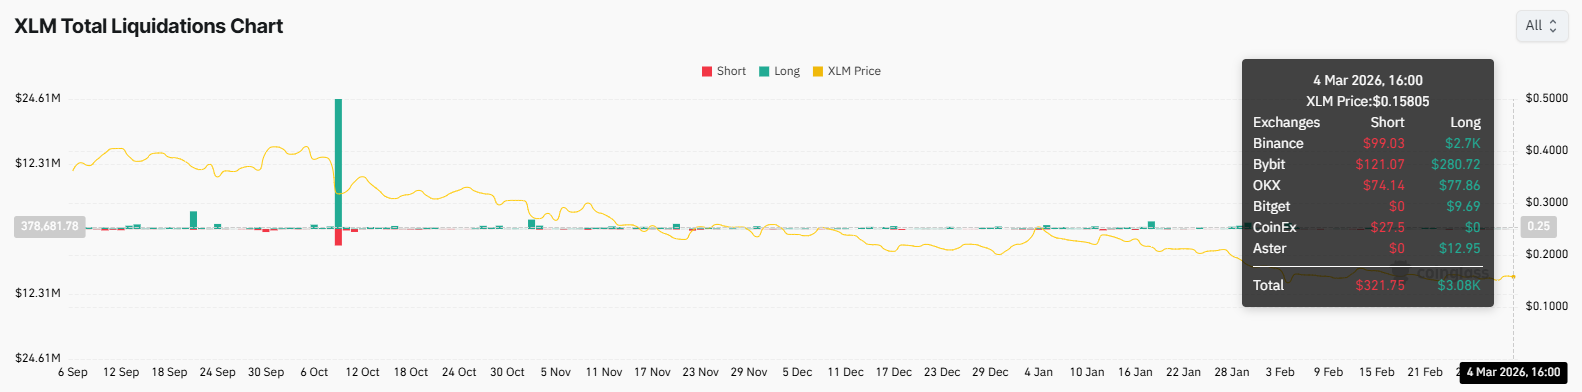
Liquidation Trends Favor Bulls
On-chain charts show a subtle shift in XLM sentiment.
Funding rates have turned positive, rising 0.0076%, signaling growing confidence among longs.
The liquidation chart confirms this trend, with total long liquidations ($3.08K) far exceeding shorts ($321.75), indicating sellers are more exposed at current levels.
Overall, these signs point to steady accumulation, supporting a potential push toward $0.25.
So, if buyers hold the key support around $0.15, XLM’s price might trade much higher in the short term.
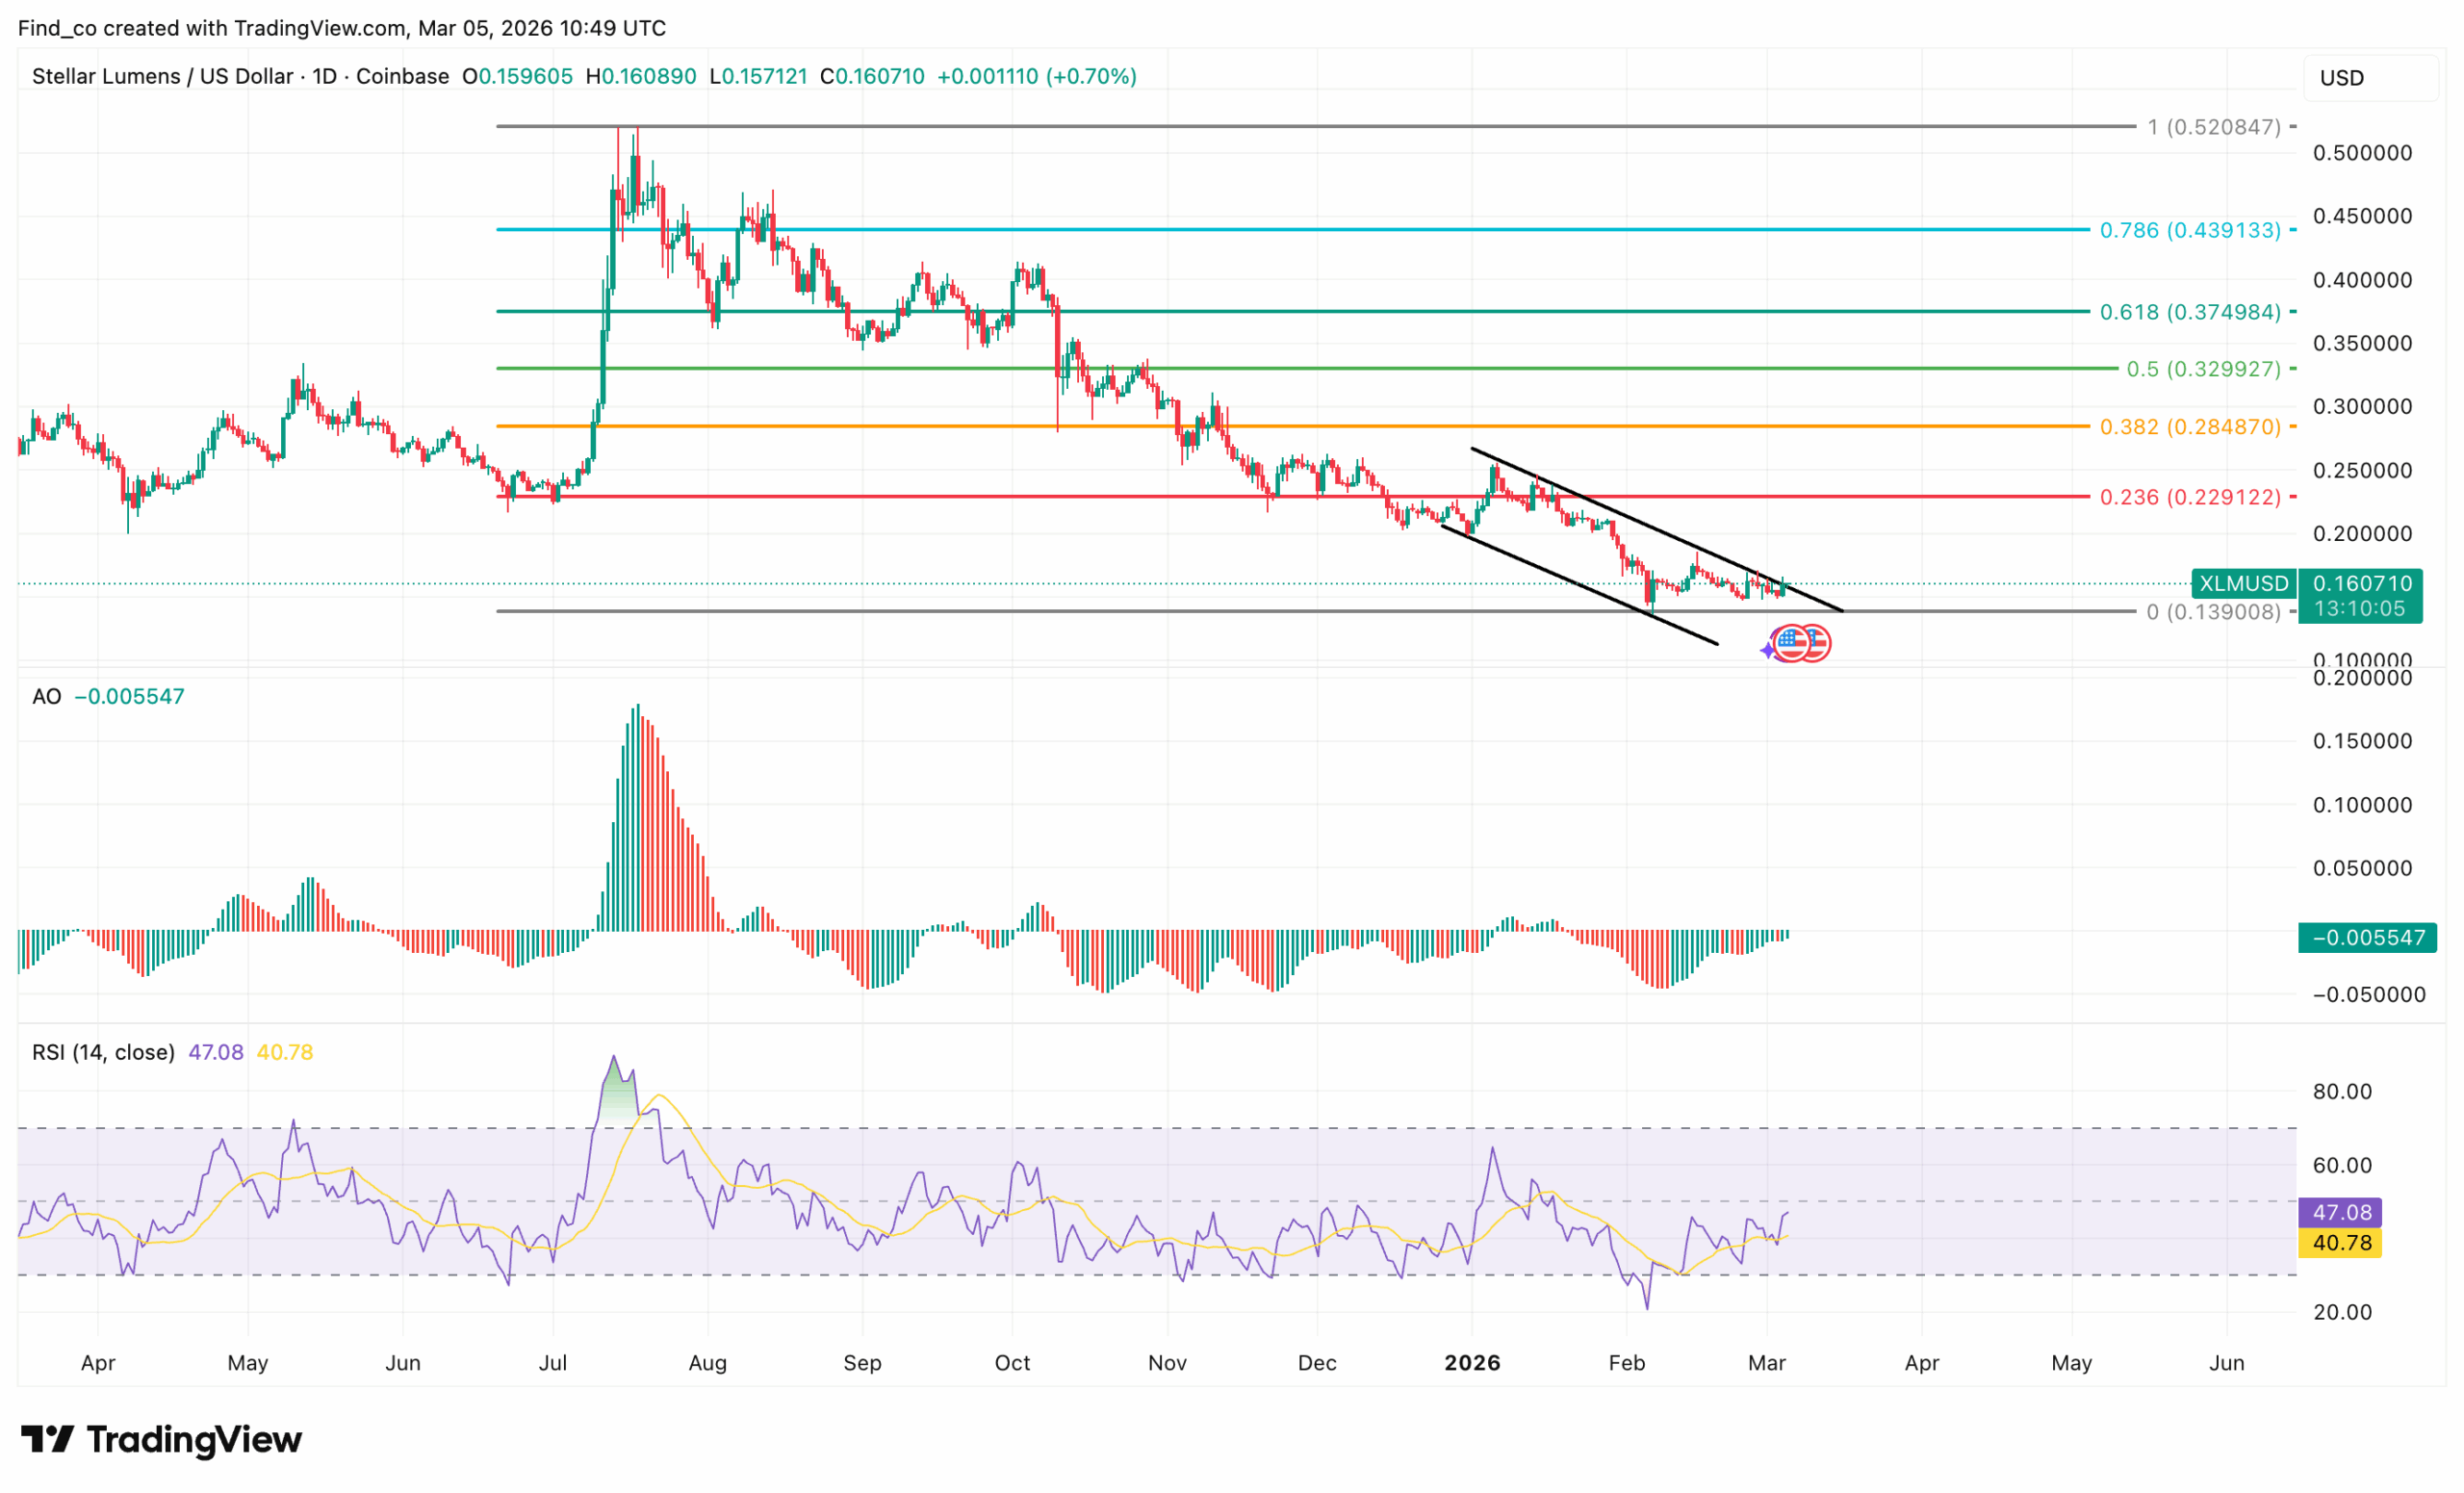
XLM Price Outlook: Bears Remain
On the daily timeframe, XLM is still trading within a clear descending channel, and the broader structure remains bearish.
Price is hovering around $0.16 after reacting from the $0.14 support zone, which marks the zero Fibonacci baseline.
That level produced a bounce, but it has not altered the larger trend. The altcoin is still printing lower highs, and the latest rejection from the channel’s upper boundary reinforces that sellers remain in control.
Market indicators mirror that same restraint. For instance, the Awesome Oscillator (AO) has started printing green histogram bars in negative territory, indicating that downside pressure has eased but not disappeared.
The Relative Strength Index (RSI) is near 44, below the neutral 50 threshold, signaling a recovery from oversold conditions but not confirming bullish strength.
Disclaimer:
The information provided in this article is for informational purposes only. It is not intended to be, nor should it be construed as, financial advice. We do not make any warranties regarding the completeness, reliability, or accuracy of this information. All investments involve risk, and past performance does not guarantee future results. We recommend consulting a financial advisor before making any investment decisions.
Victor Olanrewaju is a crypto analyst and reporter at CCN with deep roots in on-chain research and technical analysis. His crypto journey began in 2017, but it was the 2020 Uniswap airdrop that sparked a full-time pivot into the space.
With a foundation in copywriting, Victor honed his craft creating high-converting content for leading crypto brokers — most notably an XRP price prediction that ranked #1 on Google during the 2021 bull run.
He later joined AMBCrypto in 2022, where he combined storytelling with technical and on-chain analysis to cover key market narratives.
In 2024, he expanded his expertise at BeInCrypto, collaborating with analysts and using tools like Glassnode, Santiment, and IntoTheBlock to break down Bitcoin and altcoin trends.
At CCN, Victor covers the top cryptocurrencies, memecoins, macro shifts, blending real-time insights with deep-dive metrics.
He holds a Bachelor’s degree in Physics from the University of Ibadan, equipping him to simplify complex data for a wide audience. Follow his work or connect on LinkedIn or X.