LM can’t reclaim higher Fib levels as sellers keep control | Credit: Hameem Sarwar
Share
Key Takeaways
Stellar’s price is holding $0.20, but momentum still favors sellers.
XLM’s price compression increases the risk of a downside breakout.
Failure to reclaim $0.27 keeps XLM vulnerable to new lows.
Stellar (XLM) has struggled to gain traction in January, with price action locked in a narrow range and upside attempts repeatedly fading.
While the cryptocurrency has so far defended the $0.20 support, the broader structure looks fragile, and momentum continues to tilt toward the downside.
Rather than signaling accumulation, XLM’s recent price action suggests a start in which buyers show little conviction and sellers retain a subtle yet consistent edge.
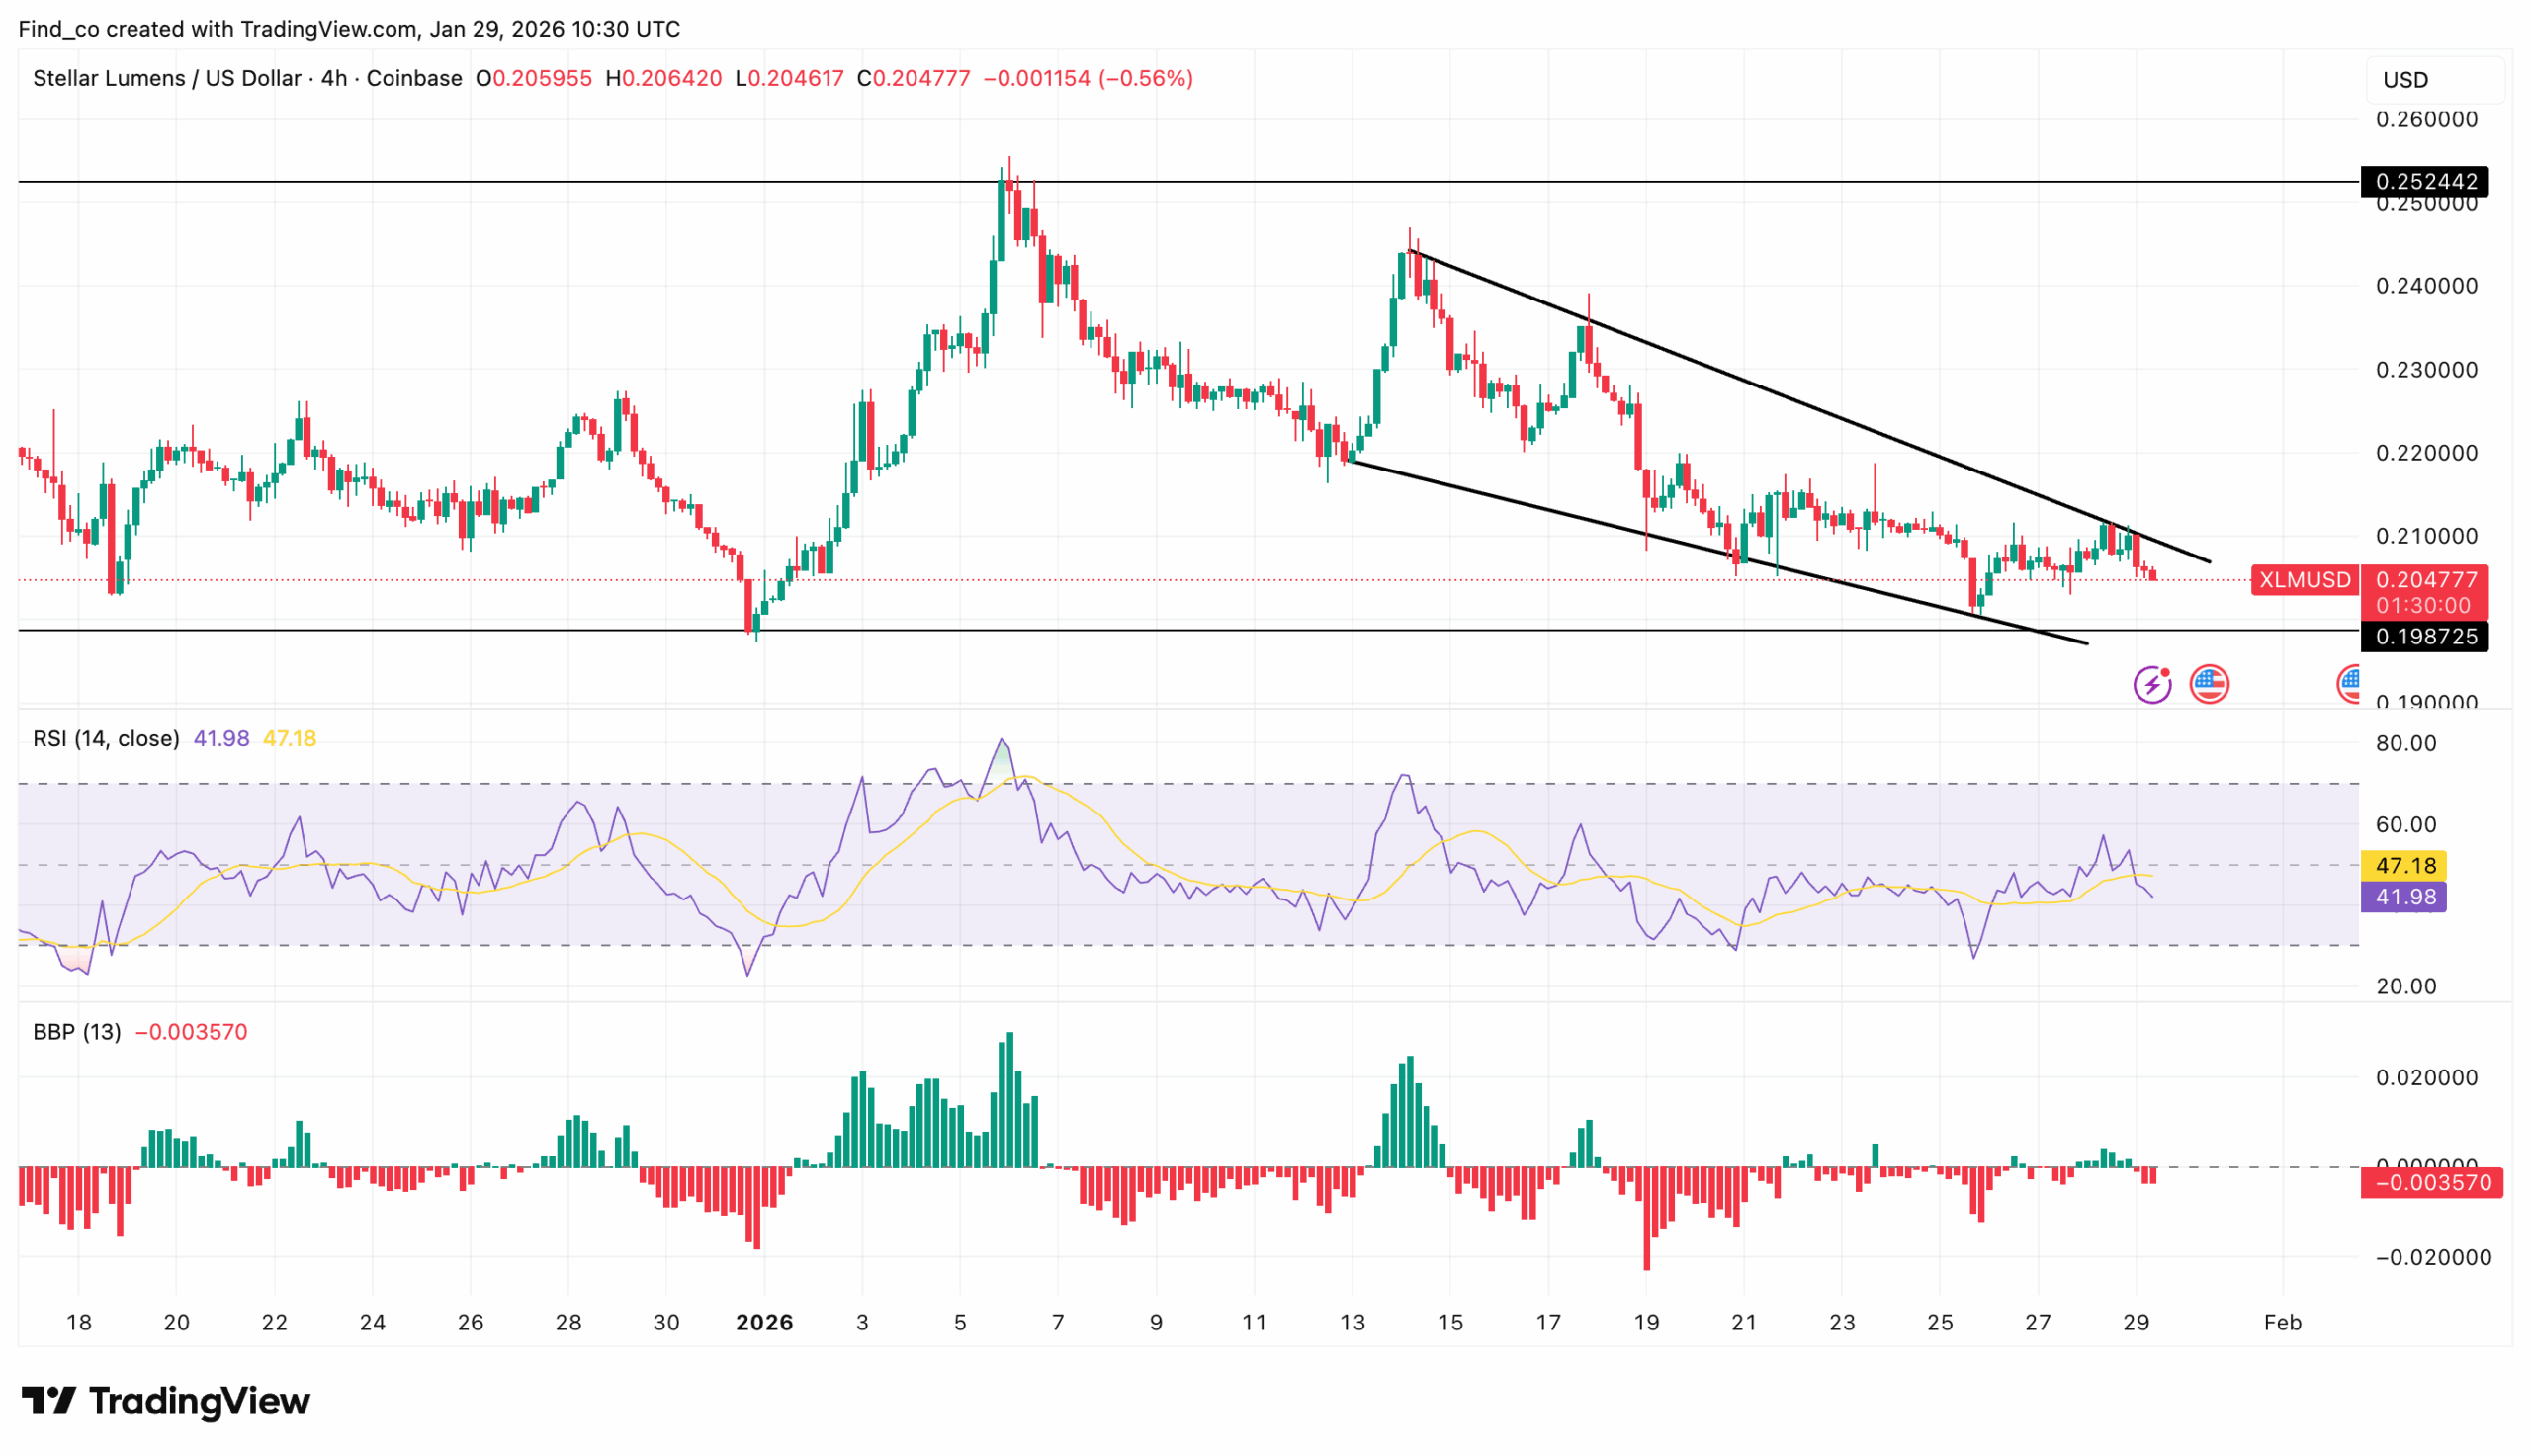
On the 4-hour chart, the Relative Strength Index (RSI) sits at 44.50, below the neutral 50 level and drifting sideways.
This positioning reflects weak bullish conviction, as buyers fail to generate enough strength to shift momentum in their favor.
Get These Top Crypto Casino Offers Now!
Sponsored
Disclosure
We sometimes use affiliate links in our content, when clicking on those we might receive a commission at no extra cost to you. By using this website you agree to our terms and conditions and privacy policy.
Small RSI upticks have faded quickly, reinforcing the view that any bounce so far remains corrective rather than trend-changing.
The Bull Bear Power (BBP) supports this outlook. The indicator continues to print negative values, with red histogram bars gradually expanding, showing that bears still exert more influence than bulls.
Although selling pressure remains muted, the persistent negative BBP keeps downside risk firmly on the table.
From a price-structure perspective, XLM’s price continues to compress between descending trendline resistance and horizontal support near $0.20.
This tightening range raises the probability of a directional breakout. A breakdown below $0.20 could expose the $0.19–$0.18 zone, where buyers previously stepped in.
XLM Price Outlook: Bearish
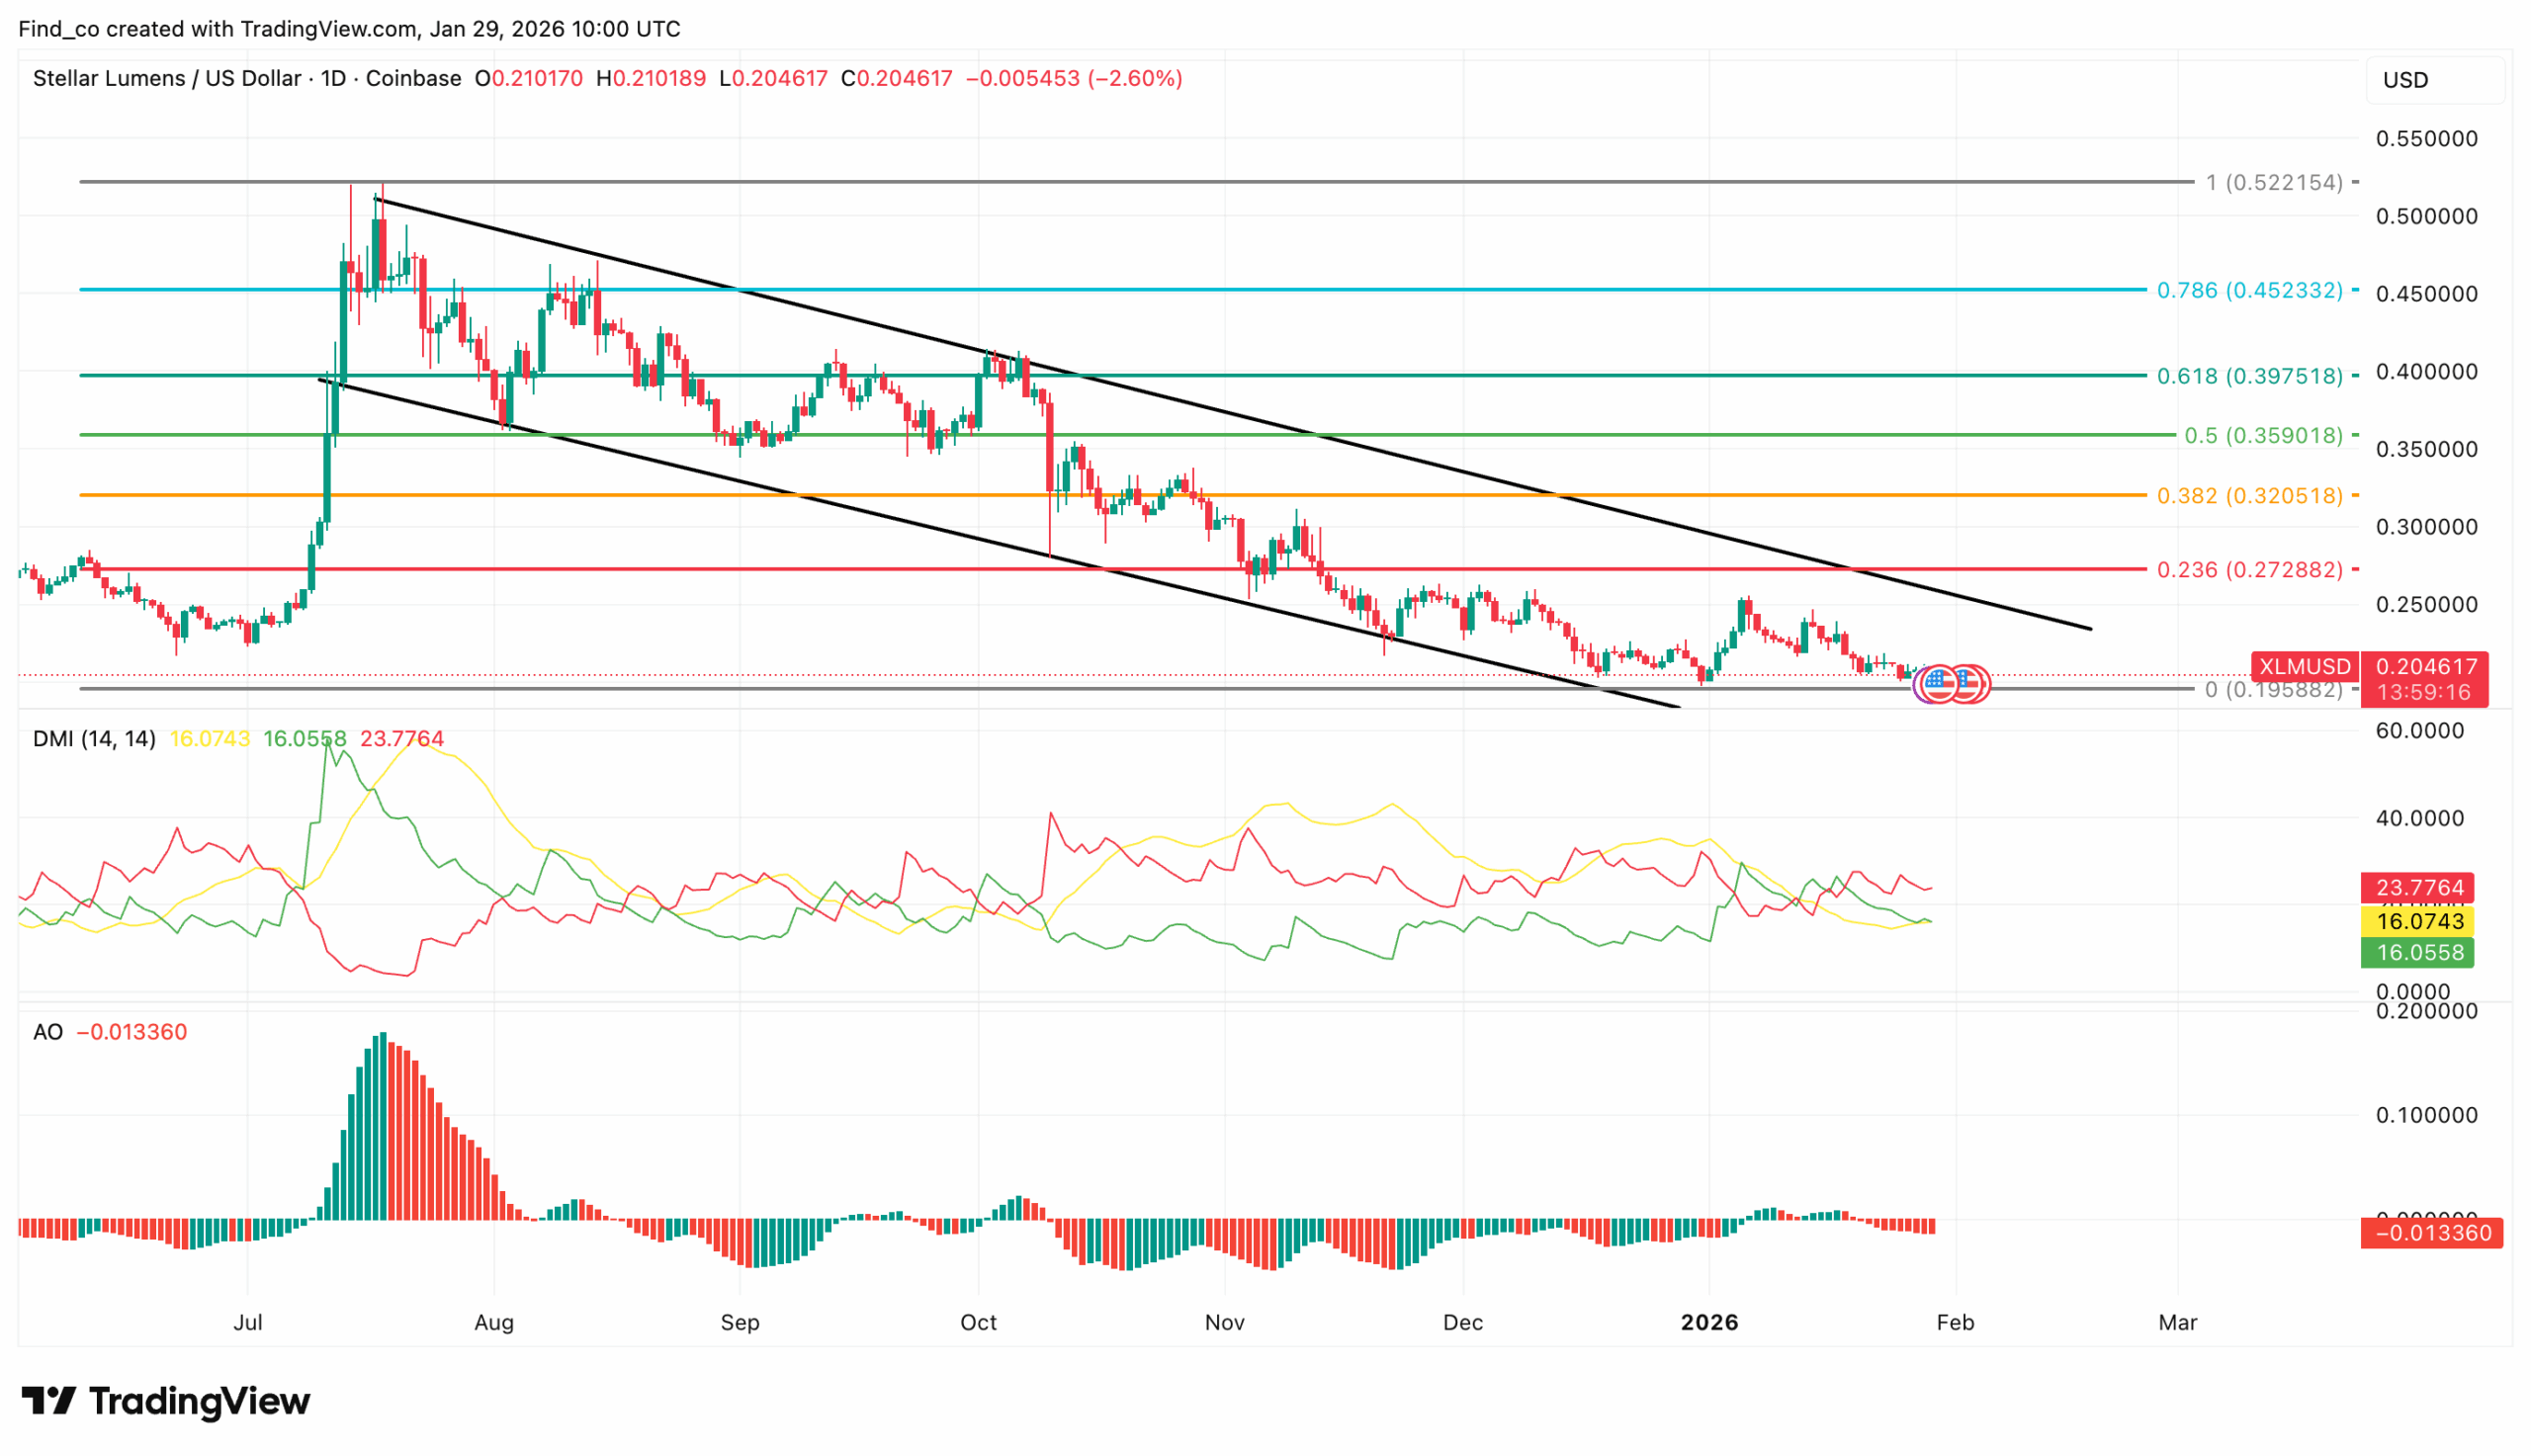
The daily chart shows XLM remains stuck inside its broader descending channel, even as price attempts to stabilize around the $0.20 support zone.
The Directional Movement Index (DMI) places the negative DMI at 23.58 above the positive +DMI at 16.09. This spread highlights a clear bearish advantage, with sellers consistently overpowering buyers whenever XLM attempts a rebound.
The Average Directional Index (ADX) remains above both lines at 23.58, indicating that the current downtrend retains directional strength. This setup implies that Stellar stays vulnerable to further downside unless buyers can force a decisive shift in momentum.
The Awesome Oscillator (AO) strengthens this bias. The indicator continues to print red histogram bars below the zero line, reflecting sustained negative momentum and a lack of bullish follow-through.
Brief upside flips have remained shallow and short-lived, signifying the market’s inability to build a convincing recovery.
At press time, XLM trades at $0.21, aligning closely with the zero Fib level. From a structural standpoint, trading this near the 0 Fibonacci retracement leaves XLM with limited technical breathing room.
The zero Fib often marks the final support in a directional move, and Stellar’s failure to reclaim higher retracement levels signals weak dip-buying conviction.
Disclaimer:
The information provided in this article is for informational purposes only. It is not intended to be, nor should it be construed as, financial advice. We do not make any warranties regarding the completeness, reliability, or accuracy of this information. All investments involve risk, and past performance does not guarantee future results. We recommend consulting a financial advisor before making any investment decisions.
Victor Olanrewaju is a crypto analyst and reporter at CCN with deep roots in on-chain research and technical analysis. His crypto journey began in 2017, but it was the 2020 Uniswap airdrop that sparked a full-time pivot into the space.
With a foundation in copywriting, Victor honed his craft creating high-converting content for leading crypto brokers — most notably an XRP price prediction that ranked #1 on Google during the 2021 bull run.
He later joined AMBCrypto in 2022, where he combined storytelling with technical and on-chain analysis to cover key market narratives.
In 2024, he expanded his expertise at BeInCrypto, collaborating with analysts and using tools like Glassnode, Santiment, and IntoTheBlock to break down Bitcoin and altcoin trends.
At CCN, Victor covers the top cryptocurrencies, memecoins, macro shifts, blending real-time insights with deep-dive metrics.
He holds a Bachelor’s degree in Physics from the University of Ibadan, equipping him to simplify complex data for a wide audience. Follow his work or connect on LinkedIn or X.