Is POWER headed to zero? | Credit: Veronica Cestari
Share
Key Takeaways
POWER suffered a catastrophic 90.25% collapse following reports of a temporary disruption to the Ronin Bridge.
On-chain data reveals massive distribution, with circulation exploding to 10.7 million and active addresses surging.
Immediate support is nonexistent above $0.12, while every former support level has flipped to overhead resistance.
In one of the most brutal single-event collapses seen in the altcoin market this year, Power Protocol’s native token, POWER, has shed approximately 90% of its value.
This happened following a reported temporary pause on the Ronin Bridge. With a significant token unlock scheduled for March 5, the pain may not be over yet.
Here is how it happened and what lies ahead for the POWER token.
What Happened to Power Protocol Token?
The decline traces directly back to a disruption on the Ronin Bridge, the cross-chain infrastructure that connects the Ronin Network to other blockchain ecosystems.
When the bridge reportedly halted temporarily, it created a critical imbalance. This imbalance led to a significant price gap opening between on-chain decentralized markets and centralized exchanges where POWER was also trading.
In crypto markets, these price discrepancies can trigger a dangerous cascade.
Get These Top Crypto Casino Offers Now!
Sponsored
Disclosure
We sometimes use affiliate links in our content, when clicking on those we might receive a commission at no extra cost to you. By using this website you agree to our terms and conditions and privacy policy.
Arbitrage traders, liquidation bots, and panic sellers all move simultaneously, flooding on-chain liquidity pools with sell pressure that some tokens simply cannot absorb.
For the POWER token, the result was catastrophic—a near-total collapse in token value.
However, this isn’t the first time Ronin has been at the center of a major crypto event.
For those unfamiliar, the network suffered a notable $625 million hack in 2022. Since then, any disruption to its infrastructure, however brief, now carries outsized psychological weight for assets linked to the ecosystem.
$2.80 to $0.18
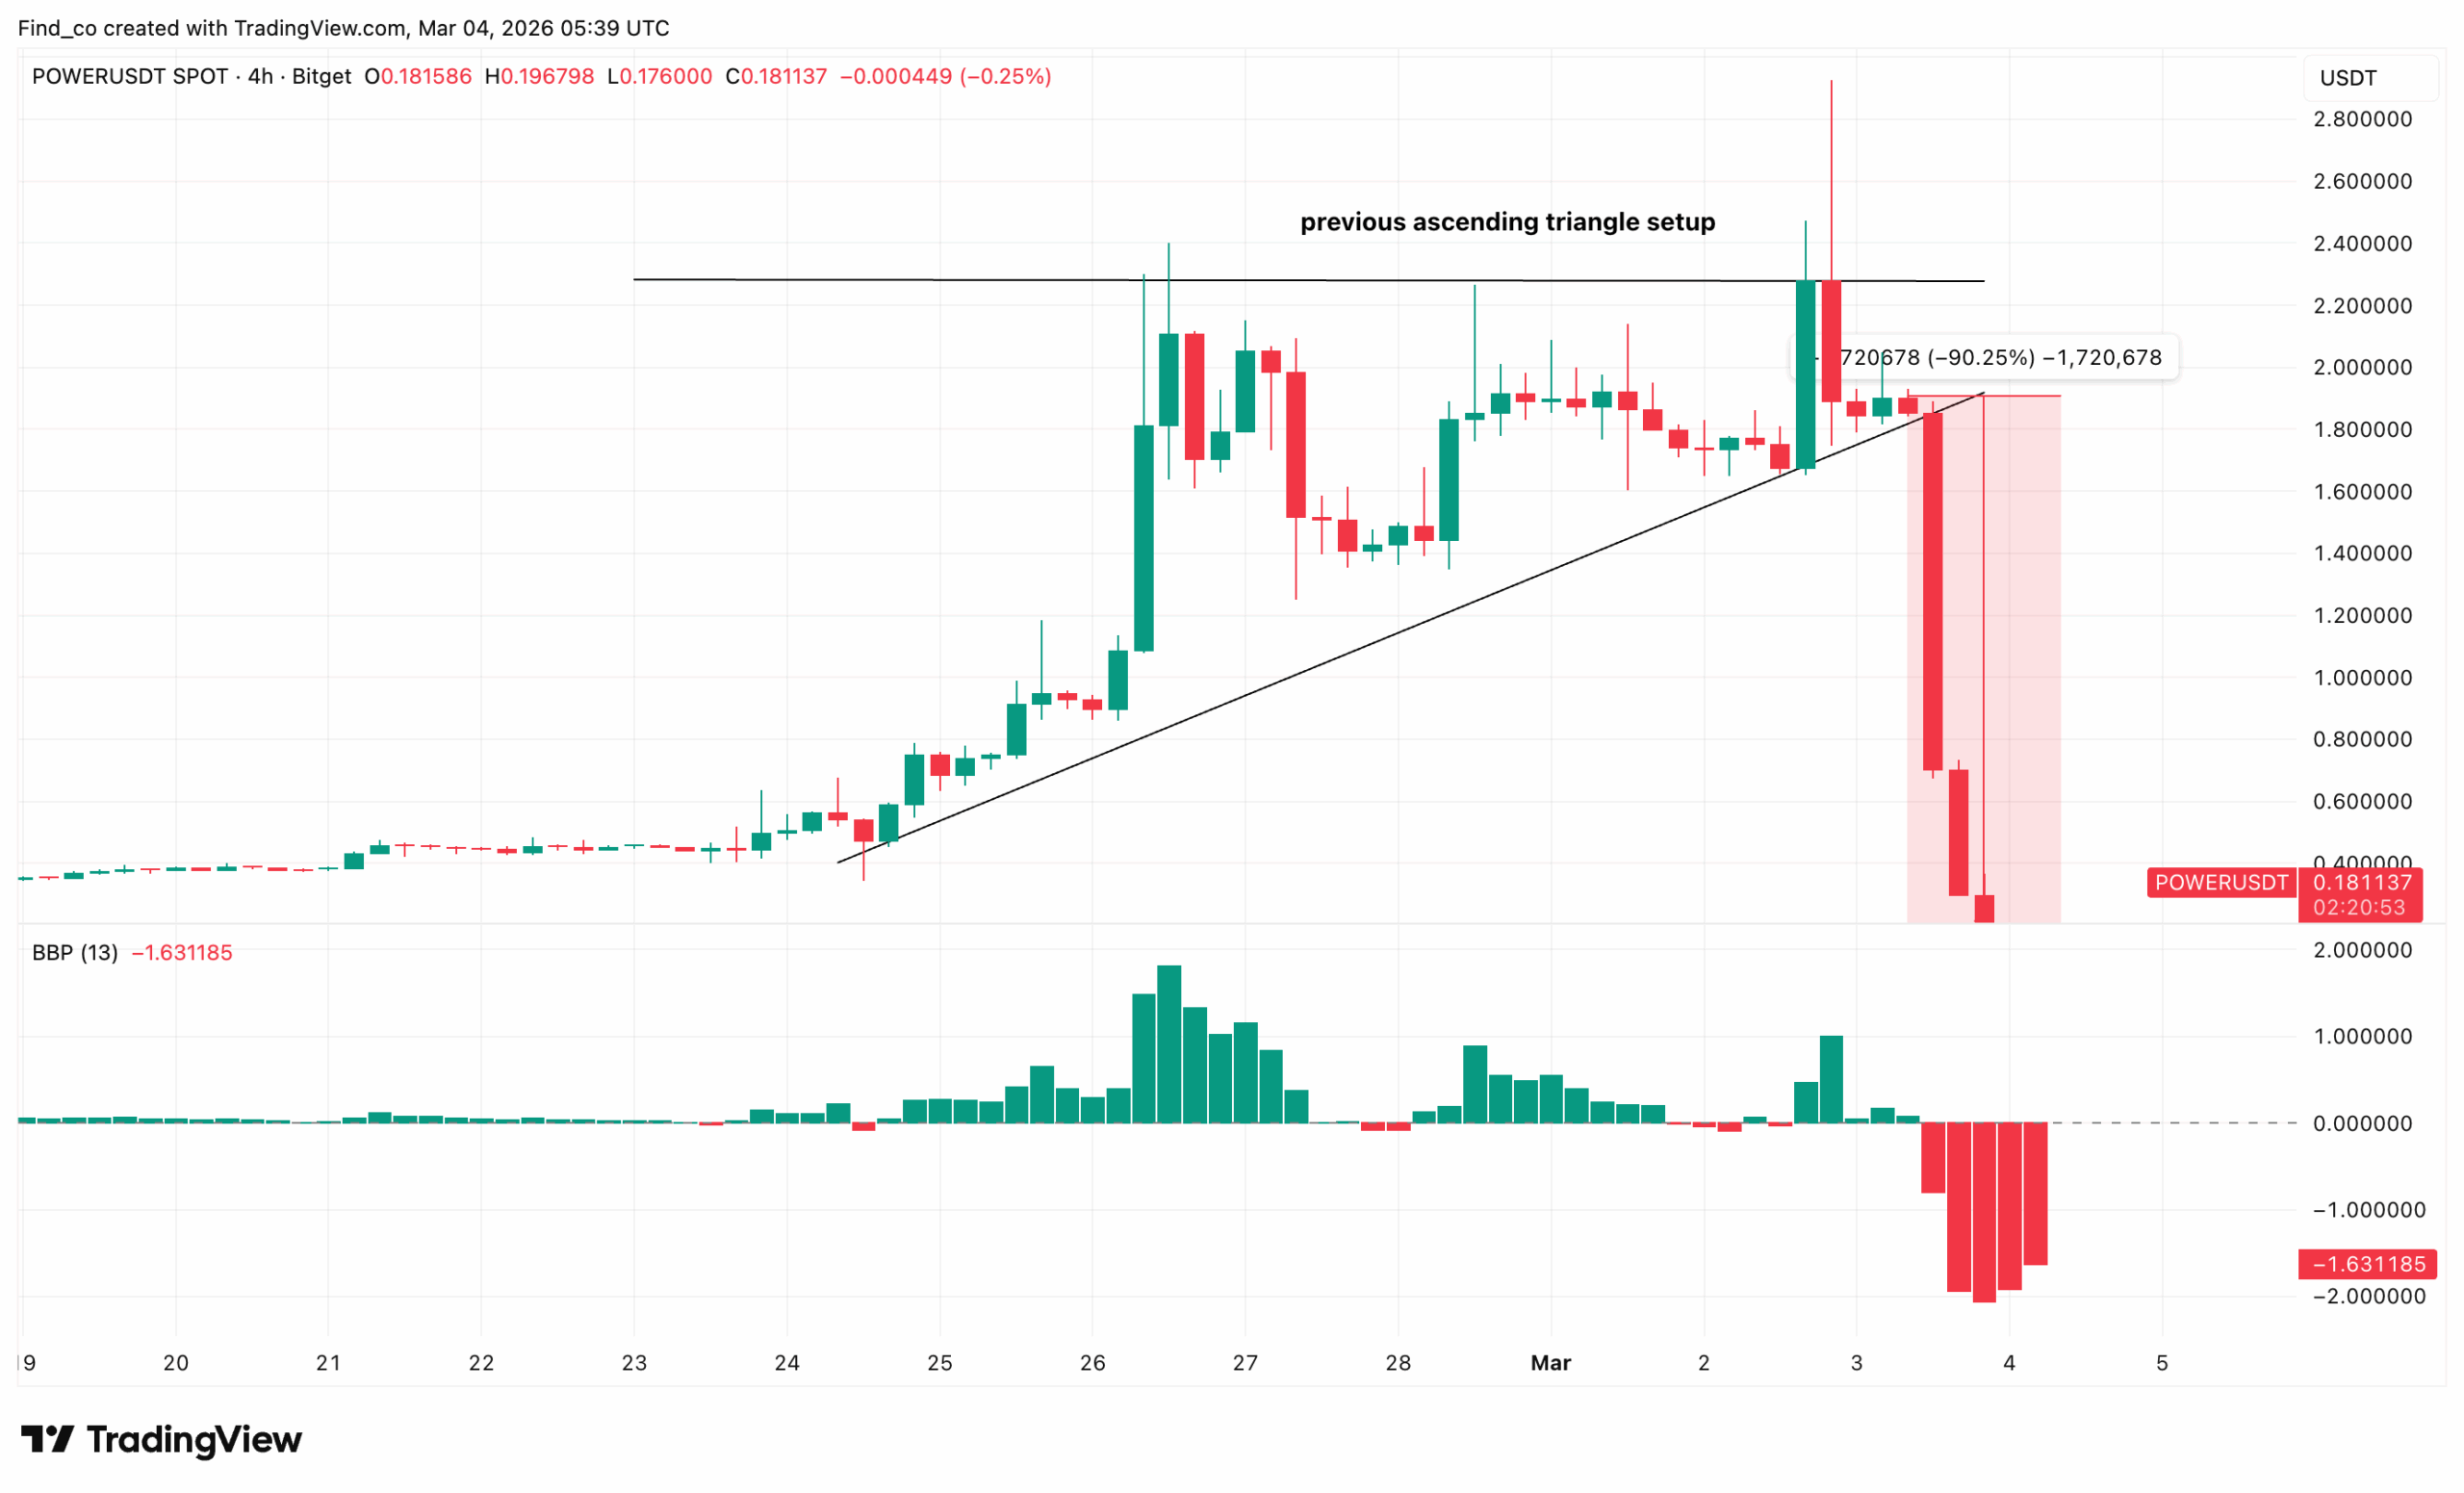
From a technical perspective, CCN observed that the ascending triangle failed on the 4-hour chart.
At the time of writing, the POWER token trades at $0.18, but that figure masks the full extent of the destruction.
The token peaked near $2.40 on March 3, then collapsed by 90.25% over the next few hours, bottoming near $0.17 before a partial recovery.
As shown below, the setup looked constructive. A textbook ascending triangle formed between February 24 and March 3, with flat resistance at $2.20 and a rising support trendline that has been building higher lows from $0.50.
The pattern broke upward, spiking to $2.80 before reversing with extreme violence. That spike above resistance was a fake-out — a classic bull trap that liquidated anyone who chased the breakout.
The Bull Bear Power indicator (BBP) confirms the severity. BBP sits at -1.631, indicating that bearish power is overwhelming.
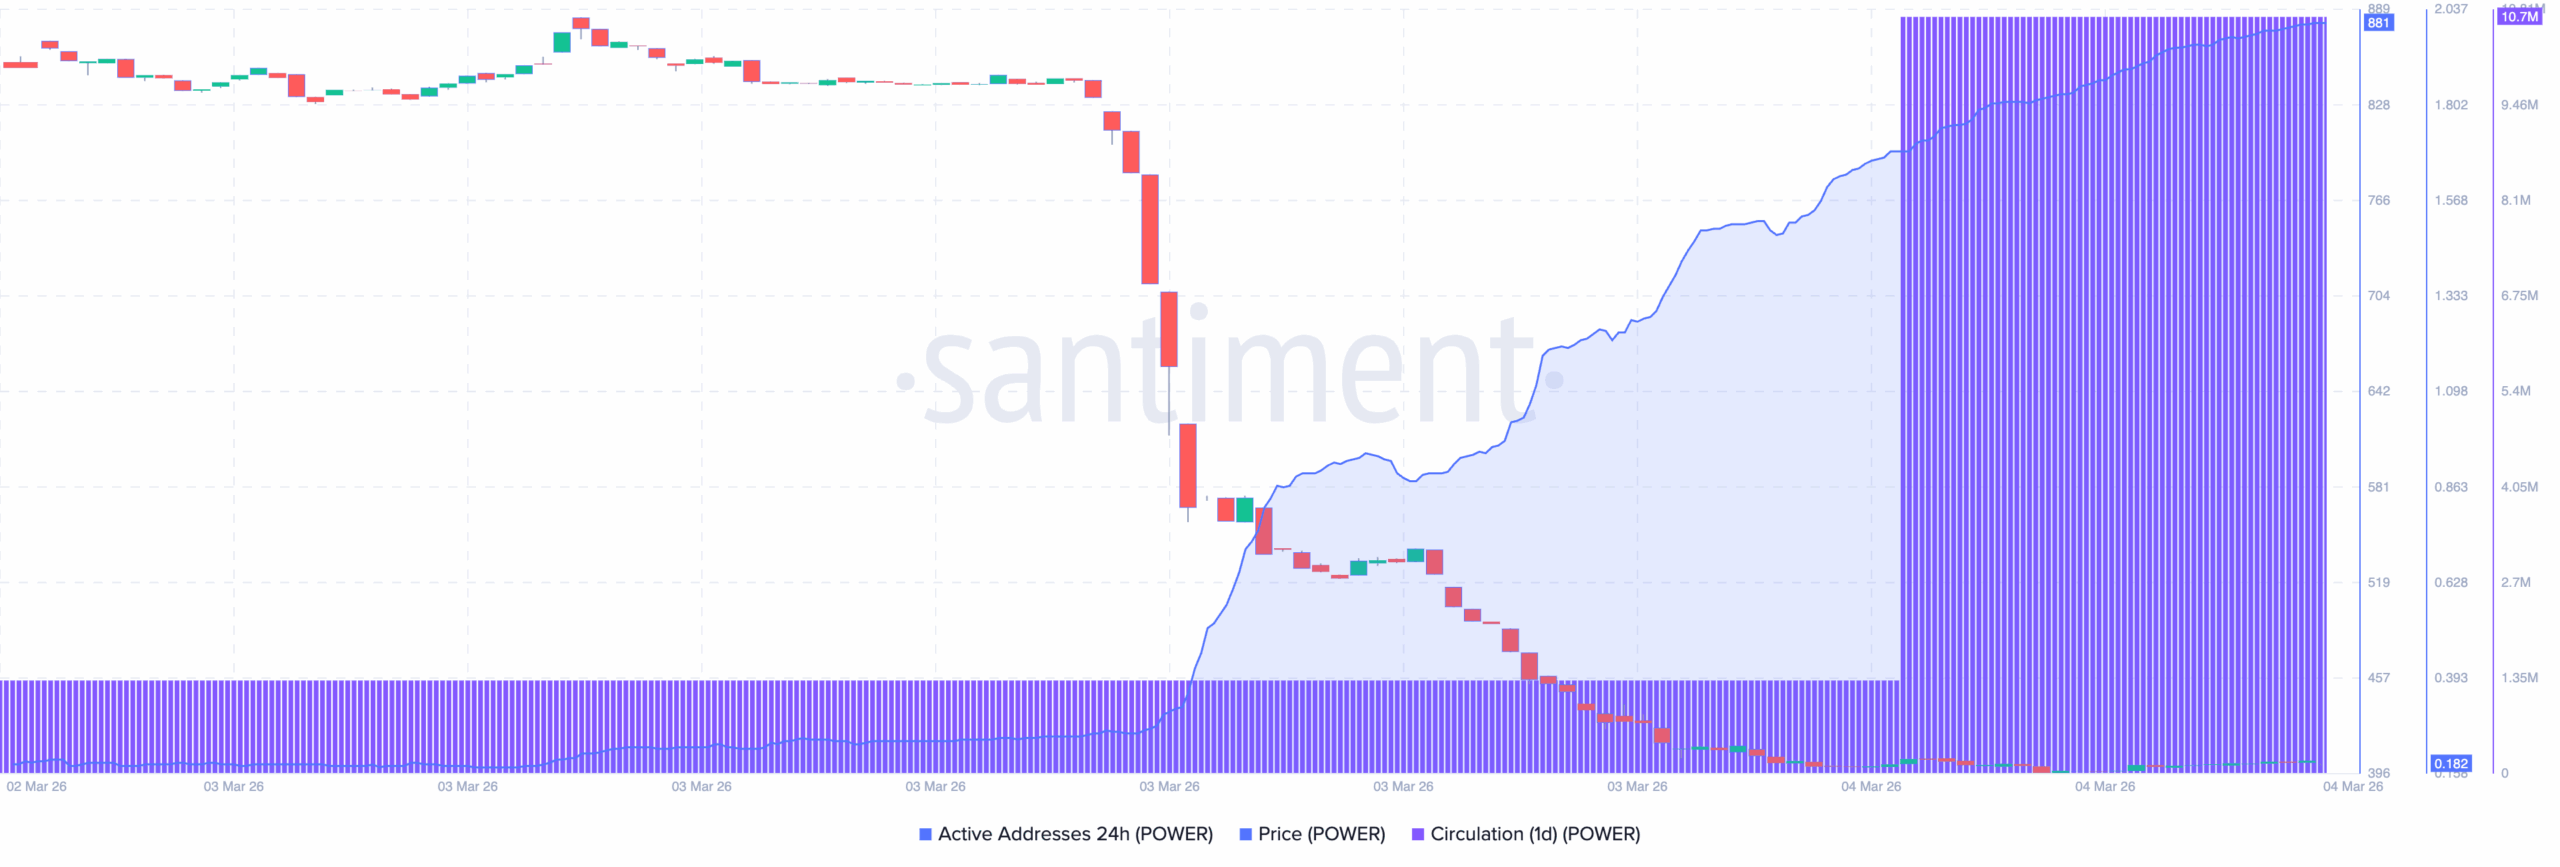
While the POWER token has collapsed, Santiment data suggests the decline could continue.
First, the Circulation (one-day) metric, which measures the number of tokens moving on-chain over a 24-hour period, has exploded to 10.7 million.
This means that an enormous quantity of previously dormant tokens were moved and sold into the rally at the top. So, several long-term holders massively distributed into the pump, adding to the downward pressure.
Active addresses are followed immediately after. From near zero throughout February, active addresses surged to 881 at the peak.
POWER Active Addresses and Circulation | Credit: Santiment
The spike in participation was sellers rushing in on the breakdown. By the look of things, POWER might not experience respite soon, especially if these metrics remain elevated as the price drops.
POWER Price Prediction
What makes POWER’s situation particularly precarious is the timing. A scheduled token unlock on March 5 is set to release additional POWER supply into an altcoin that is already deeply wounded.
Typically, token unlocks introduce a fresh circulating supply. So, whenever holders’ confidence is already shaken, newly unlocked tokens often trigger immediate sell pressure.
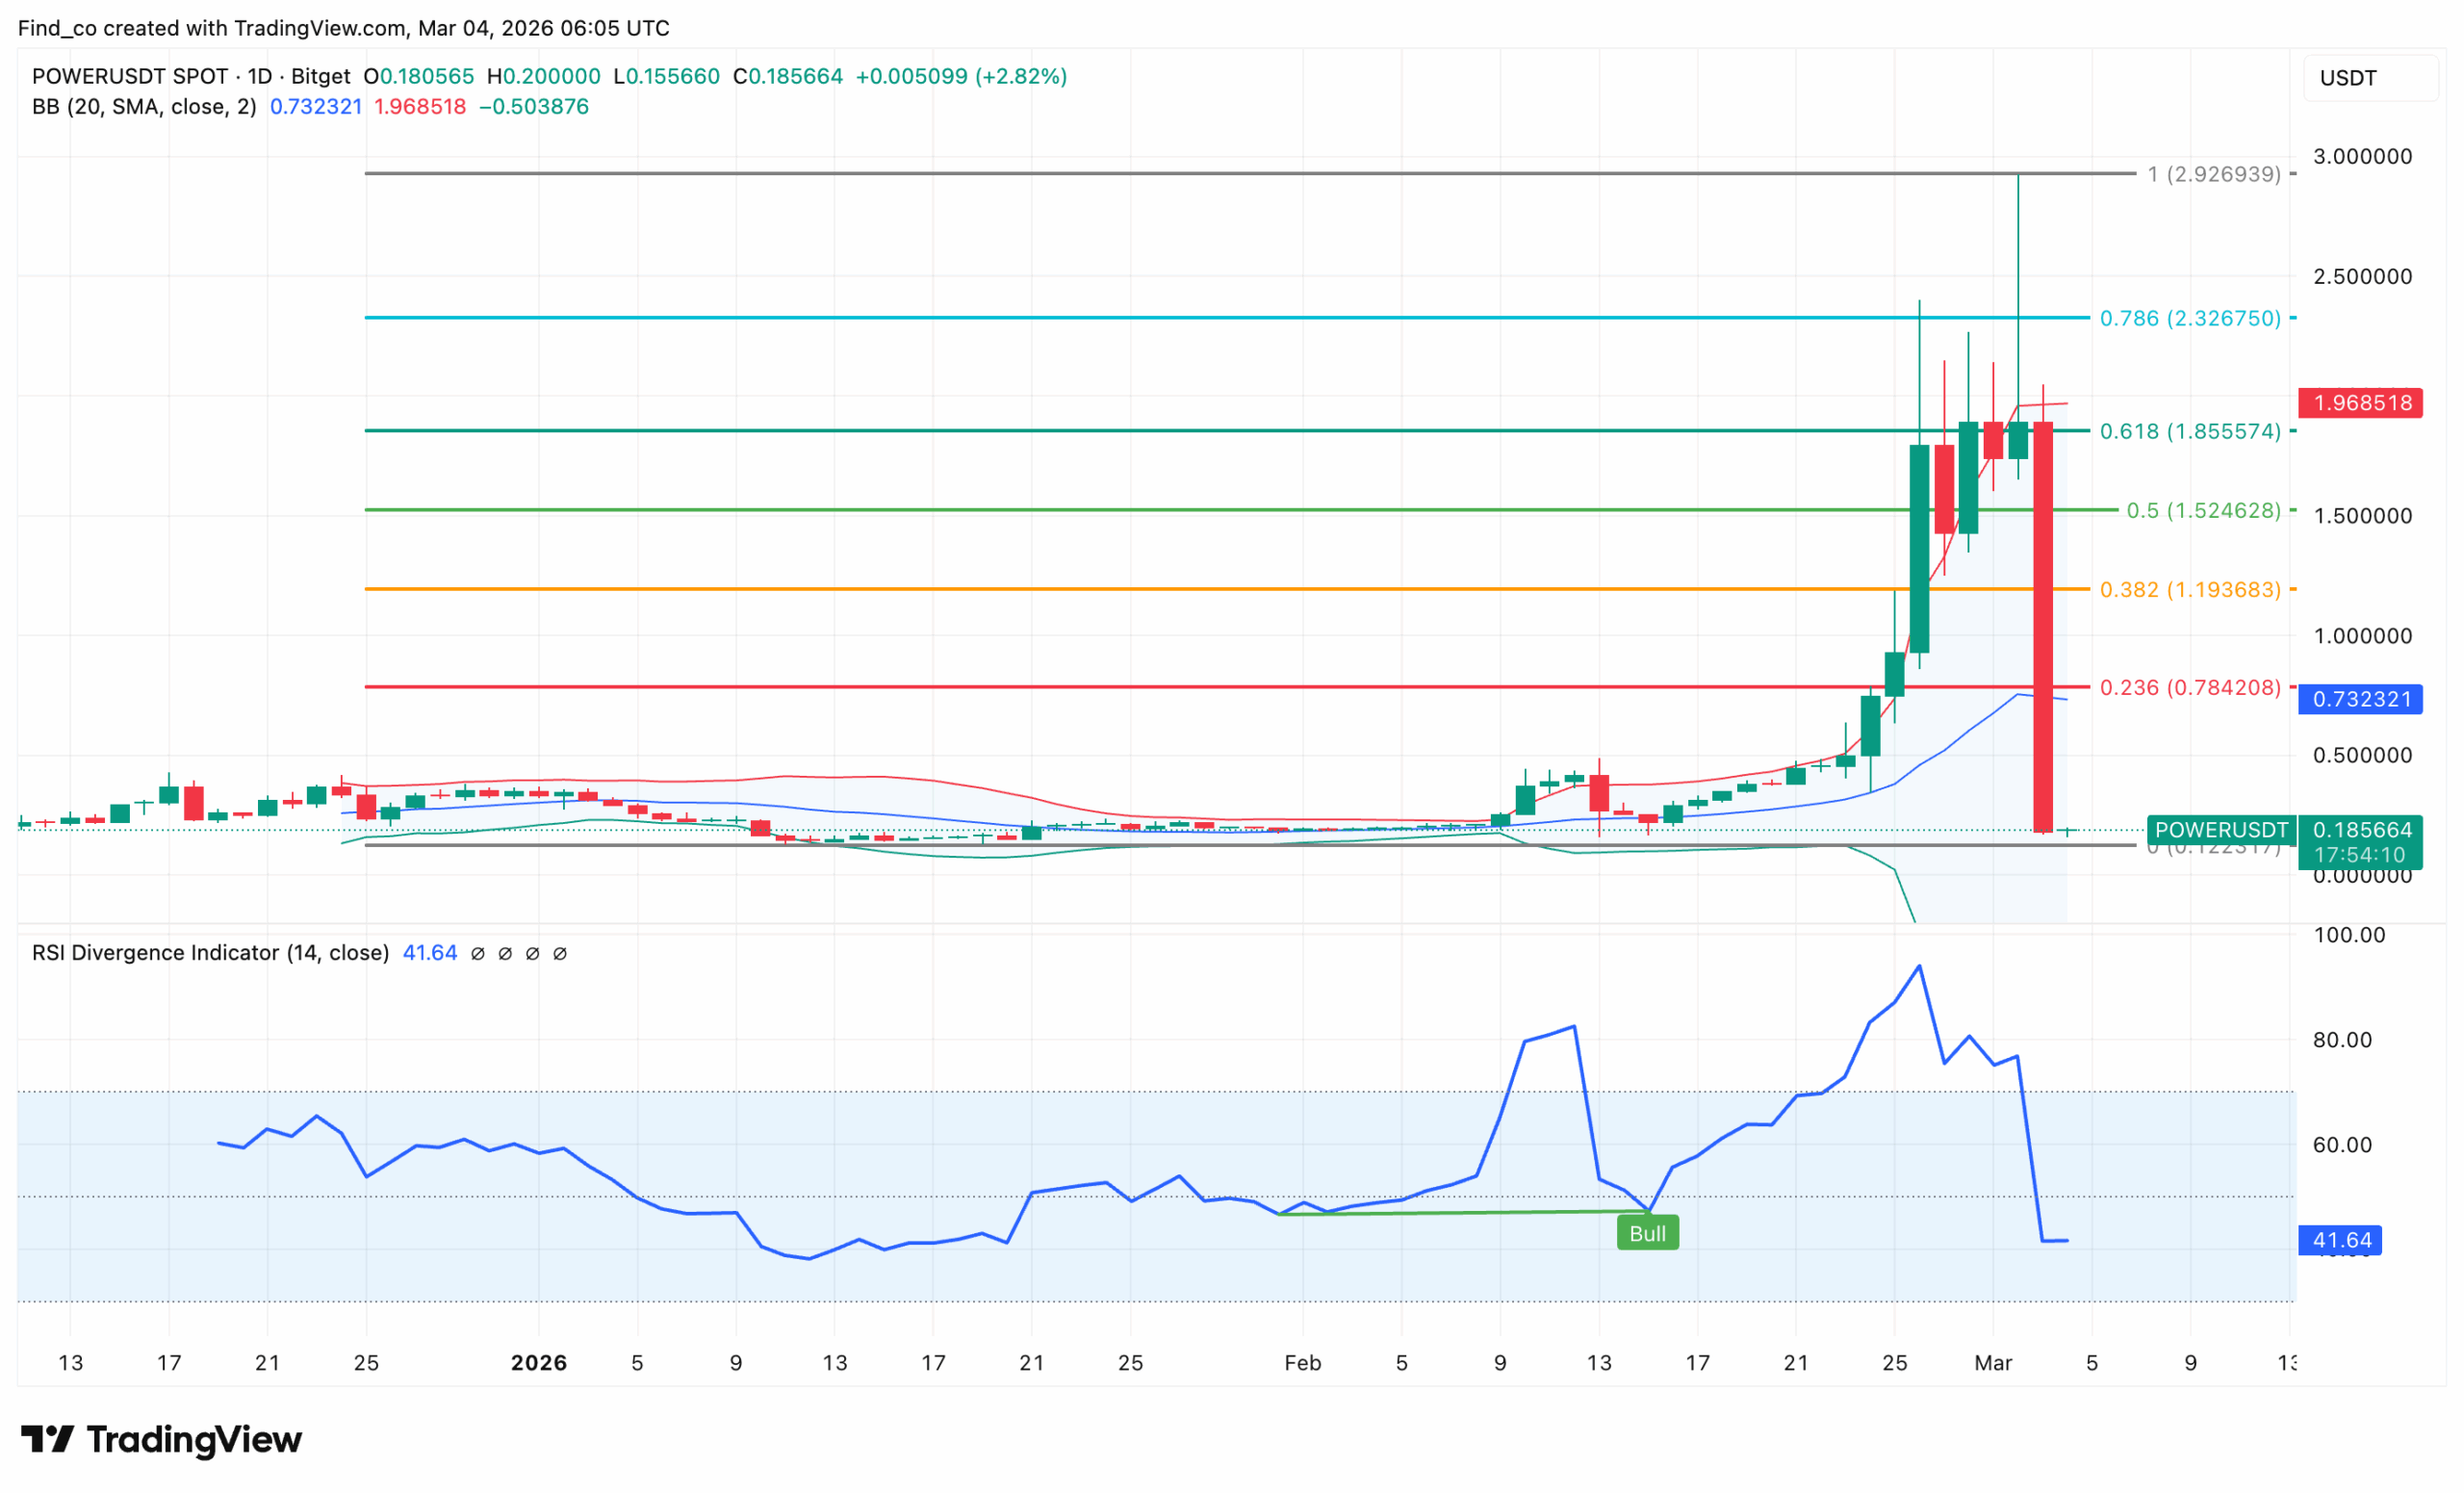
Furthermore, a look at the daily chart does not make it better.
As shown below, POWER’s price has risen a bit, but it is most likely a dead-cat bounce.
The Bollinger Bands (BB) add stark context to the story. The upper band is at $1.97, while the middle band is at $0.73, indicating extreme volatility in the altcoin.
In addition, the RSI Divergence indicator is a critical context. A Bull divergence signal fired in mid-February, and it was correct, preceding the rally from $0.30 to $2.93.
But RSI has now crashed from 80+ to 41.64 within a few hours. That kind of collapse without a corresponding price base is the signature of an extended correction.
As it stands, there is no technical support between the current price and the zero Fib at $0.12. Every Fibonacci level — 0.236 ($0.784), 0.382 ($1.194), 0.5 ($1.525), 0.618 ($1.856) — is now overhead resistance.
Therefore, recovery requires reclaiming at least $0.78. Otherwise, nothing below that level merits bullish consideration.
Disclaimer:
The information provided in this article is for informational purposes only. It is not intended to be, nor should it be construed as, financial advice. We do not make any warranties regarding the completeness, reliability, or accuracy of this information. All investments involve risk, and past performance does not guarantee future results. We recommend consulting a financial advisor before making any investment decisions.
Victor Olanrewaju is a crypto analyst and reporter at CCN with deep roots in on-chain research and technical analysis. His crypto journey began in 2017, but it was the 2020 Uniswap airdrop that sparked a full-time pivot into the space.
With a foundation in copywriting, Victor honed his craft creating high-converting content for leading crypto brokers — most notably an XRP price prediction that ranked #1 on Google during the 2021 bull run.
He later joined AMBCrypto in 2022, where he combined storytelling with technical and on-chain analysis to cover key market narratives.
In 2024, he expanded his expertise at BeInCrypto, collaborating with analysts and using tools like Glassnode, Santiment, and IntoTheBlock to break down Bitcoin and altcoin trends.
At CCN, Victor covers the top cryptocurrencies, memecoins, macro shifts, blending real-time insights with deep-dive metrics.
He holds a Bachelor’s degree in Physics from the University of Ibadan, equipping him to simplify complex data for a wide audience. Follow his work or connect on LinkedIn or X.