Will Bitcoin retest $80K this time? | Credit: Hameem Sarwar
Share
Key Takeaways
Bitcoin is leaving exchanges at a record pace, with net outflows reaching –65,000 BTC.
The Coinbase Premium Index has turned positive for the first time since January.
BTC has broken above the upper trendline of a three-week symmetrical triangle.
After weeks of grinding, patience-testing consolidation that frustrated bulls, Bitcoin (BTC) price briefly reclaimed $74,000 today.
Interestingly, this does not appear to be a brief intraday spike. Instead, it appears that Bitcoin’s price could use this as a launchpad to breach other resistance zones.
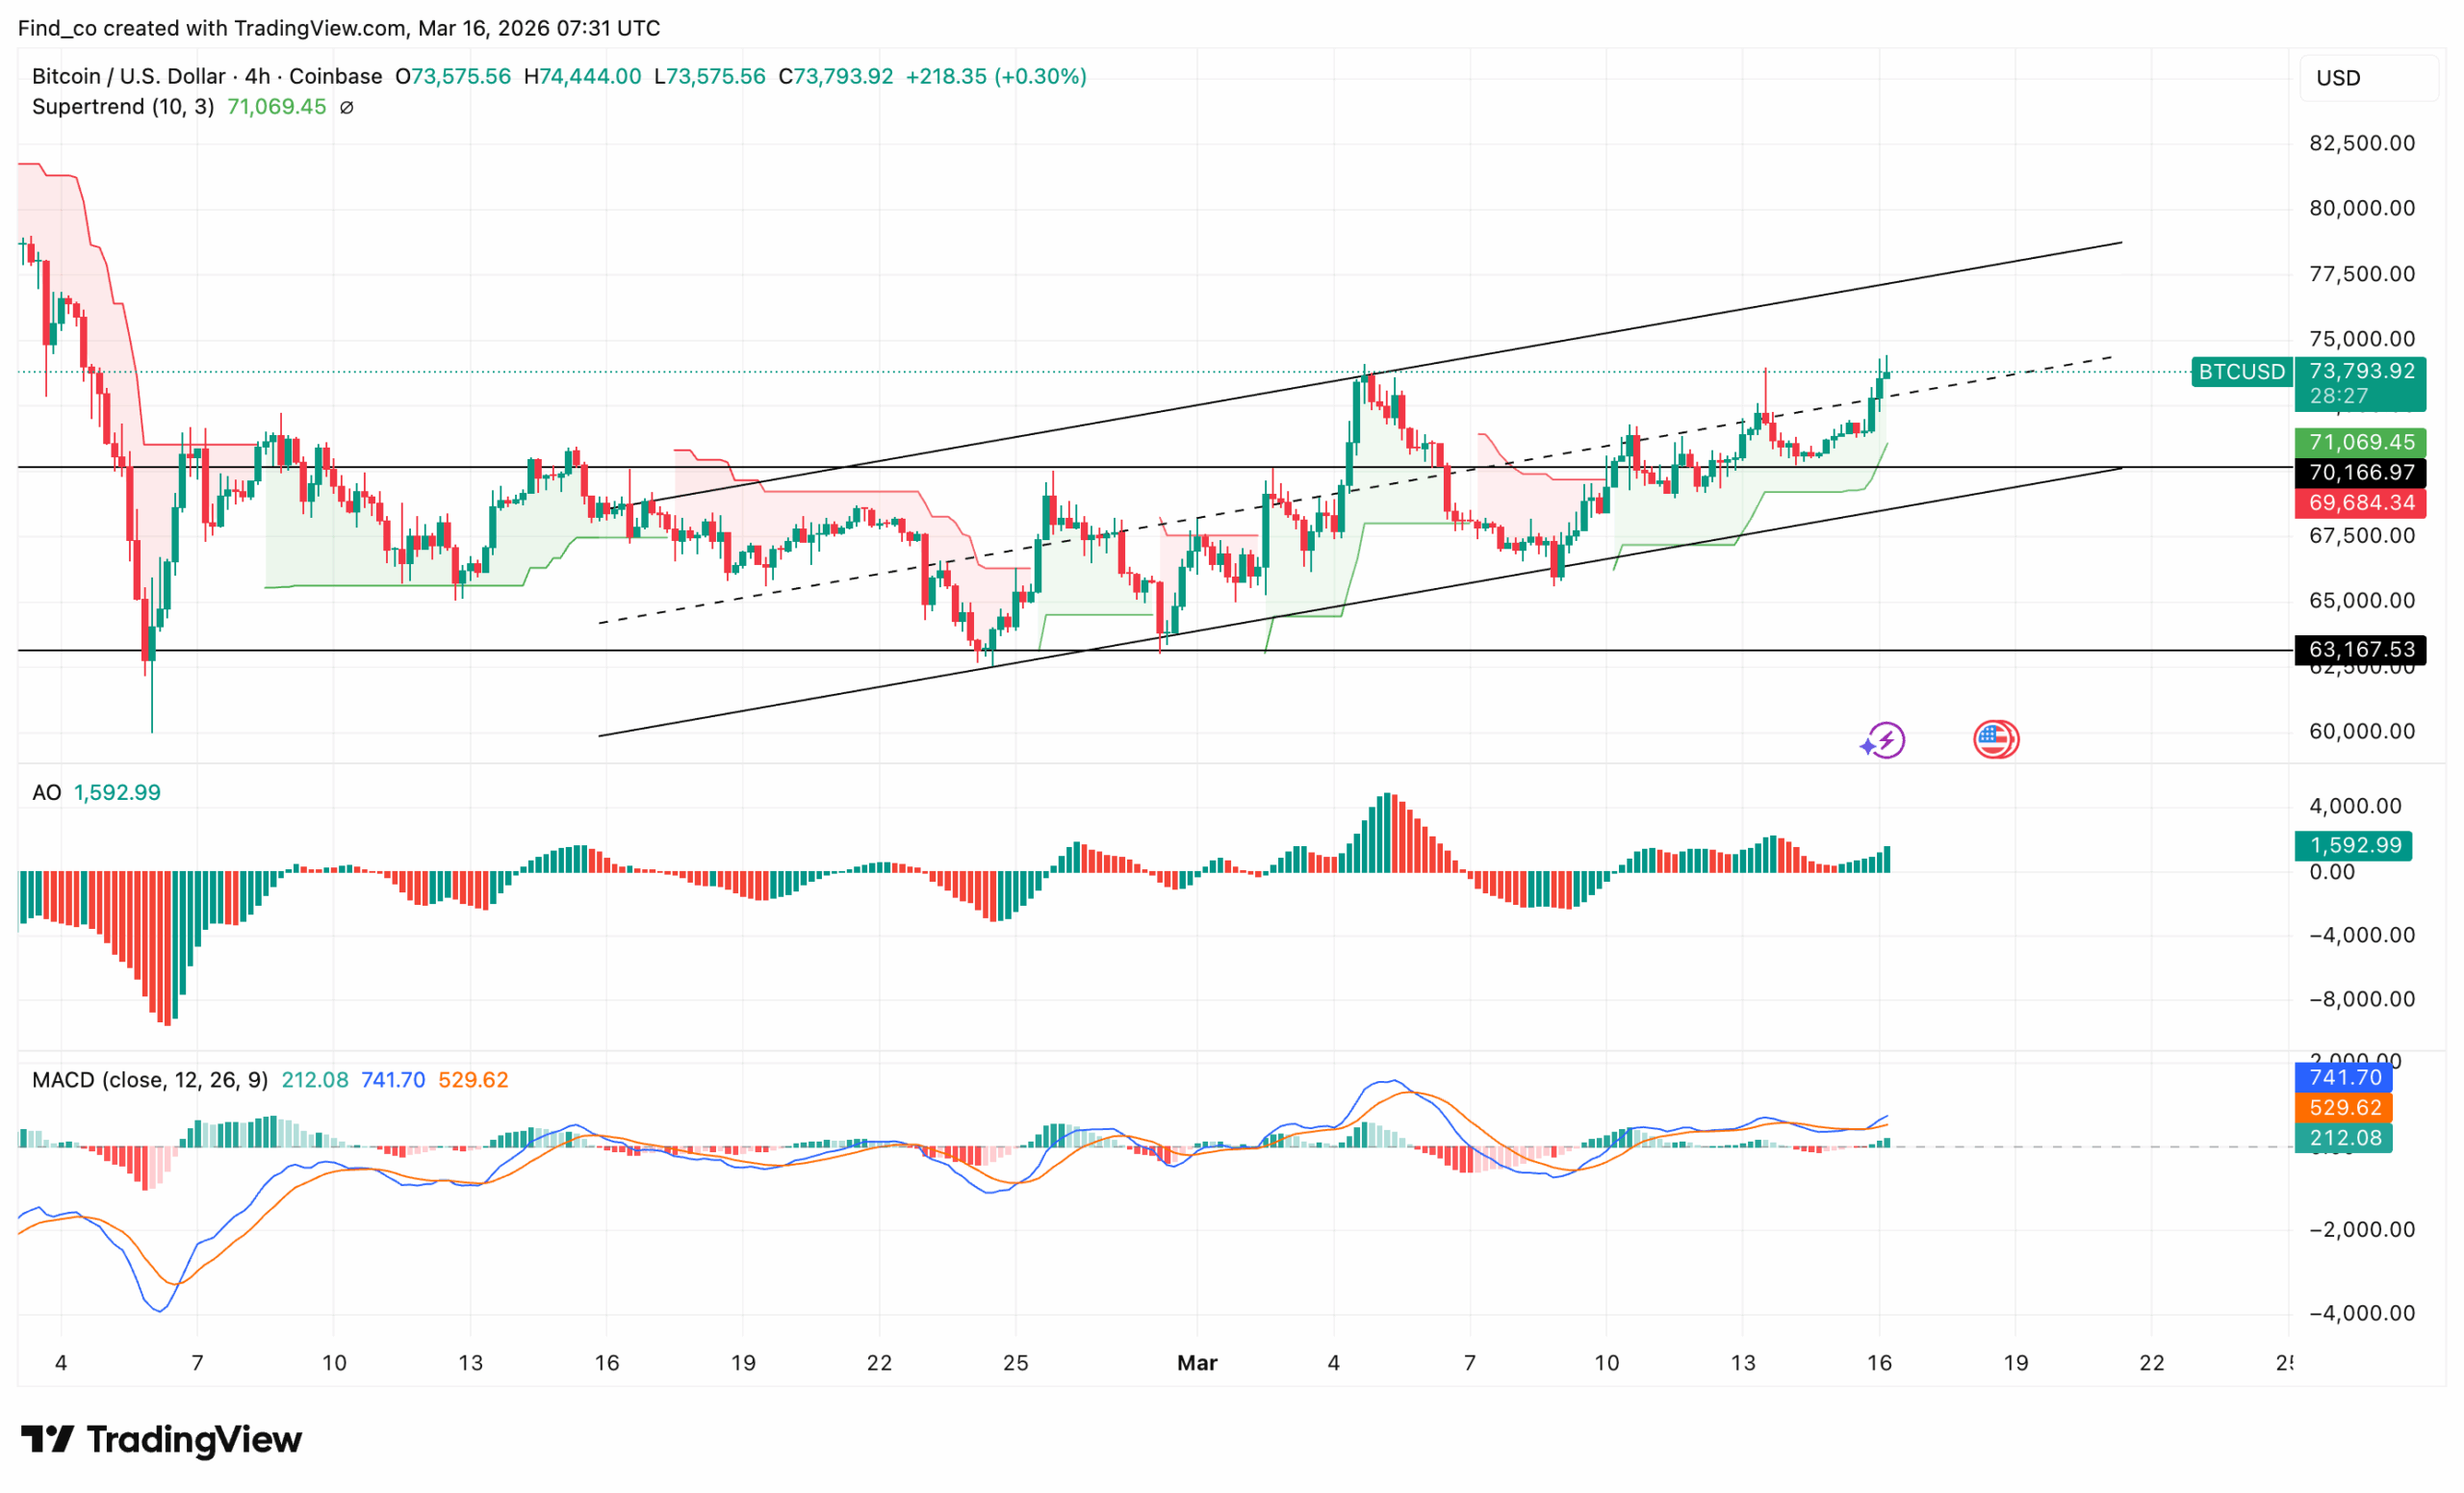
As shown below, BTC trades at $73,793 at the upper boundary of an ascending channel that has guided the price since the $63,167 low on March 6.
The Supertrend at $71,069 has been bullish throughout the channel and is rising.
Notably, BTC Price has respected it as support on every dip over the past ten days. The dashed mid-channel trendline shows price tracking along the upper half, the strongest zone within the channel.
Both momentum indicators are aligned. For instance, the Awesome Oscillator (AO) is building its longest consecutive green bar sequence since February, with no red interruption.
Furthermore, the MACD line (741.70) is well above the signal line (529.62), and the histogram remains sustained in green.
Looking closely, the immediate test is the $74,766 resistance level, which the flat top of the ascending triangle identified on March 13.
As it stands, a 4-hour close above it could drive Bitcoin’s price near the channel’s upper boundary near $77,500.
Sellers Out, Buyers In?
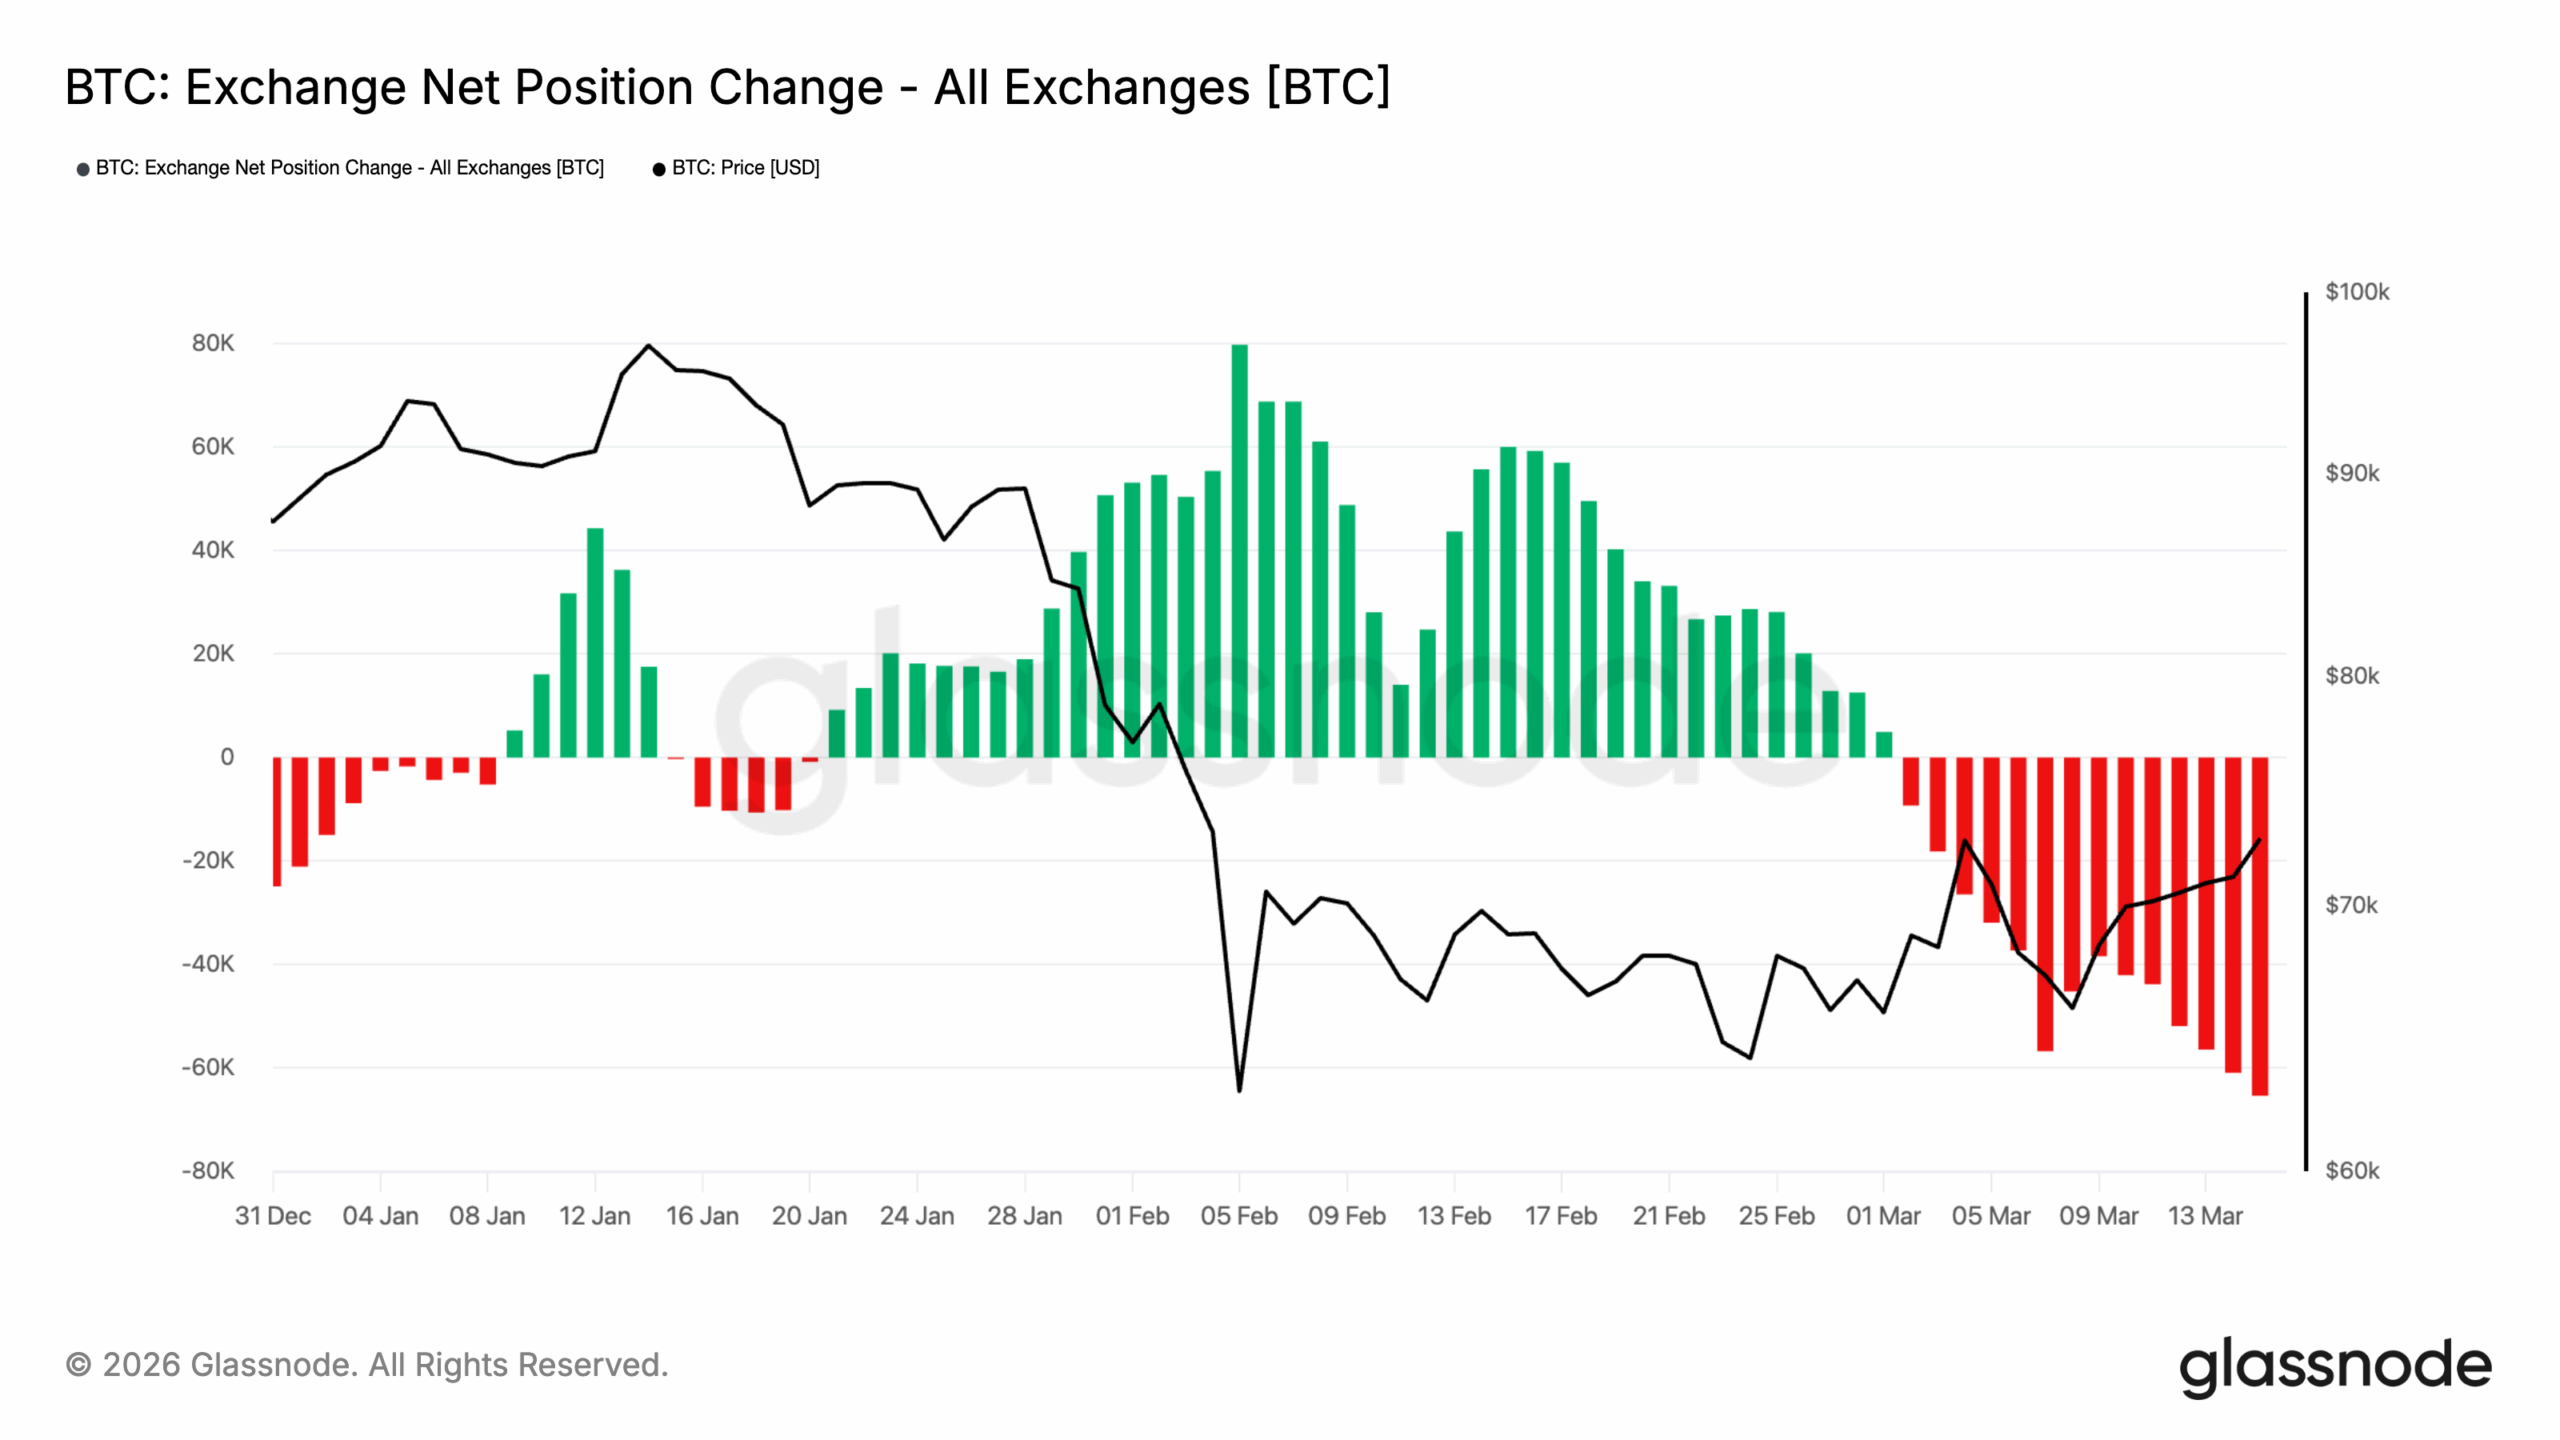
From an on-chain perspective, Bitcoin is being withdrawn from exchanges at an accelerating rate.
According to Glassnode, the Exchange Net Position Change has posted consecutive red bars since early March, with the most recent readings ranging from -60,000 to -65,000 BTC per period.
For context, this is the largest outflow reading on this three-month chart.
The contrast with the prior period is stark. From Feb. 5 through late February, exchanges saw sustained inflows (green bars reaching +80,000 BTC) as the price declined toward $60,000.
Now the dynamic has fully reversed, as Bitcoin’s price has recovered toward $74,000 amid holders pulling coins off exchanges.
The current outflow rate of 60,000 BTC per period, sustained across two weeks, represents a meaningful reduction in liquid supply.
BTC Exchange Net Position Change | Credit: Glassnode
Thus, if this trend persists, Bitcoin’s price might successfully breach the $74,766 resistance.
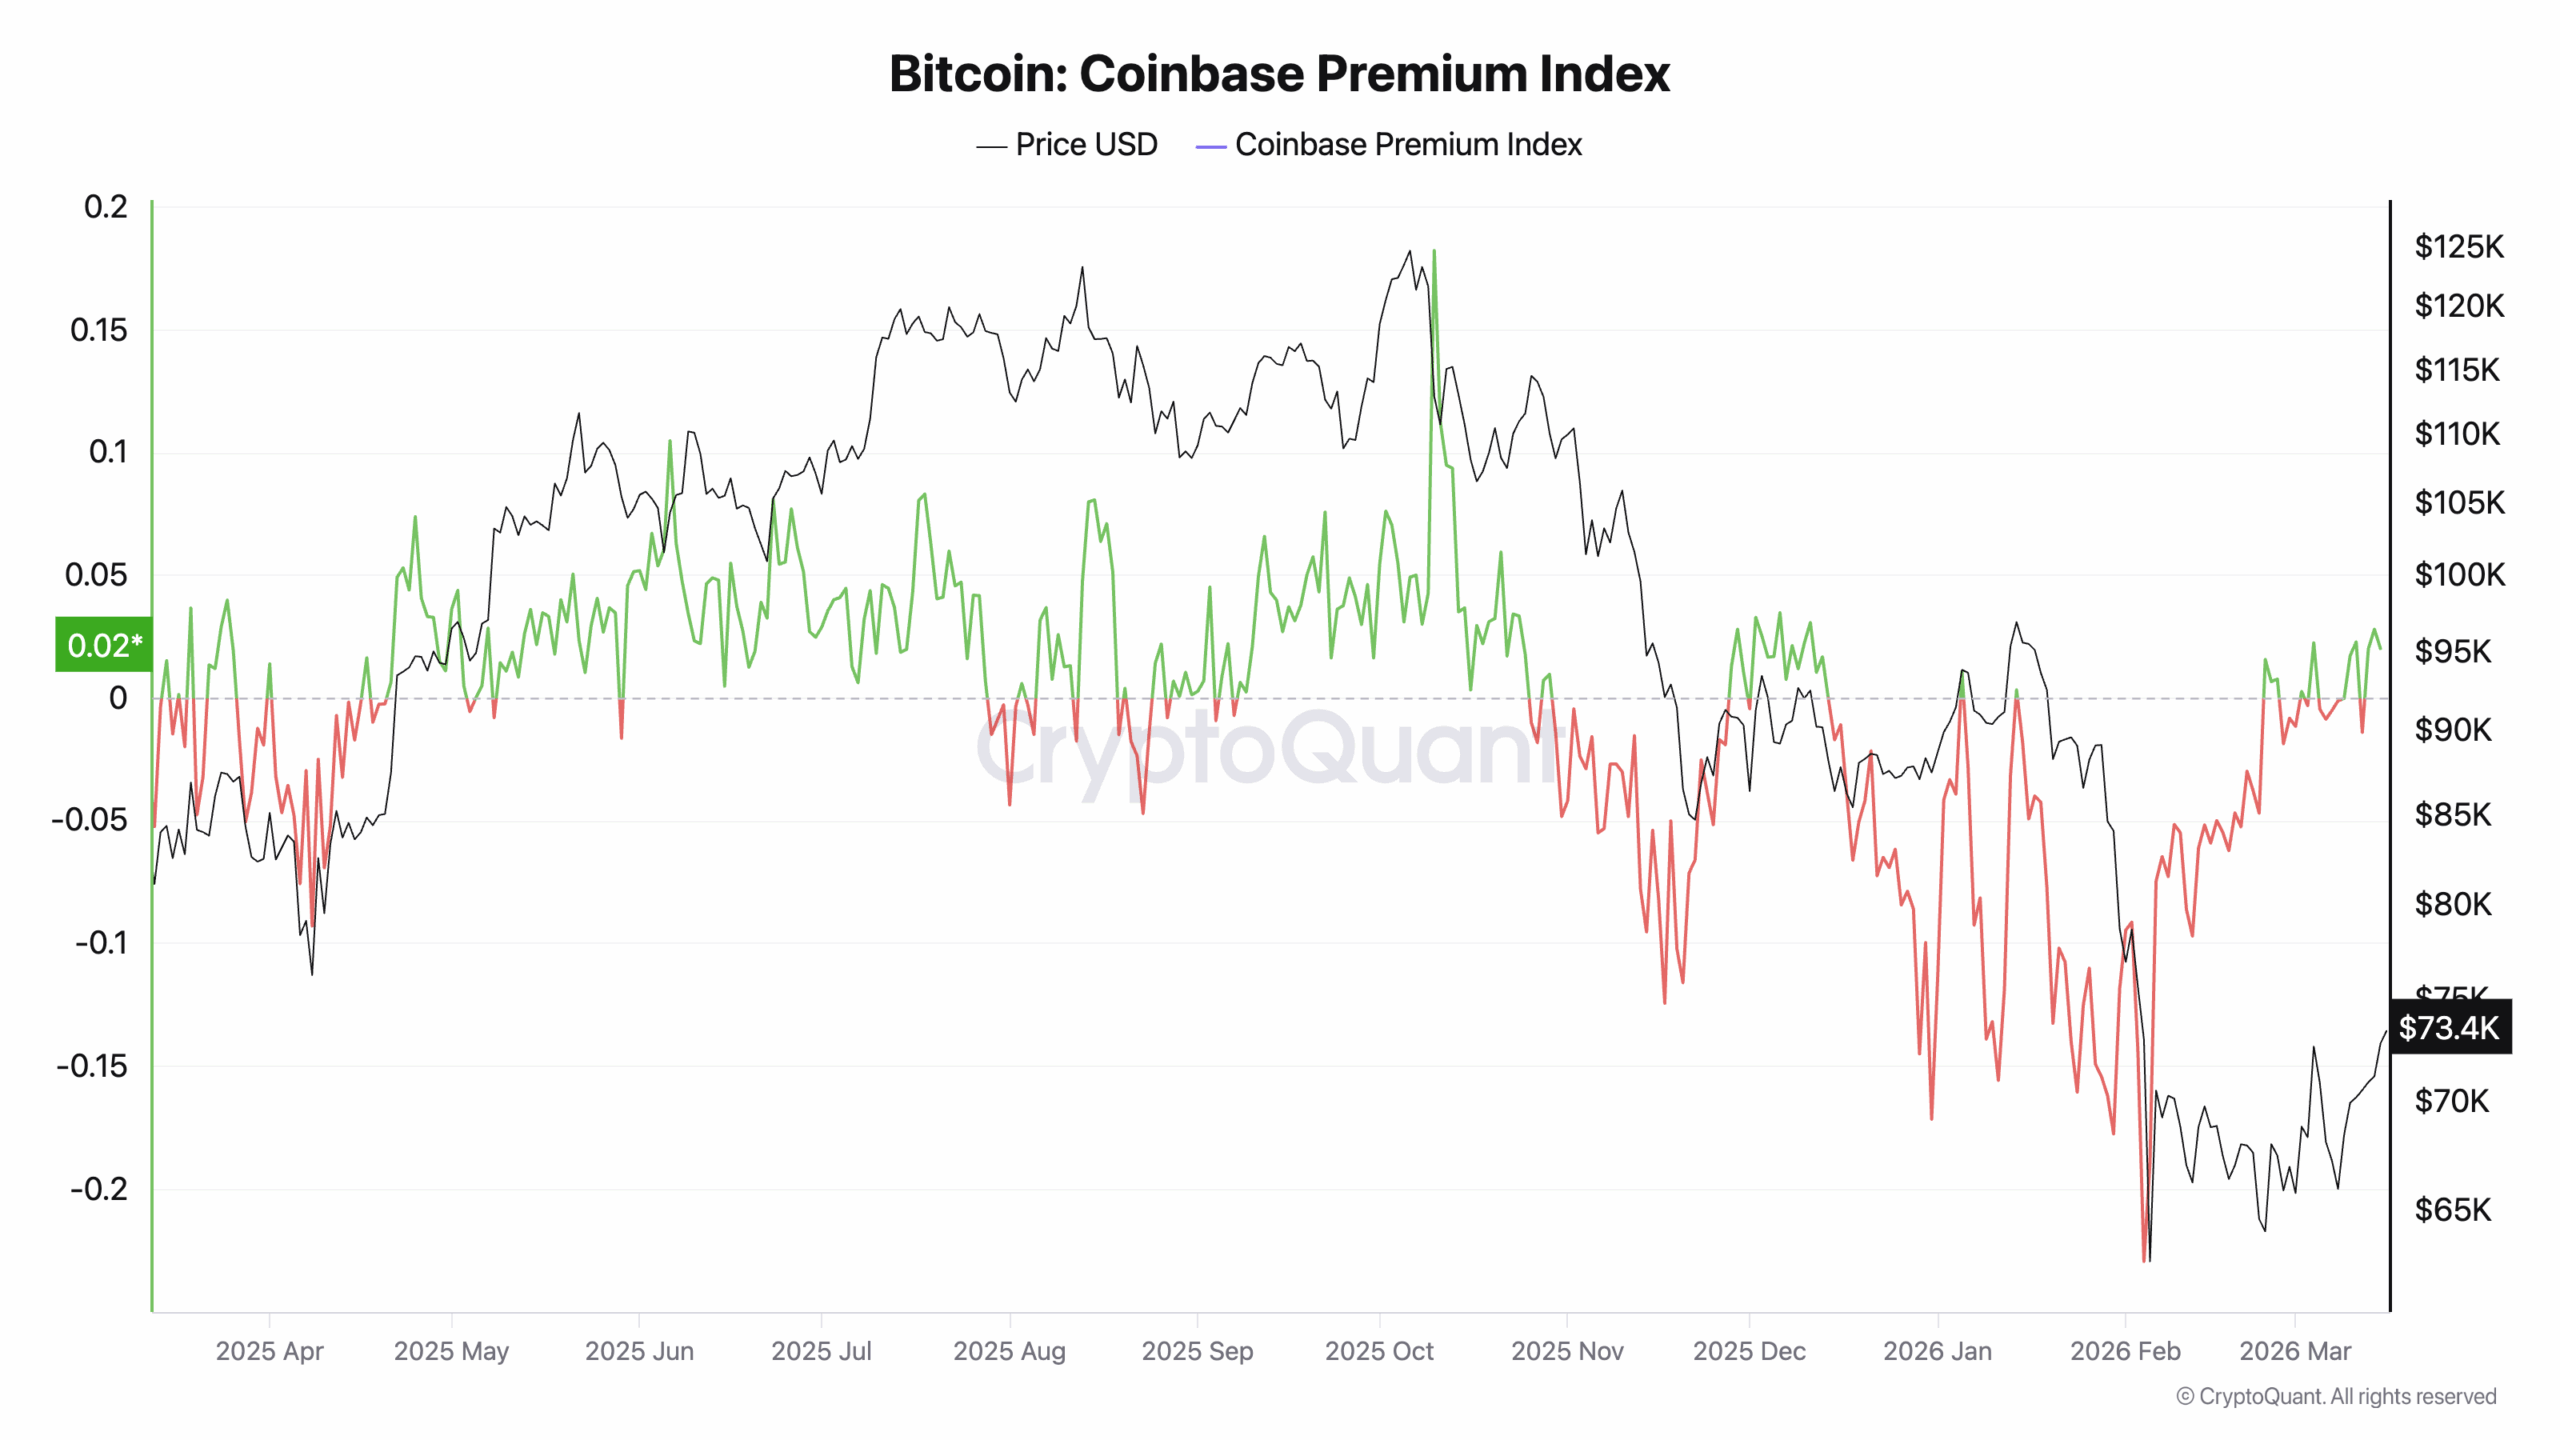
In addition, the Coinbase Premium Index has just flipped green.
The index measures the price difference between Coinbase (predominantly US institutional buyers) and the broader market. A positive premium means US institutions are paying more than the global average.
On the contrary, a negative premium means they are absent or are being sold.
At the time of writing, the premium has now flipped to +0.02 and is recovering toward positive territory for the first time since January.
Combined with the exchange outflow data, the STH capitulation signal, and the 4-hour ascending channel, Bitcoin’s price could avoid a notable short-term correction.
BTC Price Outlook: $80K Next?
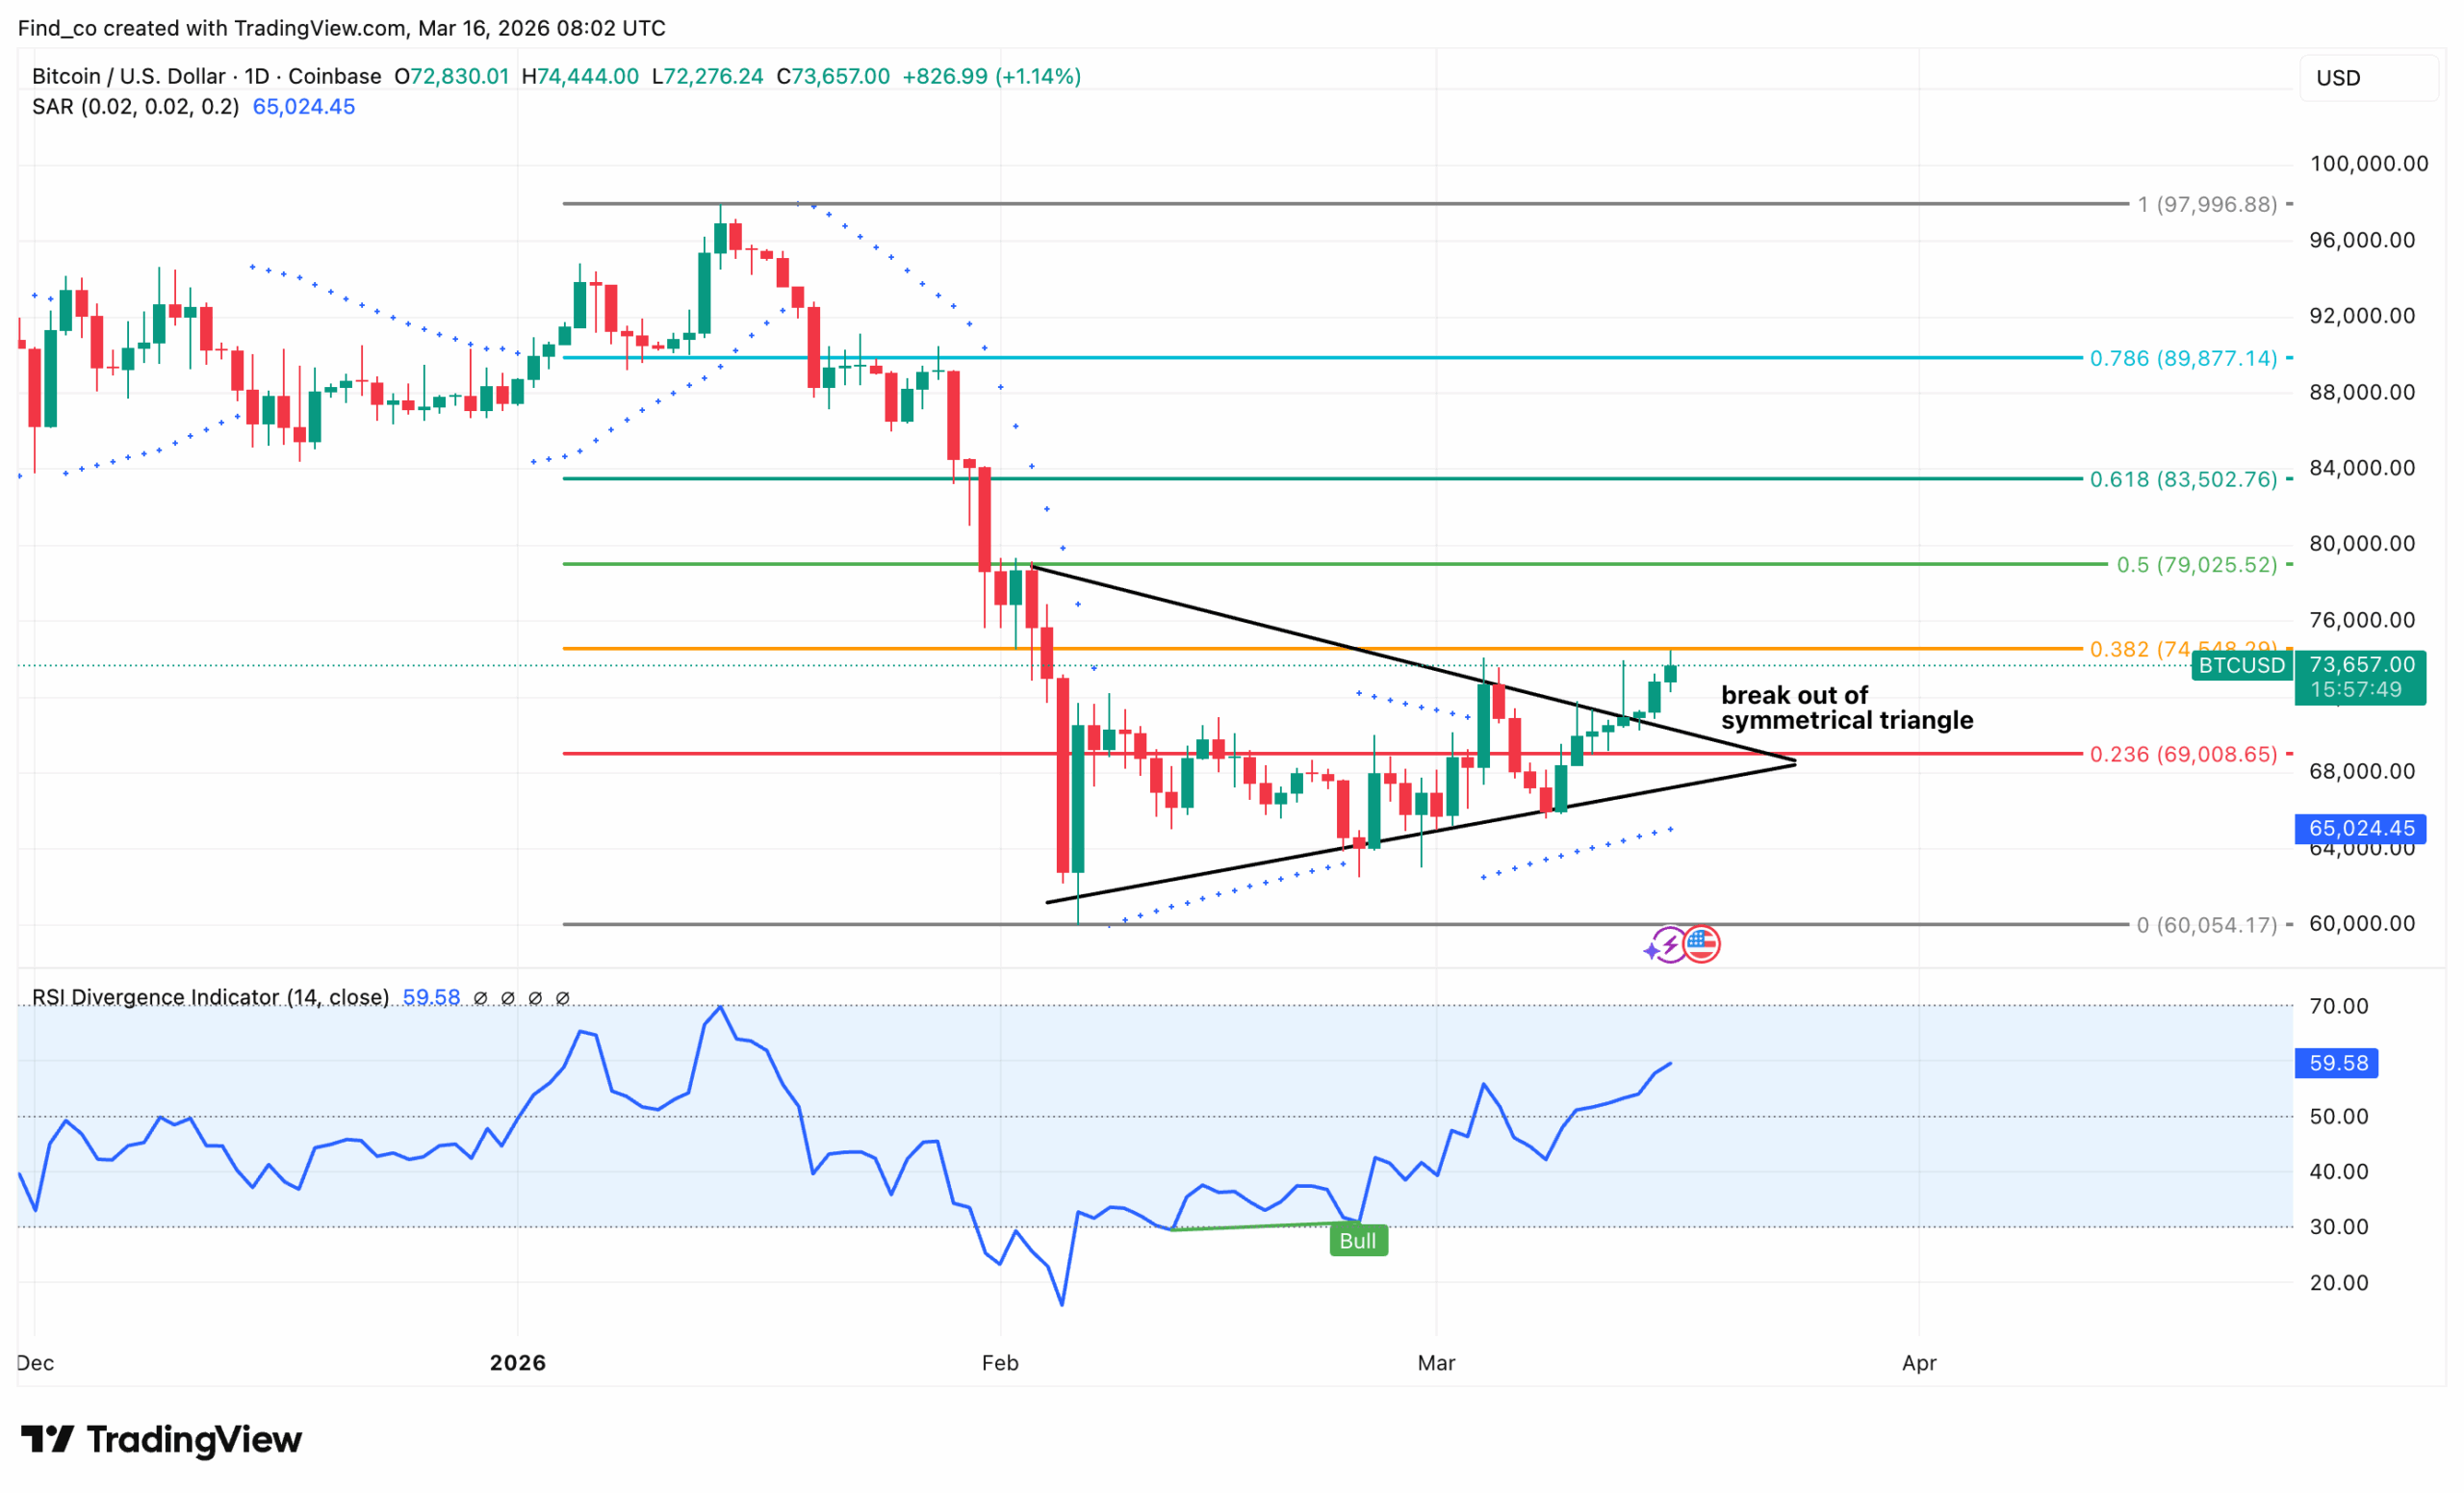
On the daily chart, the violent February sell-off from $78,000 to the $60,054 floor compressed Bitcoin’s price for three weeks inside a symmetrical triangle.
This triangle led BTC to form lower highs and higher lows in equal measure.
That compression has now resolved to the upside, with BTC trading at $73,657.
Importantly, the RSI Divergence Indicator told this story in advance. A clear Bull divergence label printed at the February lows.
Following that divergence signal, RSI has now climbed to 59.58, suggesting that the BTC price rally is not over.
Furthermore, the Fibonacci structure provides a clear target ladder.
The immediate resistance is the 0.382 Fib at $74,508. Beyond that, $79,025 (0.5 Fib) and then $83,502 (0.618 Fib) become the progressive objectives as momentum builds.
Additionally, the symmetrical triangle’s measured move — calculated by projecting the triangle’s height from the breakout point — targets the $80,000 zone and converges directly with the 0.5 Fib.
Ultimately, the SAR at $65,024 is the hard invalidation. As long as the price holds above it on a daily close, the breakout structure remains intact, and the Fibonacci ladder above serves as the roadmap.
On the downside, $74,000 is now the critical support level to defend.
Below $74,000, the next meaningful support sits in the $69,000 range. If bulls fail to defend this zone, Bitcoin’s price might slide to a new multi-year low.
Disclaimer:
The information provided in this article is for informational purposes only. It is not intended to be, nor should it be construed as, financial advice. We do not make any warranties regarding the completeness, reliability, or accuracy of this information. All investments involve risk, and past performance does not guarantee future results. We recommend consulting a financial advisor before making any investment decisions.
Victor Olanrewaju is a crypto analyst and reporter at CCN with deep roots in on-chain research and technical analysis. His crypto journey began in 2017, but it was the 2020 Uniswap airdrop that sparked a full-time pivot into the space.
With a foundation in copywriting, Victor honed his craft creating high-converting content for leading crypto brokers — most notably an XRP price prediction that ranked #1 on Google during the 2021 bull run.
He later joined AMBCrypto in 2022, where he combined storytelling with technical and on-chain analysis to cover key market narratives.
In 2024, he expanded his expertise at BeInCrypto, collaborating with analysts and using tools like Glassnode, Santiment, and IntoTheBlock to break down Bitcoin and altcoin trends.
At CCN, Victor covers the top cryptocurrencies, memecoins, macro shifts, blending real-time insights with deep-dive metrics.
He holds a Bachelor’s degree in Physics from the University of Ibadan, equipping him to simplify complex data for a wide audience. Follow his work or connect on LinkedIn or X.