Home / Analysis / Crypto / Technical Analysis / Bitcoin (BTC) Flat, Crude Oil Prices Close in on $120: How Short Squeeze Could Put Crypto Whales in Serious Danger
Crypto whales risk liquidation on crude oil shorts and Bitcoin does not offer hedge | Credit: Hameem Sarwar
Share
Key Takeaways
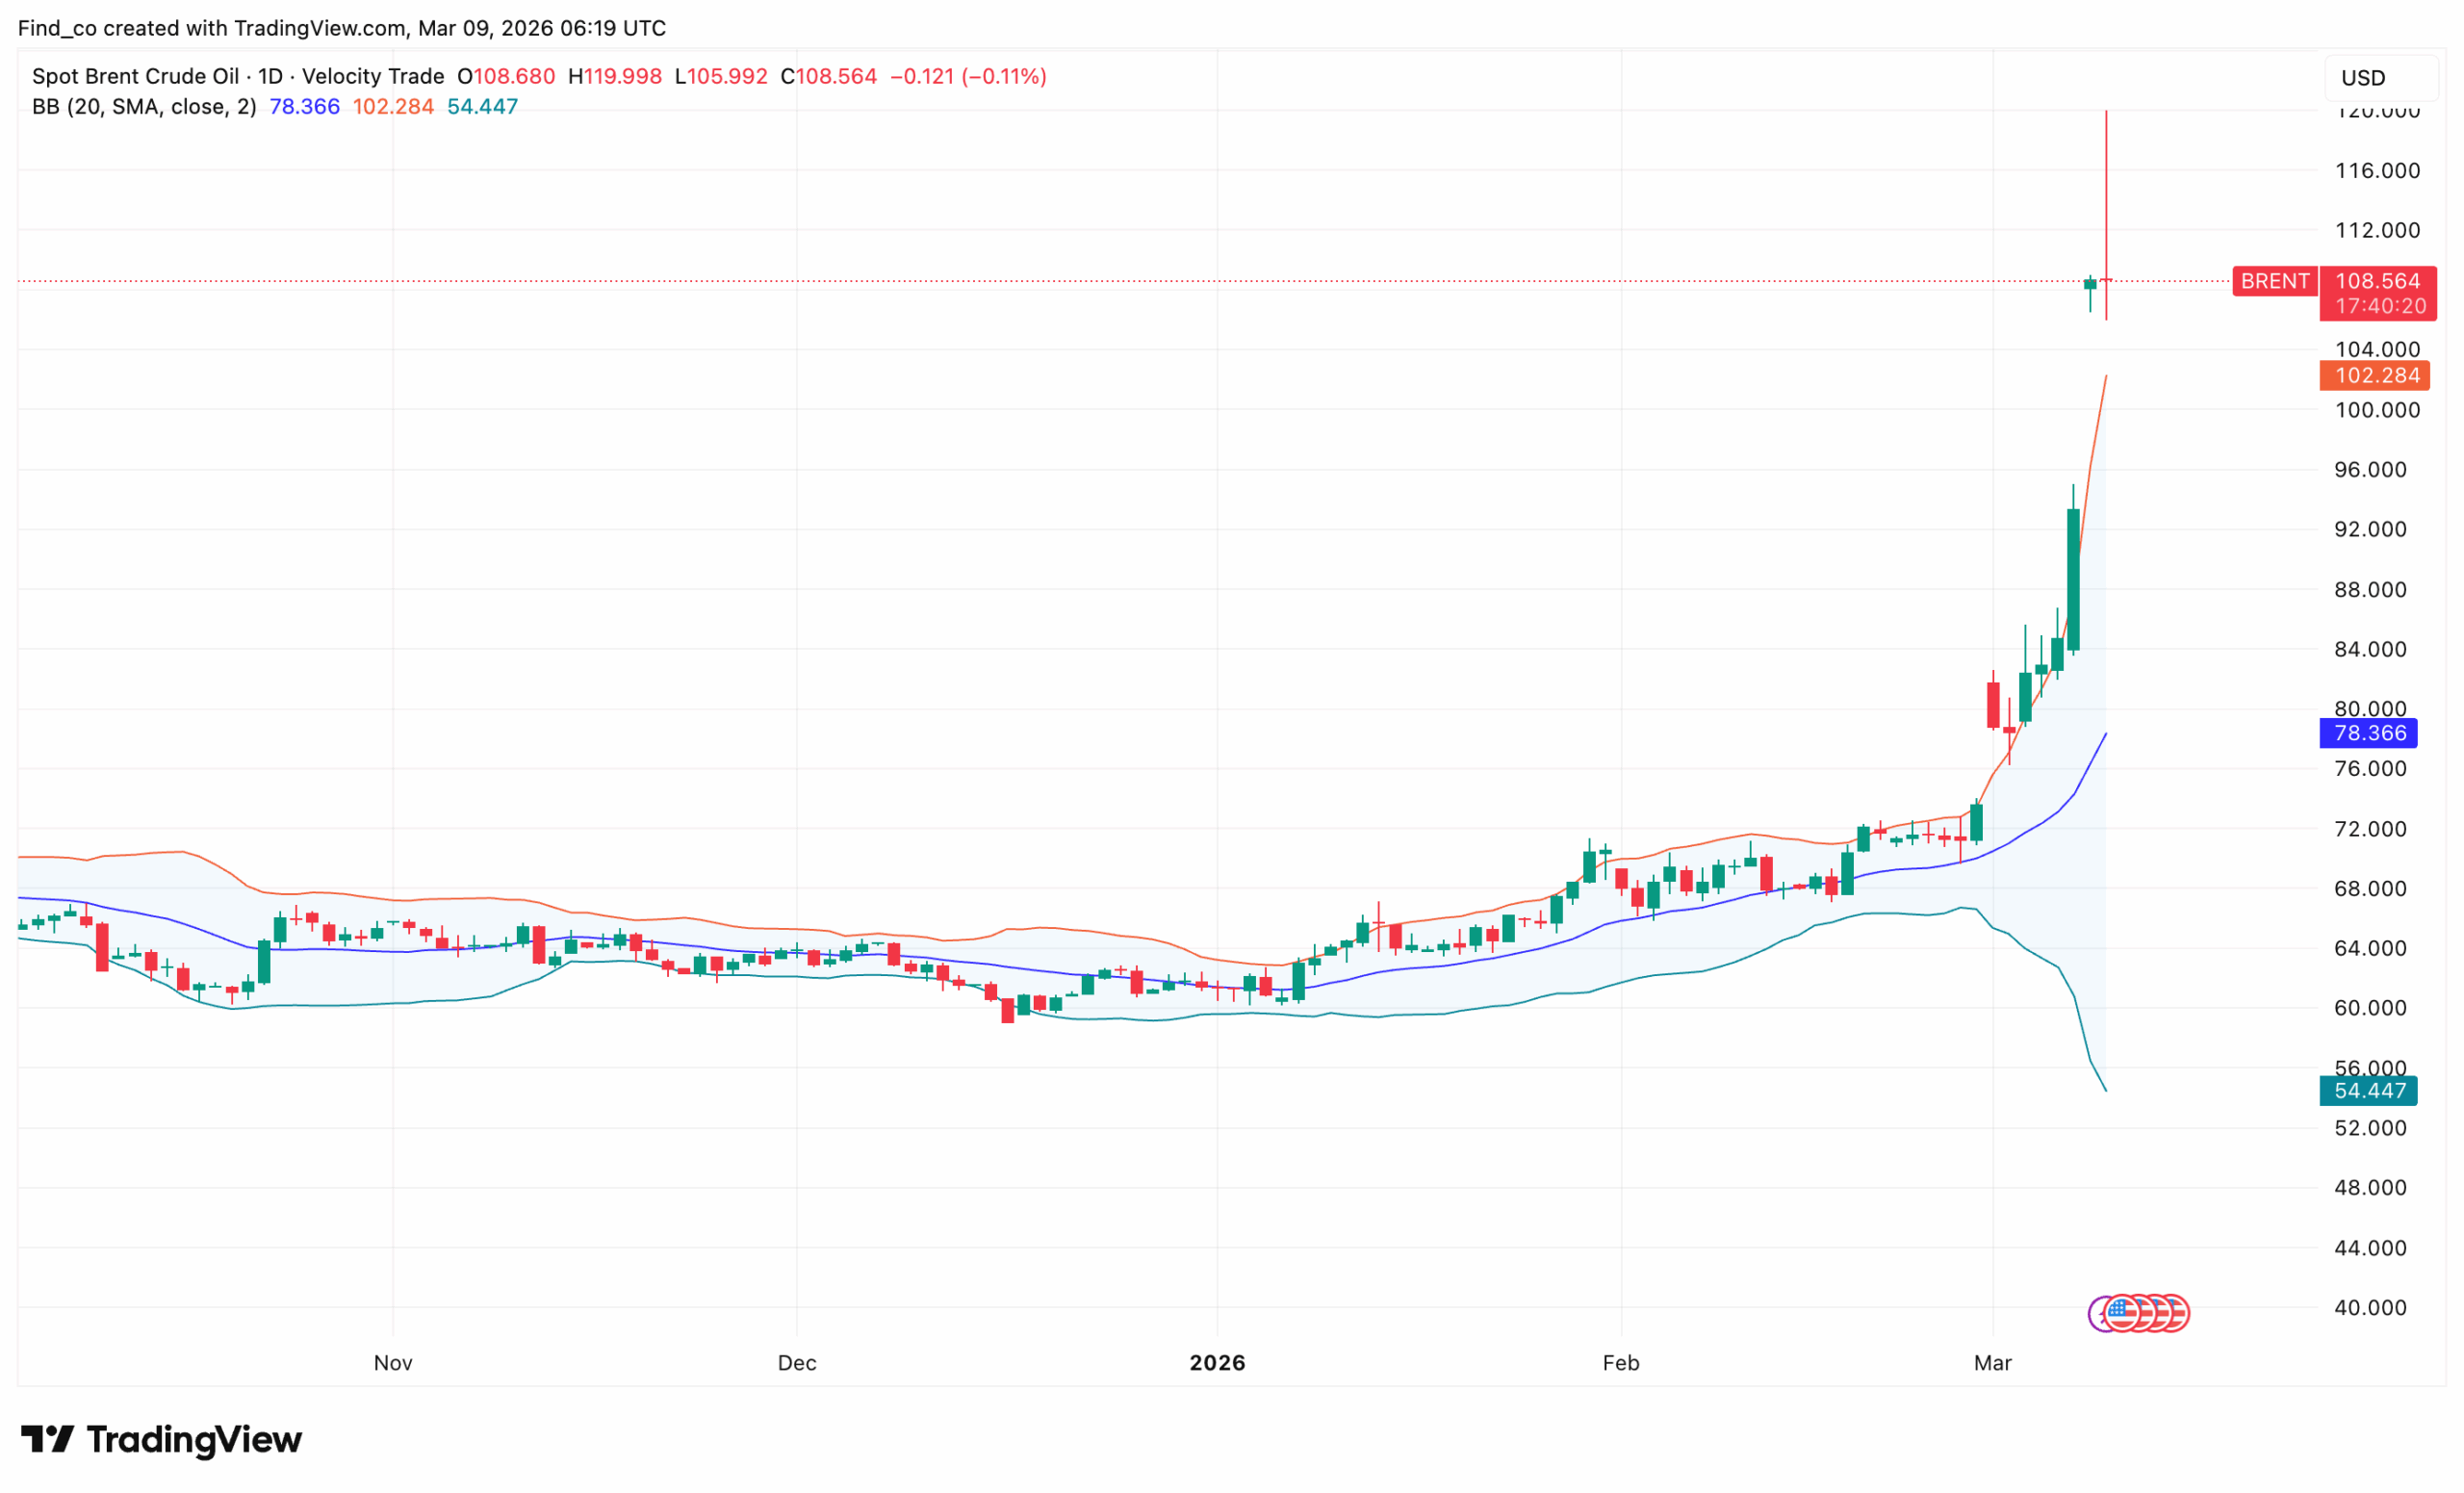
Crude oil prices have surged above $100 per barrel for the first time since July 2022.
U.S. President Donald Trump dismissed the spike on TruthSocial as a “small price to pay.”
Several crypto whales with open oil short positions are underwater and are at high risk of liquidation.
While Holders Sentiment is at an extreme, a Bitcoin recovery likely depends on oil prices cooling.
Bitcoin (BTC) is holding flat. Crude oil prices have not surged above $100 since July 2022.
As Brent crude closes aggressively on the $ 120-per-barrel threshold, a macro pressure point is building beneath the surface of crypto markets that most retail participants have not yet registered.
This time, crypto whales who built significant short positions on oil are now staring down one of the most dangerous short squeeze setups.
The consequences, if that squeeze triggers, might not stay contained within energy markets. In this analysis, CCN explains how an extended crude oil rally could affect Bitcoin’s price and the broader crypto market.
Why Oil Prices Are Surging
The crude oil rally is not happening in a vacuum. Escalating geopolitical tensions across the Middle East, combined with credible threats to the Strait of Hormuz shipping lanes, through which roughly one-fifth of the world’s oil supply transits daily, have injected a severe risk premium into energy markets.
Despite this, U.S. President Donald Trump has called it a “small price to pay” for the potential gains ahead.
“Short term oil prices, which will drop rapidly when the destruction of the Iran nuclear threat is over, is a very small price to pay for USA, and World, Safety and Peace,” Trump wrote on Sunday via his TruthSocial account, March 8.
For major energy-importing economies, the $120 level is not just a number — it is a threshold at which inflationary consequences become systemic.
Get These Top Crypto Casino Offers Now!
Sponsored
Disclosure
We sometimes use affiliate links in our content, when clicking on those we might receive a commission at no extra cost to you. By using this website you agree to our terms and conditions and privacy policy.
Central banks, including the Federal Reserve, face an immediate policy dilemma. In this instance, they need to decide whether to tighten further to combat energy-driven inflation.
On the other hand, they could risk crushing economic growth, or hold rates steady and risk unanchored inflation expectations.
Uptrend for Crude, Downtrend for Bitcoin’s Price?
For context, neither outcome is friendly to risk assets. Bitcoin, despite its maturing narrative as a macro hedge, has historically correlated with broad risk-off moves during inflationary shocks like this.
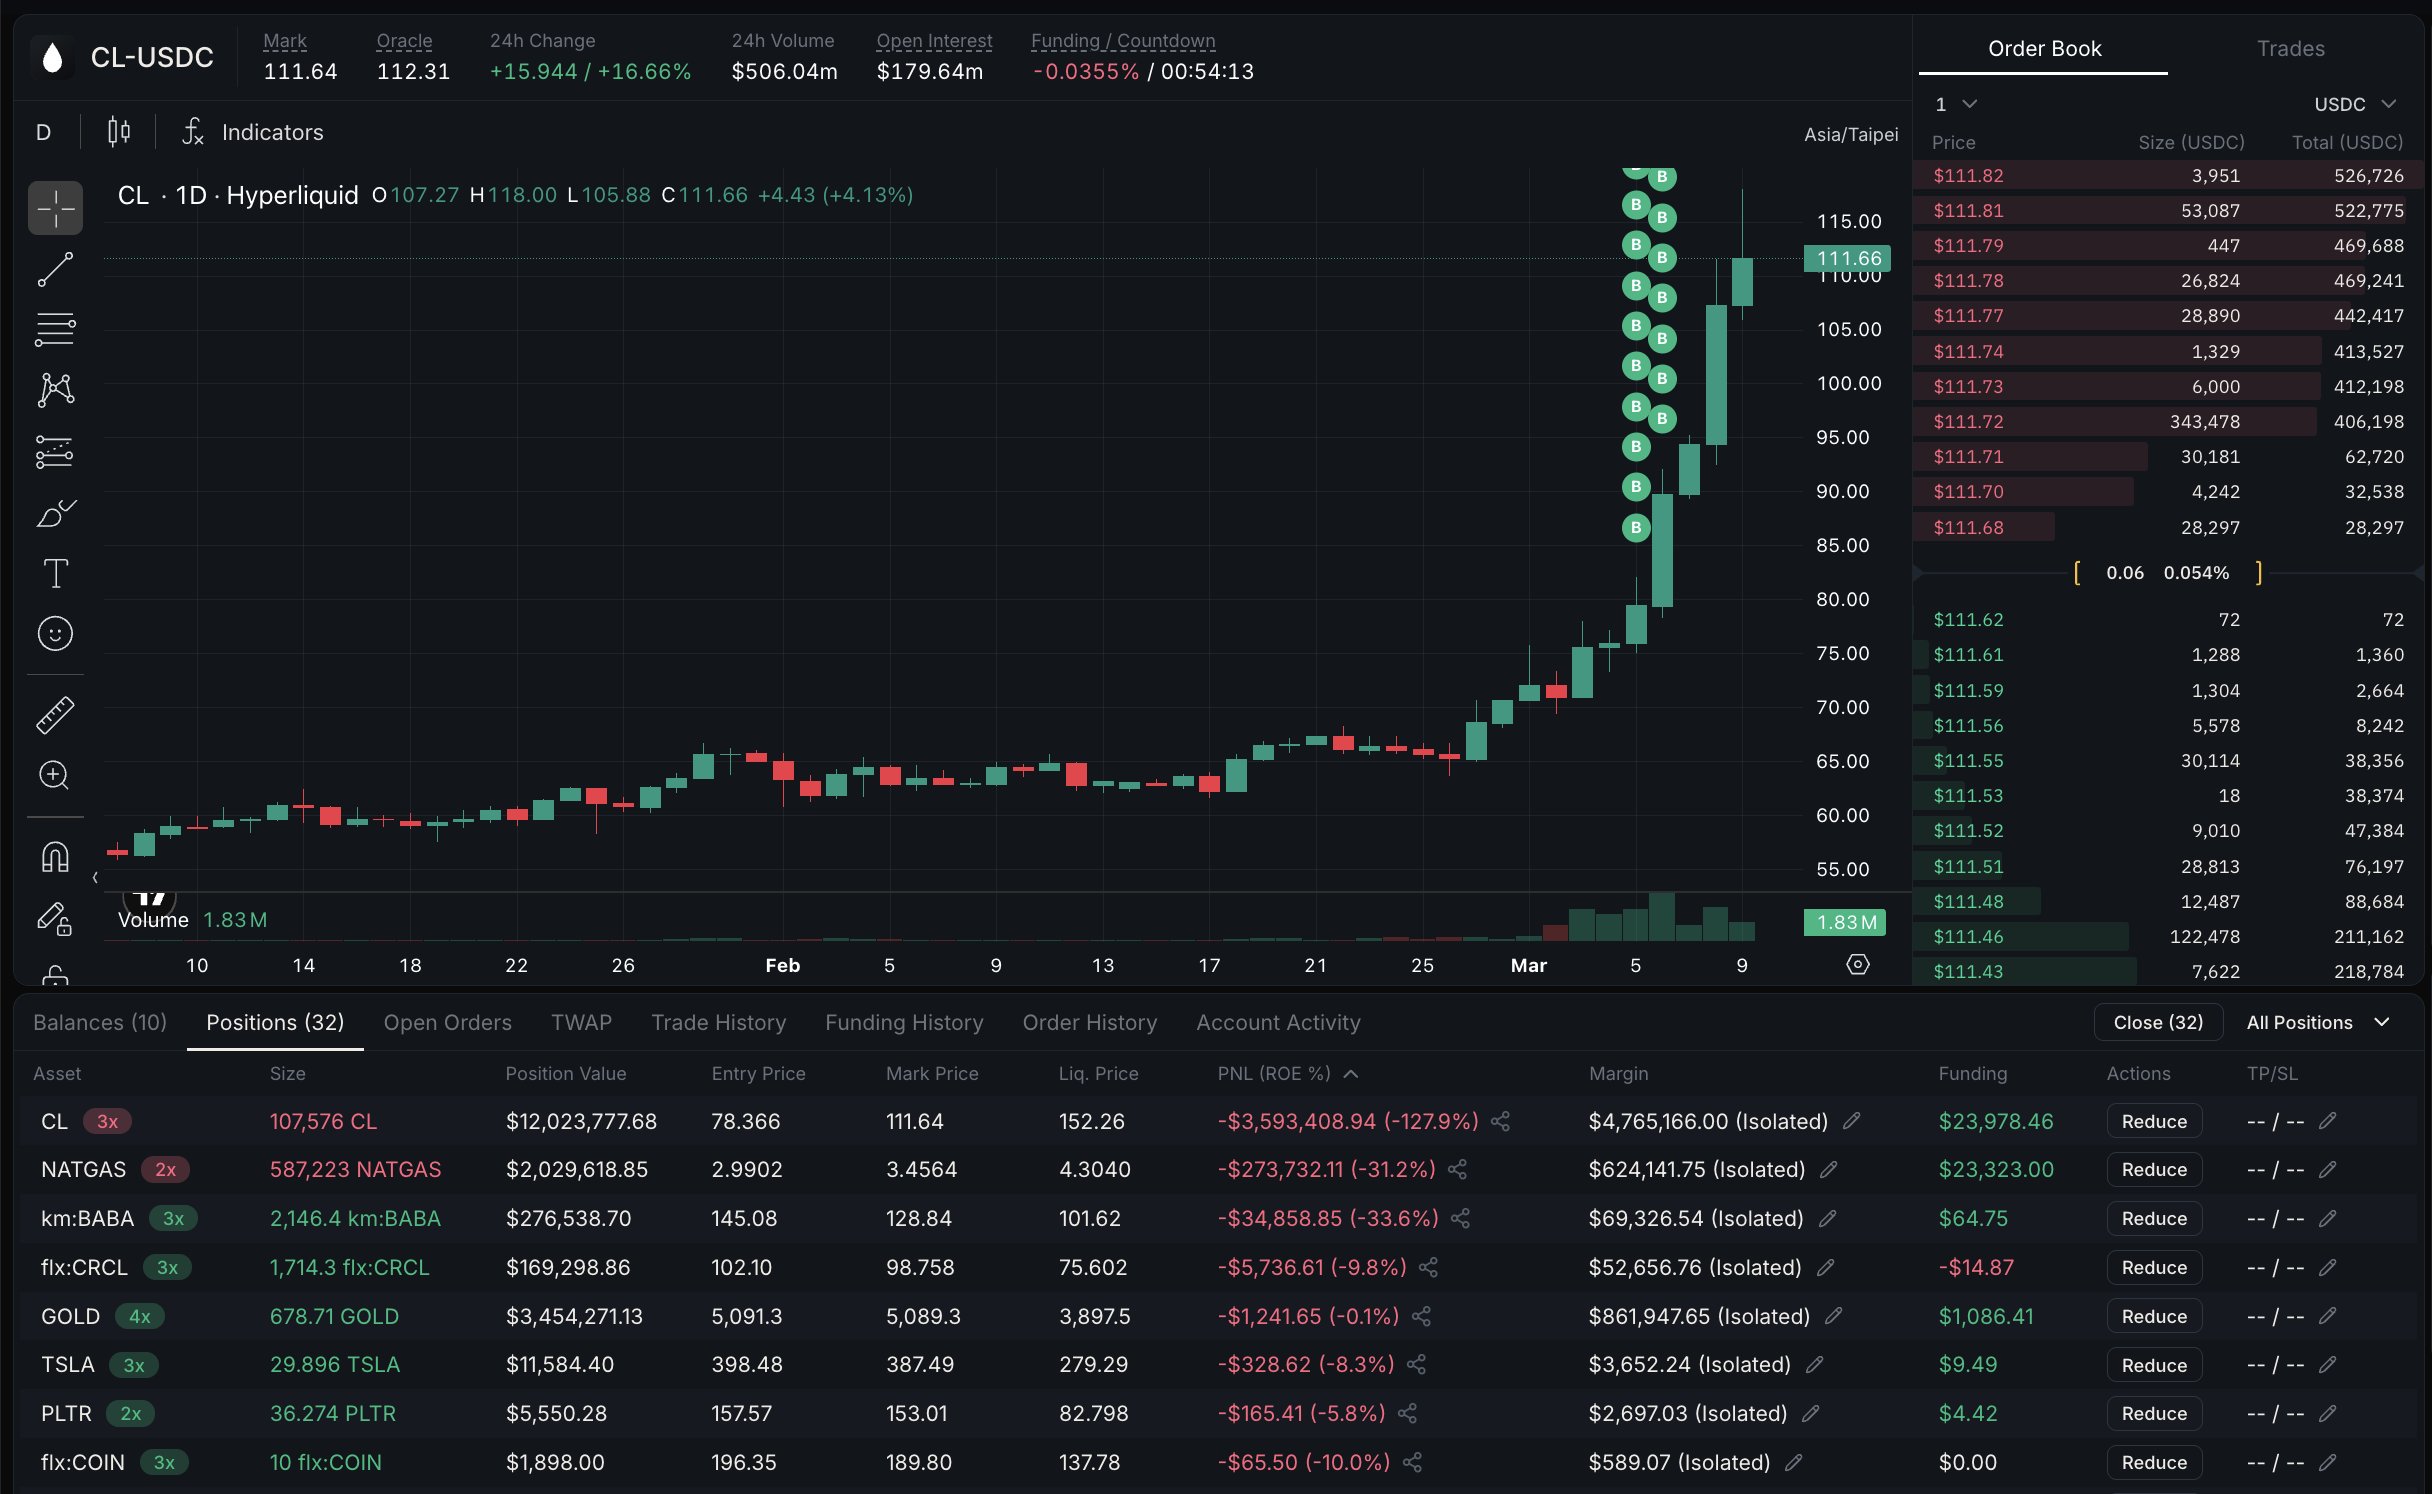
The Strait of Hormuz remains partially blocked amid threats from Iran, driving prices sharply higher. As a result, several crypto whales have opened short positions on CL (a tokenized crude oil asset in the crypto market), leaving them dangerously exposed.
CBB0FE leads the losers. The memecoin sniper-turned-crypto-trader is currently down $3.5 million on a $122 million short. Despite mounting losses, the position remains open, raising questions about how much longer it can hold.
Fresh shorts are still entering. A newly created wallet, 0xab96, opened a 5x-leveraged short position on 90,000 CL, worth $10.2 million, within the past two hours. Its liquidation price sits at $130.45 — a level that looks increasingly reachable if oil continues to climb.
One whale has already been wiped out. Wallet 0x8Af7 had its 72,179 xyz: CL short — worth $7.8 million — fully liquidated, resulting in a loss of over $1.55 million. Remarkably, the same wallet immediately reopened a new short at 60,166 xyz: CL ($6.48 million), doubling down despite the loss. That same trader also holds the largest on-chain long in XYZ: XYZ100, worth $38.52 million, suggesting a complex, multi-directional book.
The divide is stark. Loracle.hl is short 75,598 xyz: CL and is already down $1.24 million. On the other side, Rune is long 75,091 xyz: CL and is up $1.22 million — nearly a mirror image, with one side bleeding what the other is gaining.
Short Squeeze Next?
Following these moves, the conditions for a violent squeeze are forming quickly.
Multiple large shorts are clustered near current price levels, and as oil pushes higher, these positions will approach their liquidation thresholds.
Once liquidations begin, exchanges may be forced to buy back the underlying asset to close positions. That buying pressure then pushes prices even higher.
Higher prices, in turn, threaten the next short in line. Each liquidation becomes fuel for the next.
Therefore, if oil prices hold or rise, the feedback loop could become self-reinforcing as more shorts are liquidated.
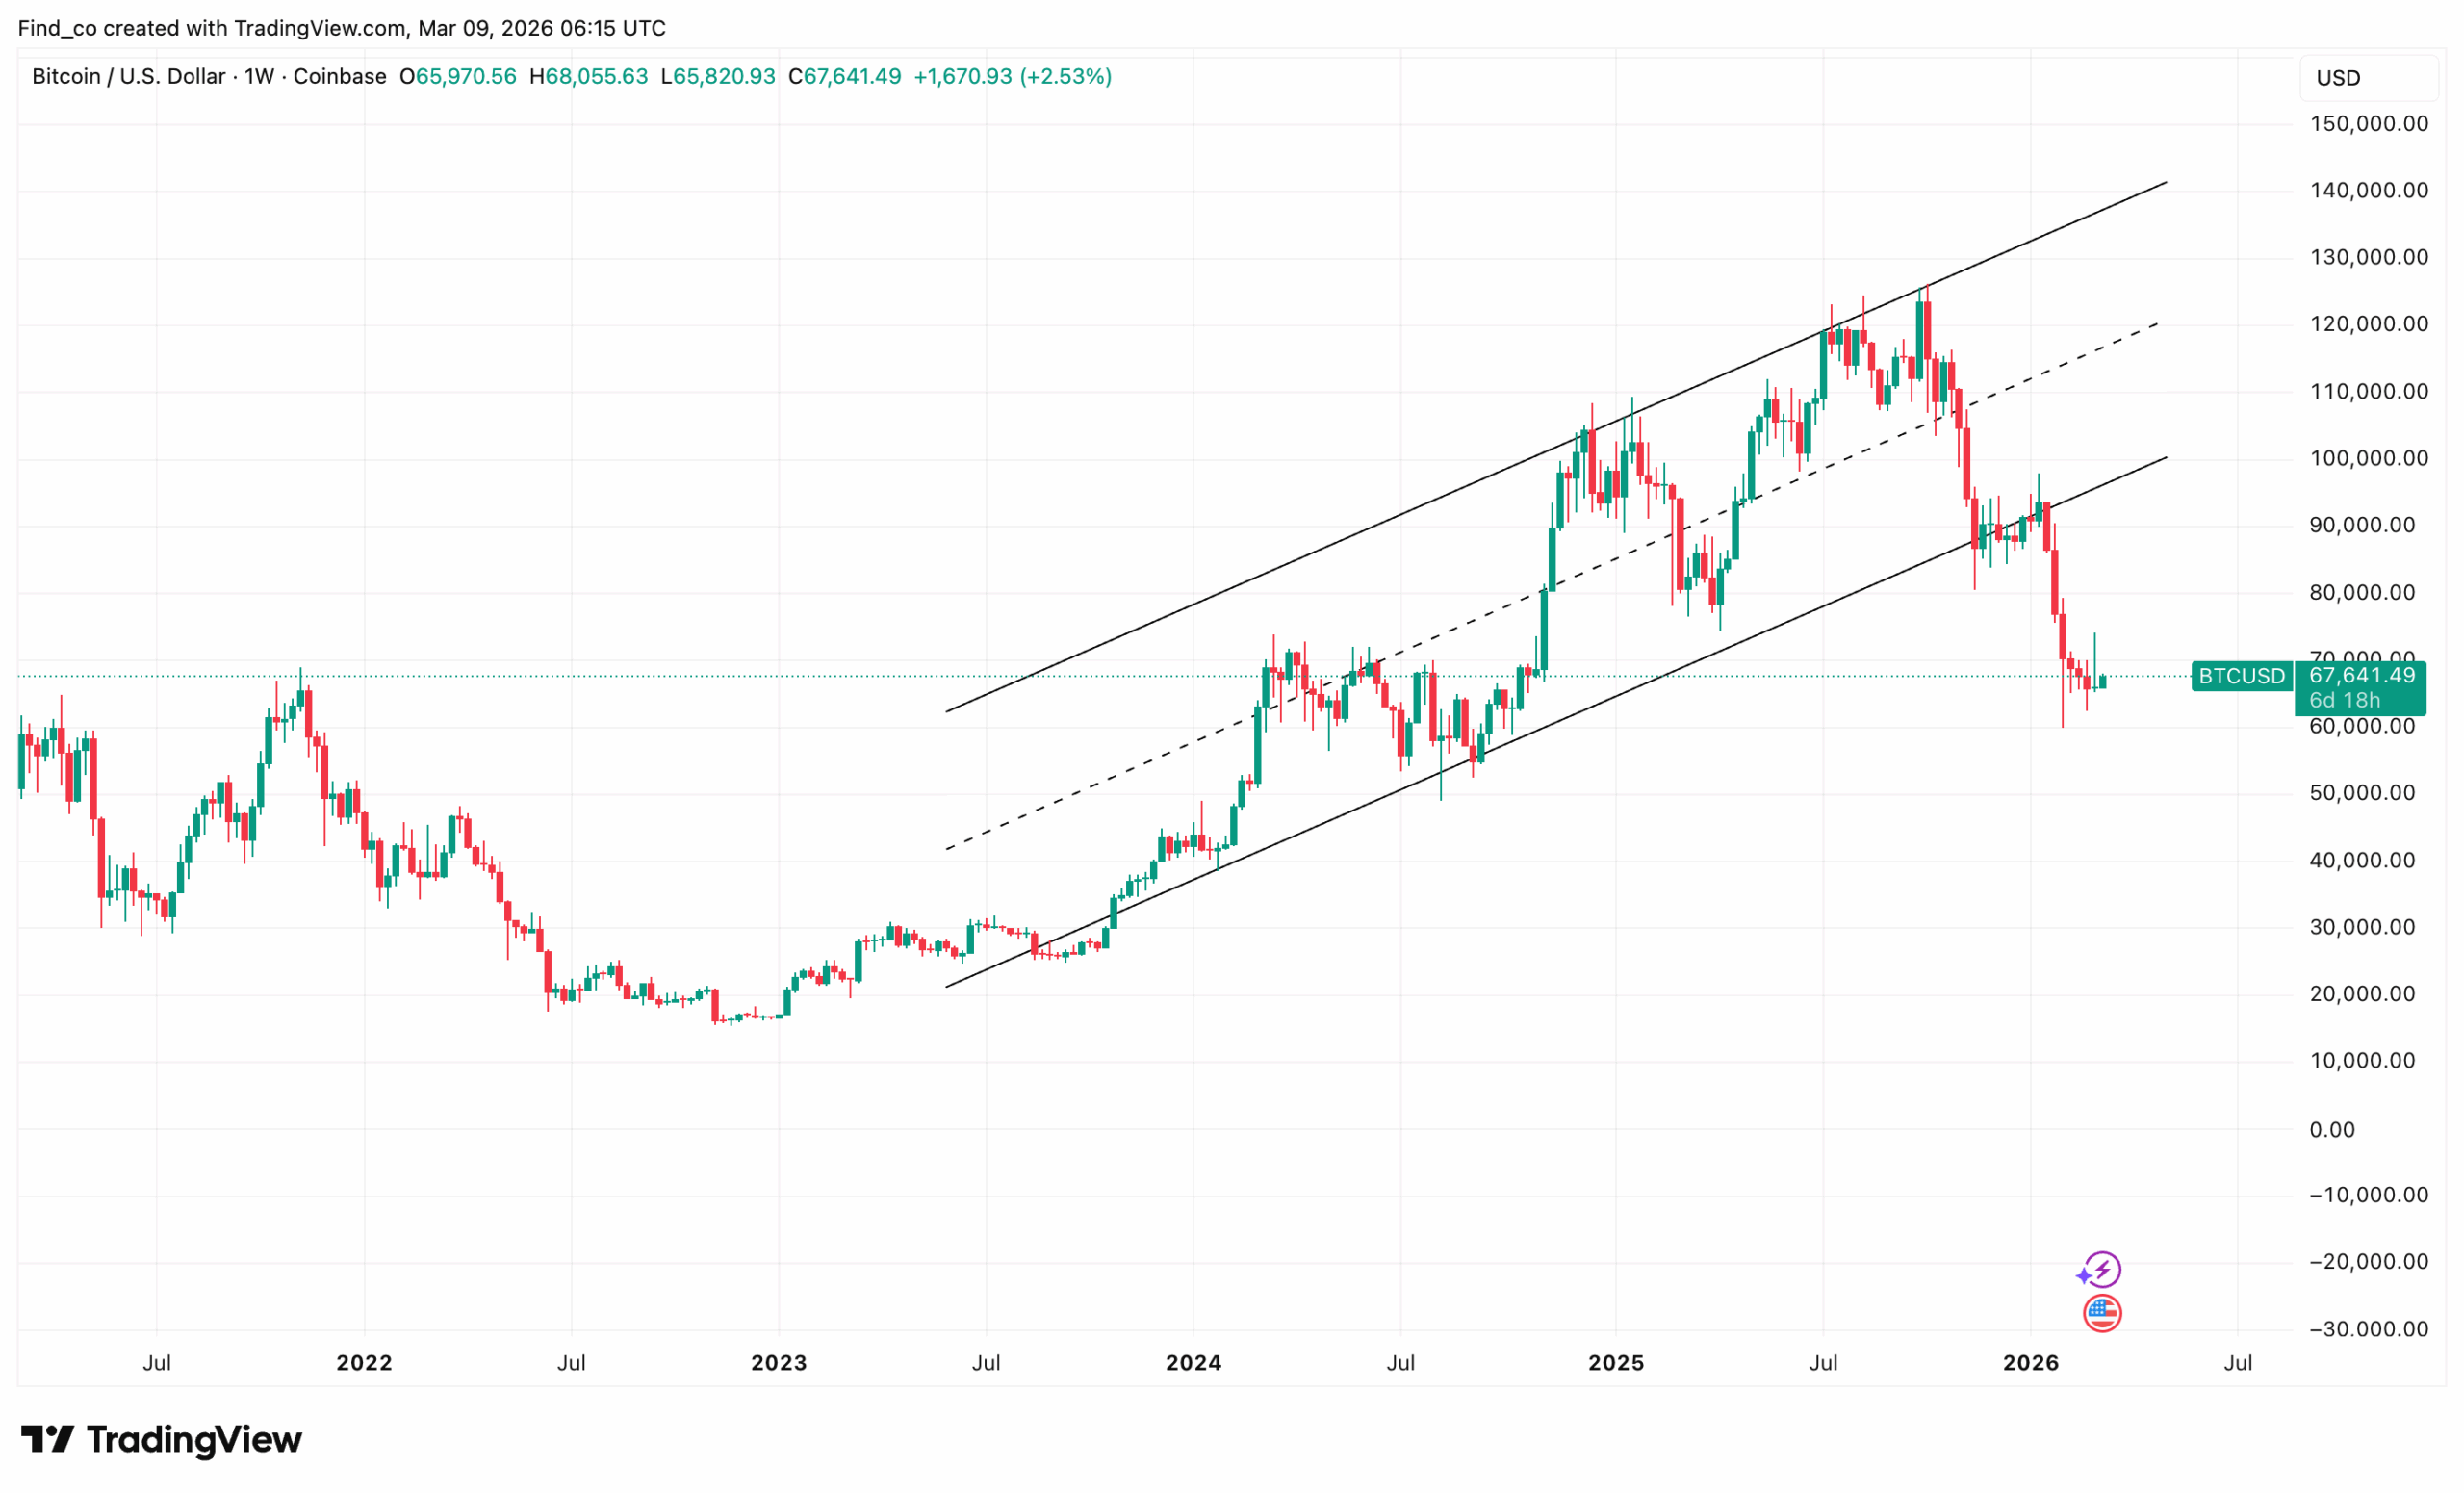
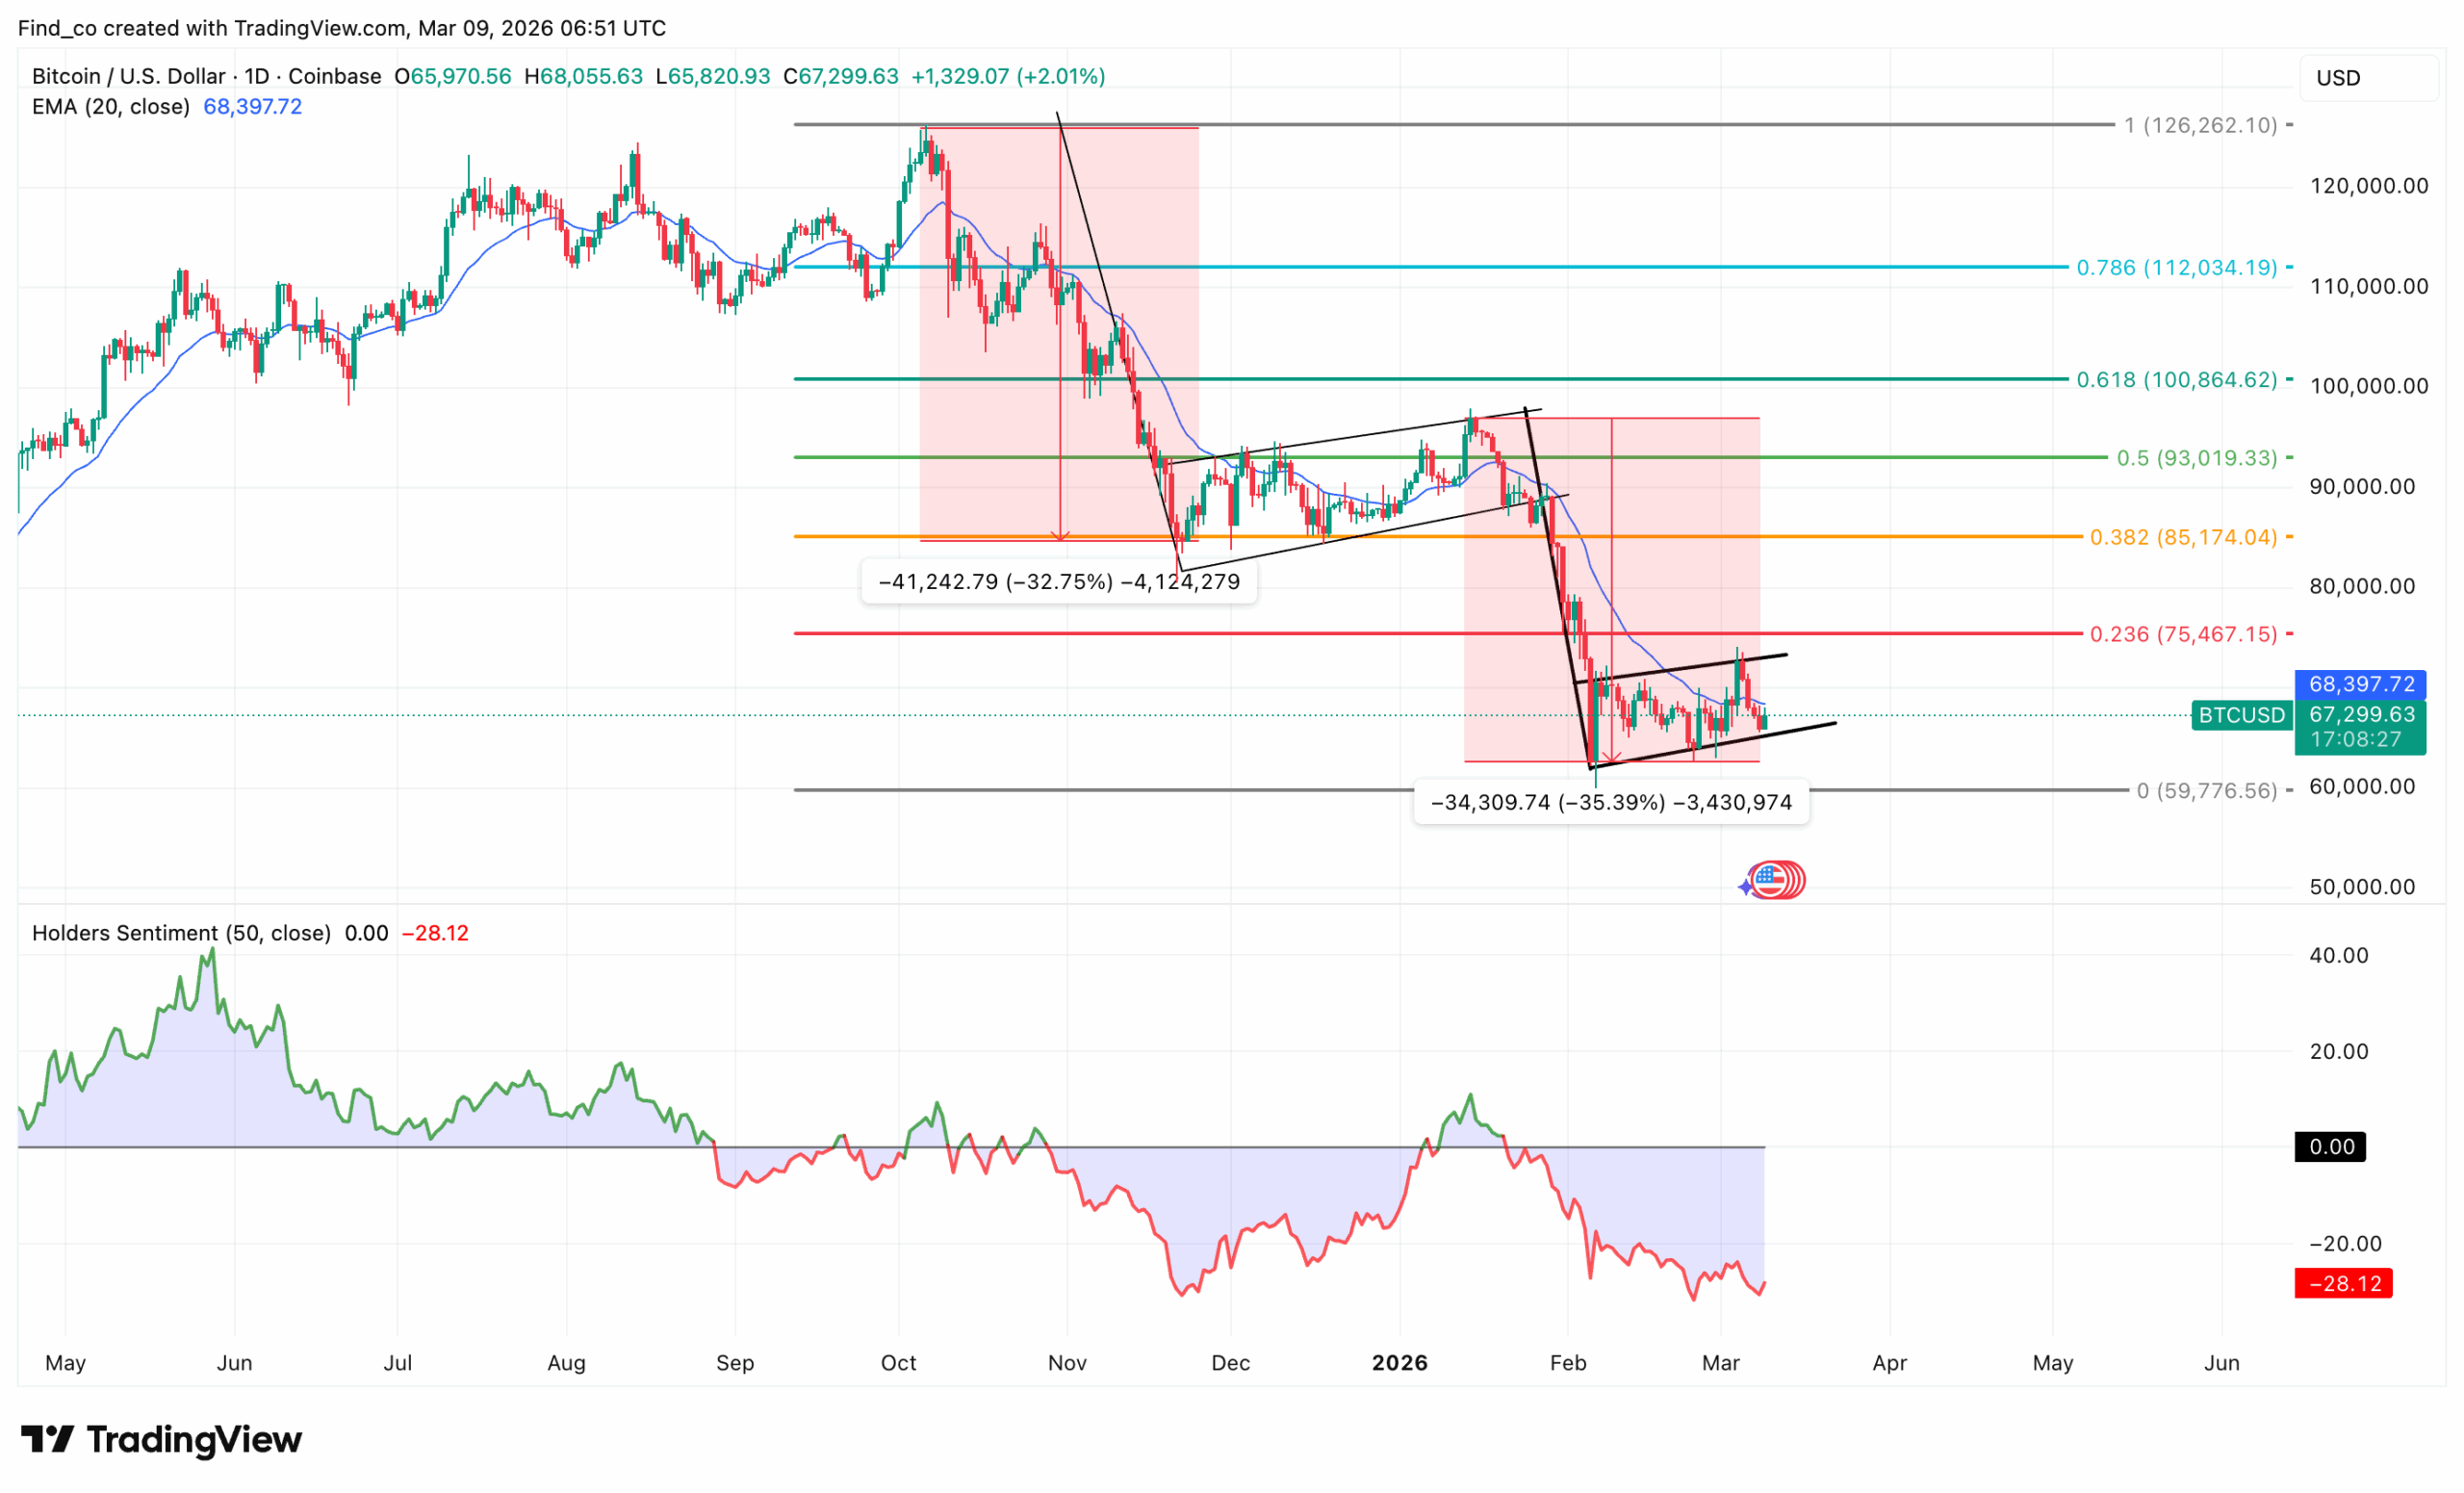
But at the time of writing, the negative holder sentiment at a descending triangle base creates a setup for either a sharp bounce or final capitulation.
A close above the 20-EMA at $68,397, combined with sentiment recovering toward zero, would be the first credible recovery signal.
Disclaimer:
The information provided in this article is for informational purposes only. It is not intended to be, nor should it be construed as, financial advice. We do not make any warranties regarding the completeness, reliability, or accuracy of this information. All investments involve risk, and past performance does not guarantee future results. We recommend consulting a financial advisor before making any investment decisions.
Victor Olanrewaju is a crypto analyst and reporter at CCN with deep roots in on-chain research and technical analysis. His crypto journey began in 2017, but it was the 2020 Uniswap airdrop that sparked a full-time pivot into the space.
With a foundation in copywriting, Victor honed his craft creating high-converting content for leading crypto brokers — most notably an XRP price prediction that ranked #1 on Google during the 2021 bull run.
He later joined AMBCrypto in 2022, where he combined storytelling with technical and on-chain analysis to cover key market narratives.
In 2024, he expanded his expertise at BeInCrypto, collaborating with analysts and using tools like Glassnode, Santiment, and IntoTheBlock to break down Bitcoin and altcoin trends.
At CCN, Victor covers the top cryptocurrencies, memecoins, macro shifts, blending real-time insights with deep-dive metrics.
He holds a Bachelor’s degree in Physics from the University of Ibadan, equipping him to simplify complex data for a wide audience. Follow his work or connect on LinkedIn or X.