Is the Bitcoin and ETH bottom finally in?| Credit: Hameem Sarwar
Share
Key Takeaways
Bitcoin’s STH Supply in Profit has crashed to near 0%, indicating a potential bottom.
ETH has reclaimed the $2,000 threshold, backed by the extreme negative funding rates.
Technical analysis suggests that ETH and Bitcoin could trade higher before the month ends.
Bitcoin’s (BTC) price has held above $65,000. Ethereum (ETH) has reclaimed $2,000 — a psychologically charged threshold that its holders have been fighting to restore.
Taken individually, each development is significant. But what does this mean for Bitcoin and ETH going forward?
Let’s find out.
Why Bitcoin Could Continue to Defend $65K
Bitcoin refusing to break below $65,000 is not a passive event. It is an active statement from the market’s largest and most sophisticated participants.
The $65,000 level has been under sustained pressure from geopolitical tensions in the Middle East and energy-driven inflation fears.
Against that backdrop, every time Bitcoin’s price closes above $65,000, it represents a successful defence against forces genuinely capable of triggering a deeper correction.
Get These Top Crypto Casino Offers Now!
Sponsored
Disclosure
We sometimes use affiliate links in our content, when clicking on those we might receive a commission at no extra cost to you. By using this website you agree to our terms and conditions and privacy policy.
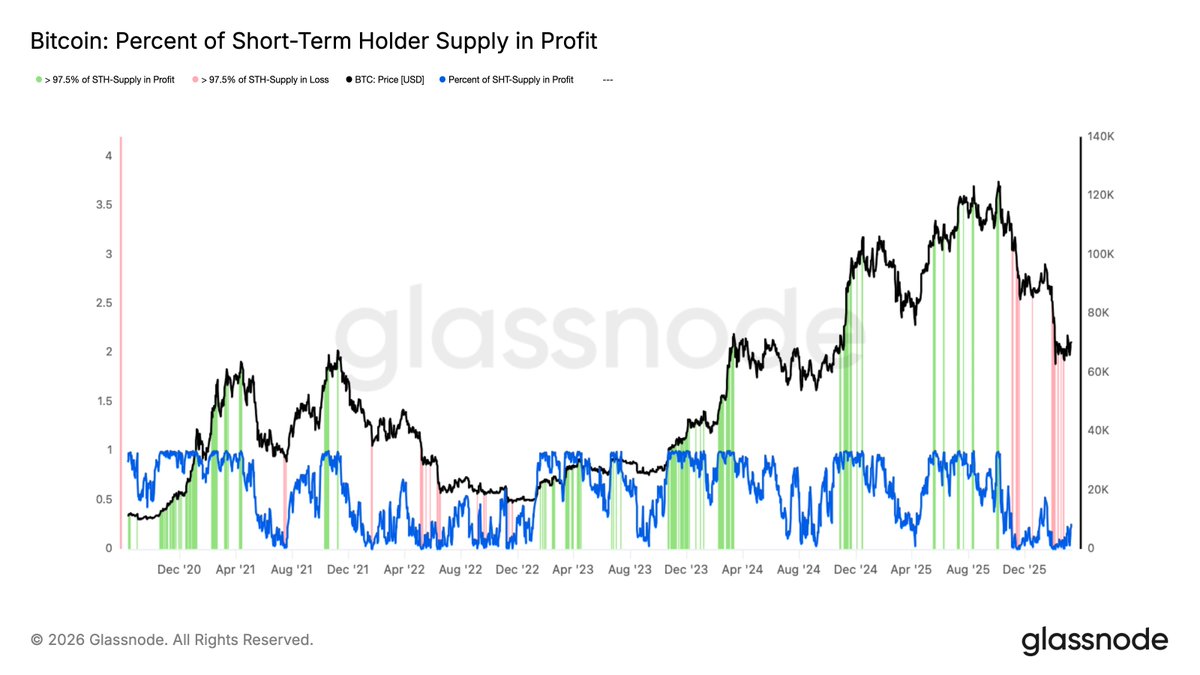
From an on-chain perspective, a historically significant signal is flashing on Bitcoin’s most reliable capitulation indicator.
The Percent of Short-Term Holder Supply in Profit has crashed to near 0%. This matches the extreme lows last seen at the December 2022 bear market bottom and briefly in August 2024.
The pink vertical line on the far right marks the current reading: >97.5% of short-term holder supply is now in loss.
Interestingly, the pattern across five years is consistent. Every time the pink “STH supply in loss” signal has fired (December 2020 flash crash, July 2021, January 2022, June 2022, and December 2022), it has been followed by a significant price recovery.
The green “STH supply in profit” spikes (>97.5% in profit) indicate the opposite. For context, distribution peaks at $69,000 in 2021, $48,0000 in 2022, and $108,000 in late 2024.
The current reading is the most extreme pink signal since the 2022 bear market bottom. With BTC near $72,000, the signal carries a different magnitude than in 2022.
Short-term holders who bought at the $99,000 to $ 108,000 peak are uniformly underwater, creating a cohort of potential sellers on any rally.
But history shows this exact level of pain precedes relief, not further collapse. Thus, if history rhymes, Bitcoin’s price will likely attempt to test the $75,000 resistance.
Where Bitcoin’s $65,000 defence is primarily about what did not happen, ETH’s $2,000 reclaim is about what did happen — a recovery.
And recoveries, particularly recoveries of psychologically important round-number levels, trigger a specific and reliable sequence that favours continuation over reversal.
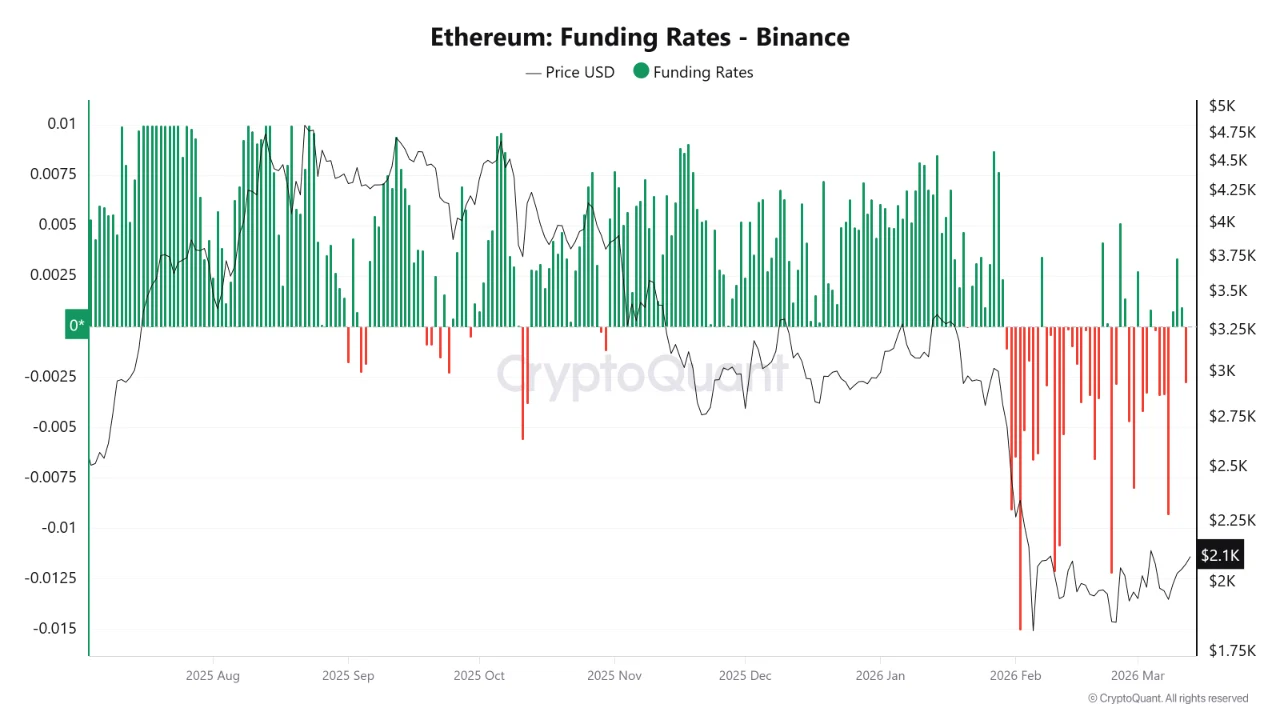
Funding rates on Binance have been persistently negative since early February, with red bars dominating every session through March.
The deepest negative readings are the most extreme on this nine-month chart by a significant margin. ETH price has followed, declining from $3,250 to the current $2,100 range.
The structural shift from July 2025 through January 2026 is stark.
During that period, funding was almost entirely green and positive. Since February, that has completely inverted.
Historically, when funding rates reach such extreme negative levels, the bearish consensus is overcrowded.
While negative funding can reflect genuine bearish conditions, it does not guarantee further downside. If ETH’s price sustains its current rebound toward $2,250, short positions could fuel the move.
Forced liquidations from squeezed shorts add mechanical momentum to any upside move, amplifying the recovery beyond what organic buying alone would produce.
If this trend remains the same, ETH’s price, like Bitcoin’s trend, could close in on $2,500.
What Comes Next for Bitcoin and ETH? Analysis
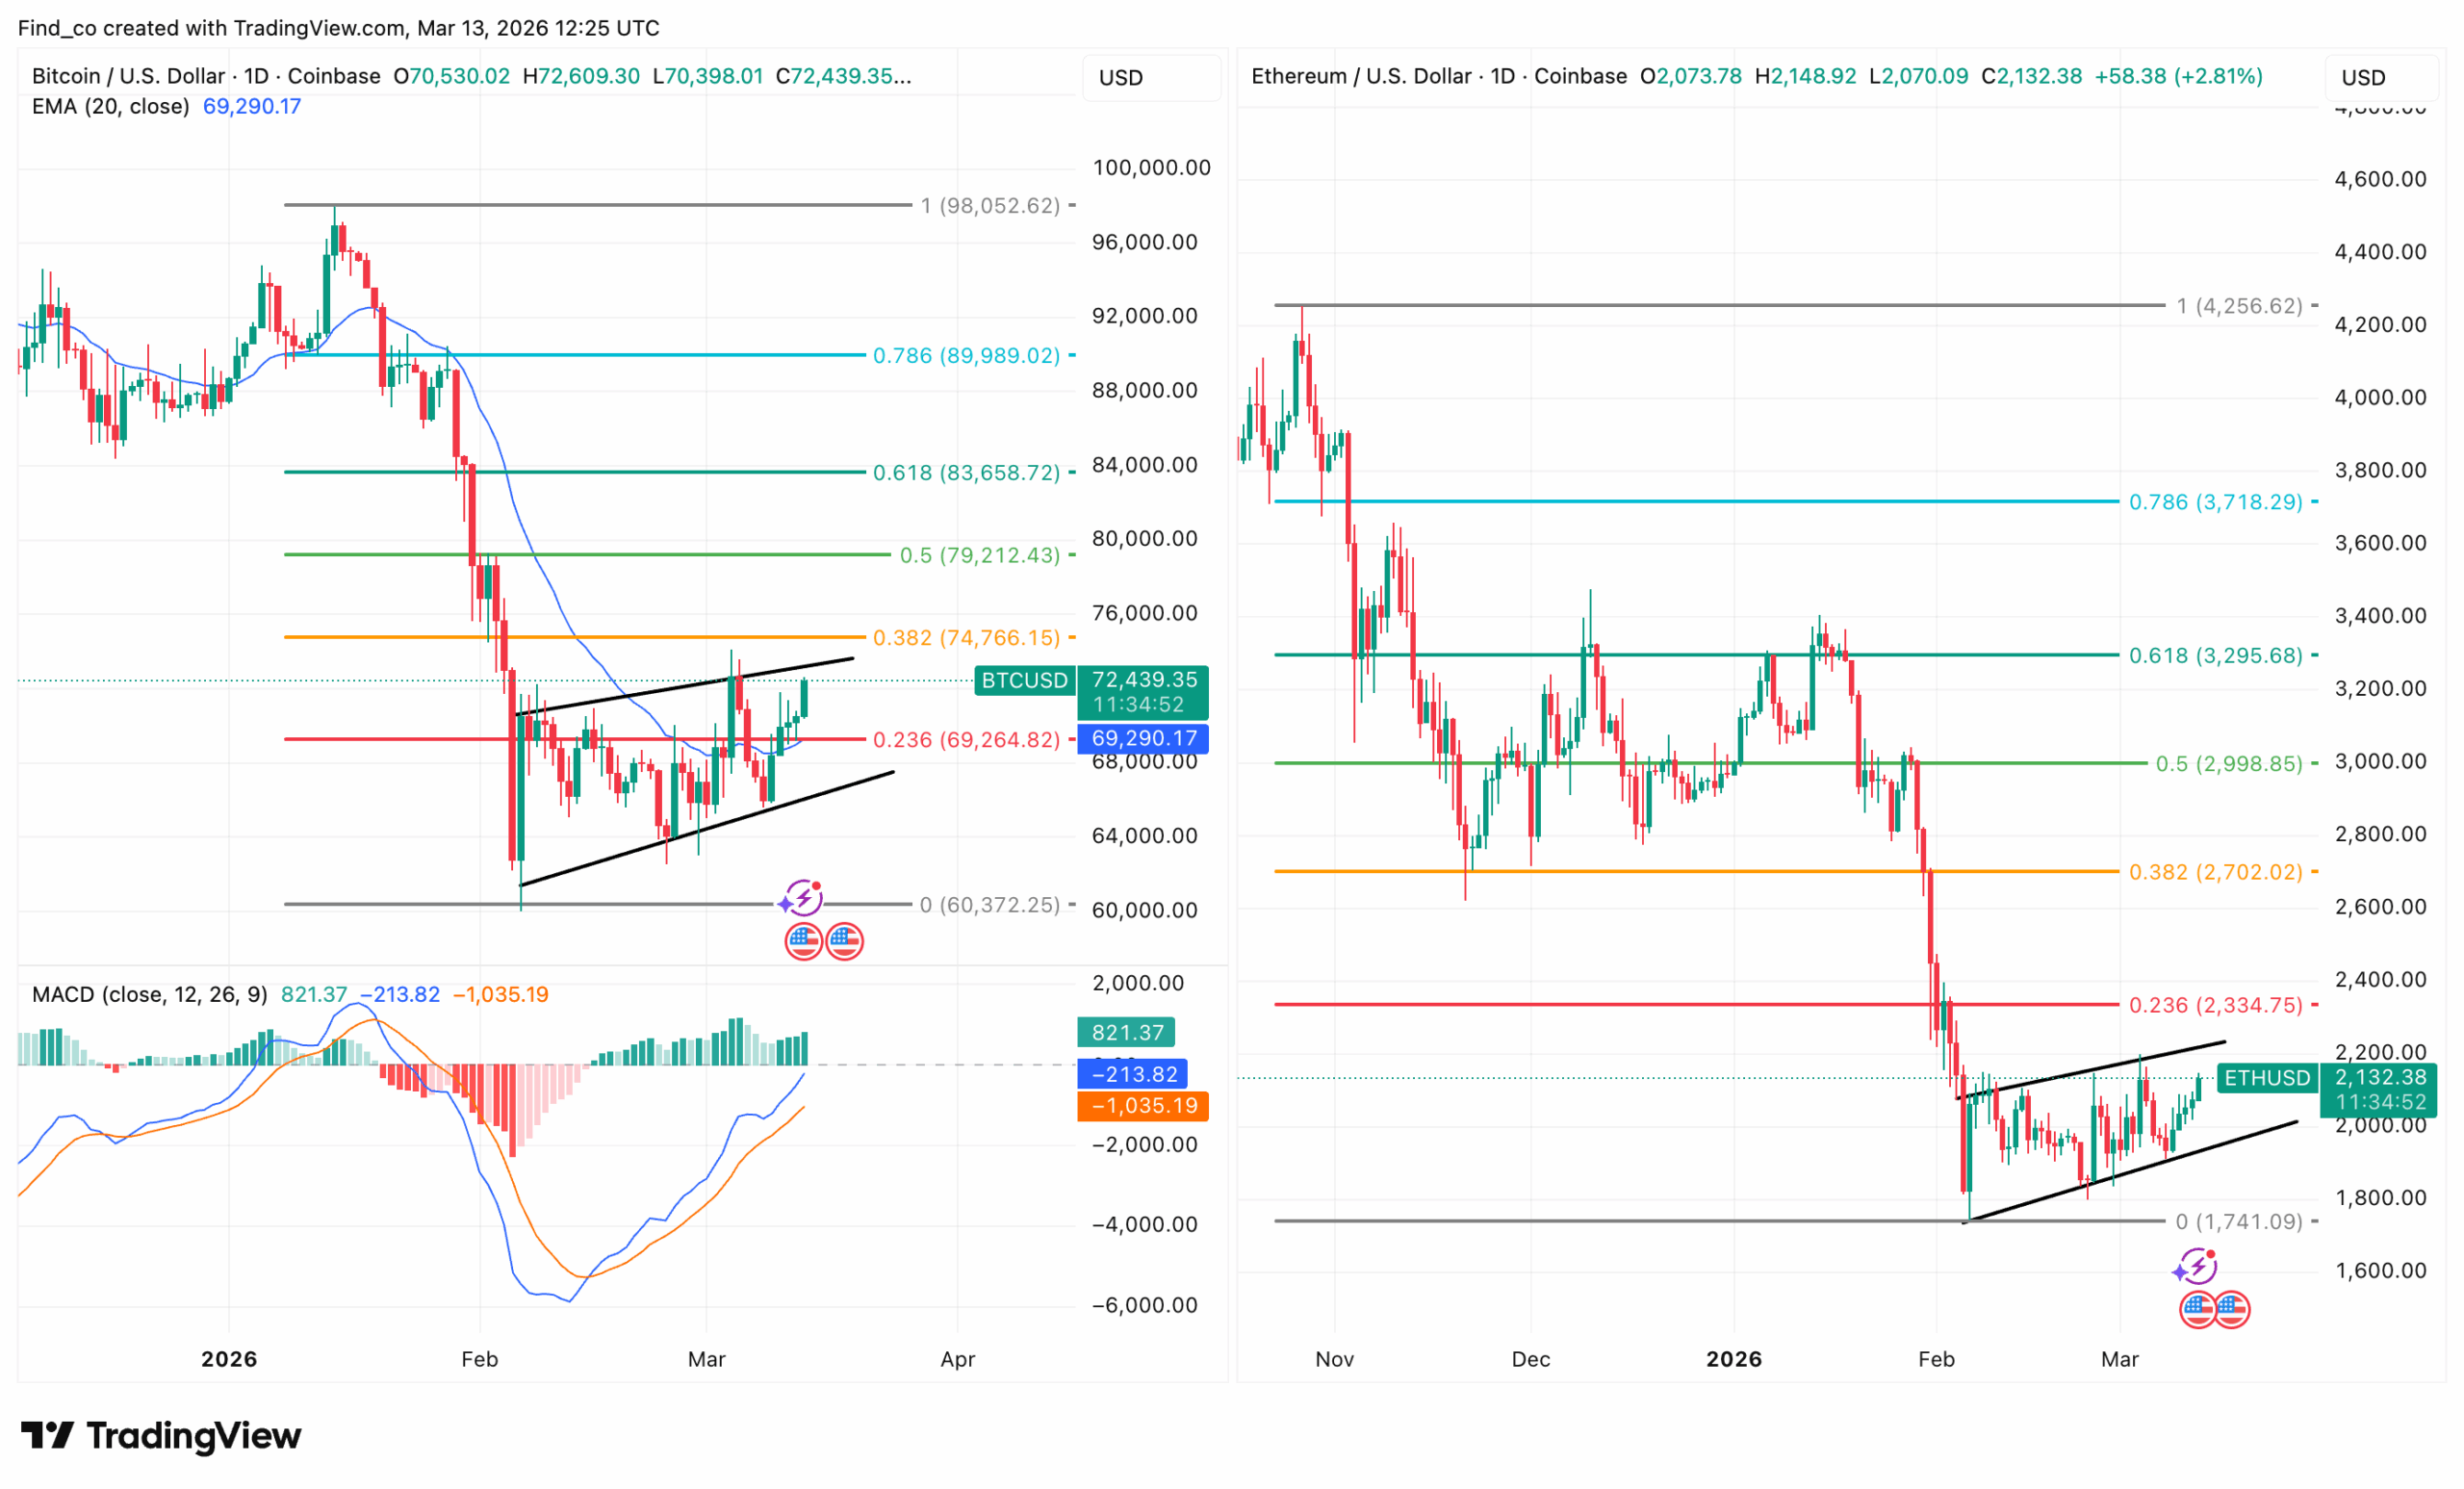
Two ascending triangles. Two MACD recoveries. The same question: is the bottom in?
Bitcoin’s price trades at $72,439, breaking above the descending channel and pressing the 0.236 Fib at $69,264.
Notably, this has now flipped to support with the 20-EMA at $69,290.
Furthermore, the ascending triangle pattern from the February lows is clear: flat resistance near $74,766 (0.382 Fib), rising support from the $60,372 floor.
Meanwhile, the MACD line (821.37) has crossed above the signal (-213.82) — the largest positive histogram reading since the correction began.
The crossover fired from near the deepest negative MACD through on this chart.
On the other hand, Ethereum trades at $2,132, up 2.81%, building the same ascending triangle structure from the $1,741 floor.
For context, ETH has more ground to recover, as it sits below all major Fibonacci levels, with $2,334 (0.236 Fib) as the immediate target. The ascending support trendline from February’s lows is intact and rising.
Victor Olanrewaju is a crypto analyst and reporter at CCN with deep roots in on-chain research and technical analysis. His crypto journey began in 2017, but it was the 2020 Uniswap airdrop that sparked a full-time pivot into the space.
With a foundation in copywriting, Victor honed his craft creating high-converting content for leading crypto brokers — most notably an XRP price prediction that ranked #1 on Google during the 2021 bull run.
He later joined AMBCrypto in 2022, where he combined storytelling with technical and on-chain analysis to cover key market narratives.
In 2024, he expanded his expertise at BeInCrypto, collaborating with analysts and using tools like Glassnode, Santiment, and IntoTheBlock to break down Bitcoin and altcoin trends.
At CCN, Victor covers the top cryptocurrencies, memecoins, macro shifts, blending real-time insights with deep-dive metrics.
He holds a Bachelor’s degree in Physics from the University of Ibadan, equipping him to simplify complex data for a wide audience. Follow his work or connect on LinkedIn or X.