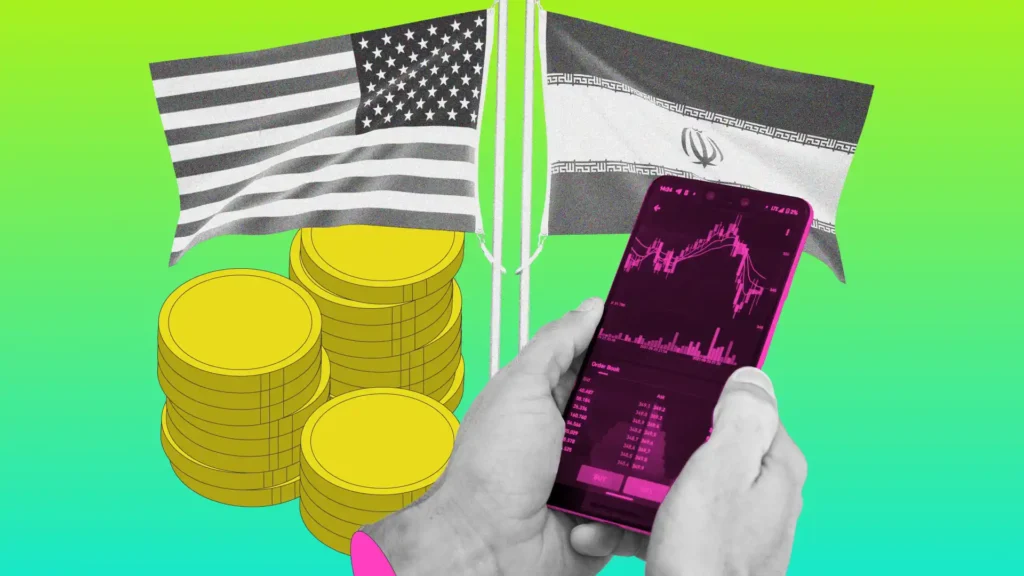
This is what could be next for gold and silver after the Strait of Hormuz strike | Credit: CCN
Share
Key Takeaways
The U.S. military launched preemptive strikes, destroying at least 16 Iranian mine-laying vessels in the Strait of Hormuz.
As long as gold holds the $5,000 support band, the broader trend points to a retest of the $5,599 record high.
Silver is struggling at $88.32, with a bearish CMF divergence, indicating that capital flows are declining.
On paper, the conditions currently in place should be producing one of the most explosive precious metals rallies.
Just yesterday, the United States launched direct military strikes on Iranian mines in the Strait of Hormuz is
This has escalated a geopolitical conflict that has already rattled global energy markets, equity indices, and currency valuations.
However, gold and silver, the assets that investors have reached for during every major geopolitical crisis of the past century, should be surging.
Instead, they are stuck. And understanding why tells a far more important story than the price levels alone.
Where Gold and Silver Actually Stand
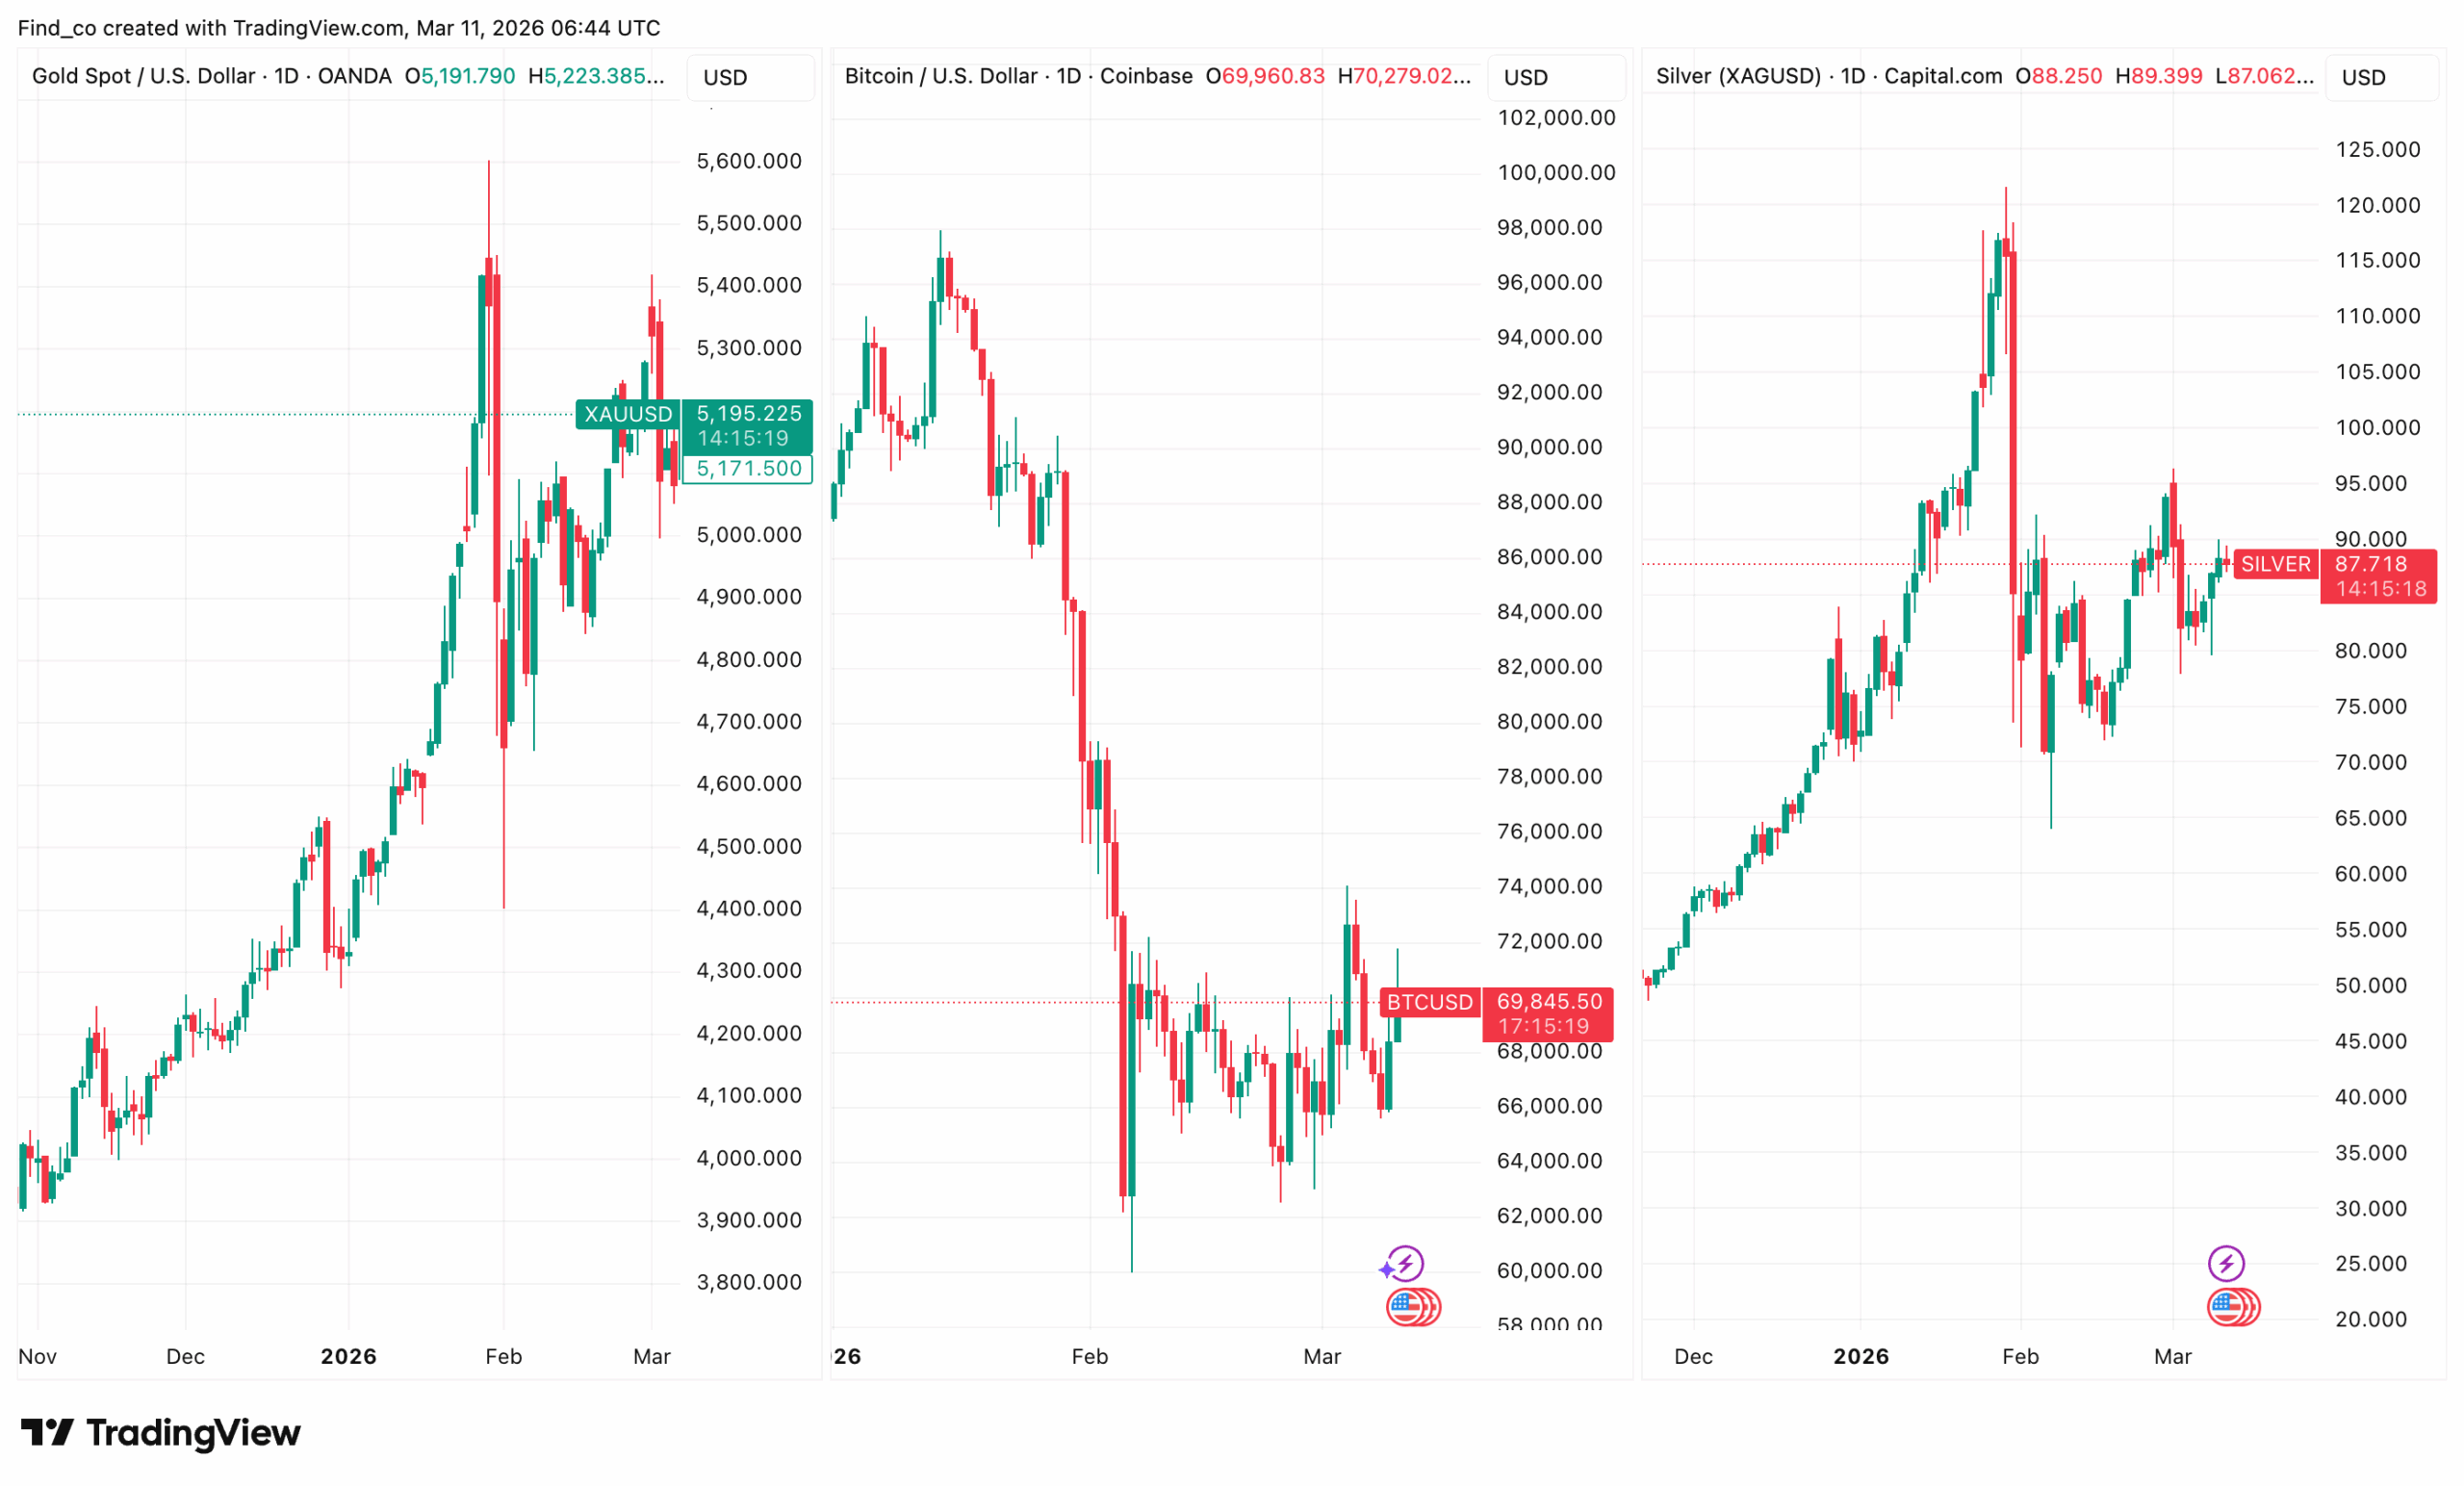
At the time of writing, gold is trading below $5,200.
This is a threshold that has become the defining resistance ceiling of this cycle.
On several occasions, the precious metal has failed to convincingly reclaim despite multiple attempts amid escalating global tensions.
Silver’s situation is similarly frustrating for bulls. At press time, the white metal is hovering around $87, struggling to hold above $100.
Meanwhile, the parallel with Bitcoin (BTC) is instructive. Like BTC, both gold and silver are assets that a growing body of institutional and retail investors holds as hedges against systemic risk.
Also, like Bitcoin’s price, neither is delivering the breakout that the geopolitical backdrop would seem to demand.
That shared hesitation across multiple supposed safe-haven and crisis-hedge assets is itself a macro signal worth examining carefully.
Why the Strait of Hormuz Crisis Has Not Triggered a Rally
The US military strikes on Iranian mines in the Strait of Hormuz represent a significant escalation in a conflict that has been building over the last two weeks.
Before now, there were no signs that this would happen. But after reports emerged that the Middle East nation was laying mines, the U.S military took action.
“I am pleased to report that within the last few hours, we have hit, and completely destroyed, 10 inactive mine laying boats and/or ships, with more to follow! President DONALD J. TRUMP,” Trump posted on Truth Social
For context, the Strait of Hormuz is the narrow waterway through which roughly one-fifth of the world’s oil supply transits daily.
The immediate concern is the potential for Iran to retaliate by threatening or closing the Strait entirely.
This scenario, if it comes to pass, would trigger one of the most severe supply shocks in global energy history.
Consequently, it could also push inflation to levels not seen in decades.
Yet precious metals markets are reflecting a more complicated calculus than simple crisis buying.
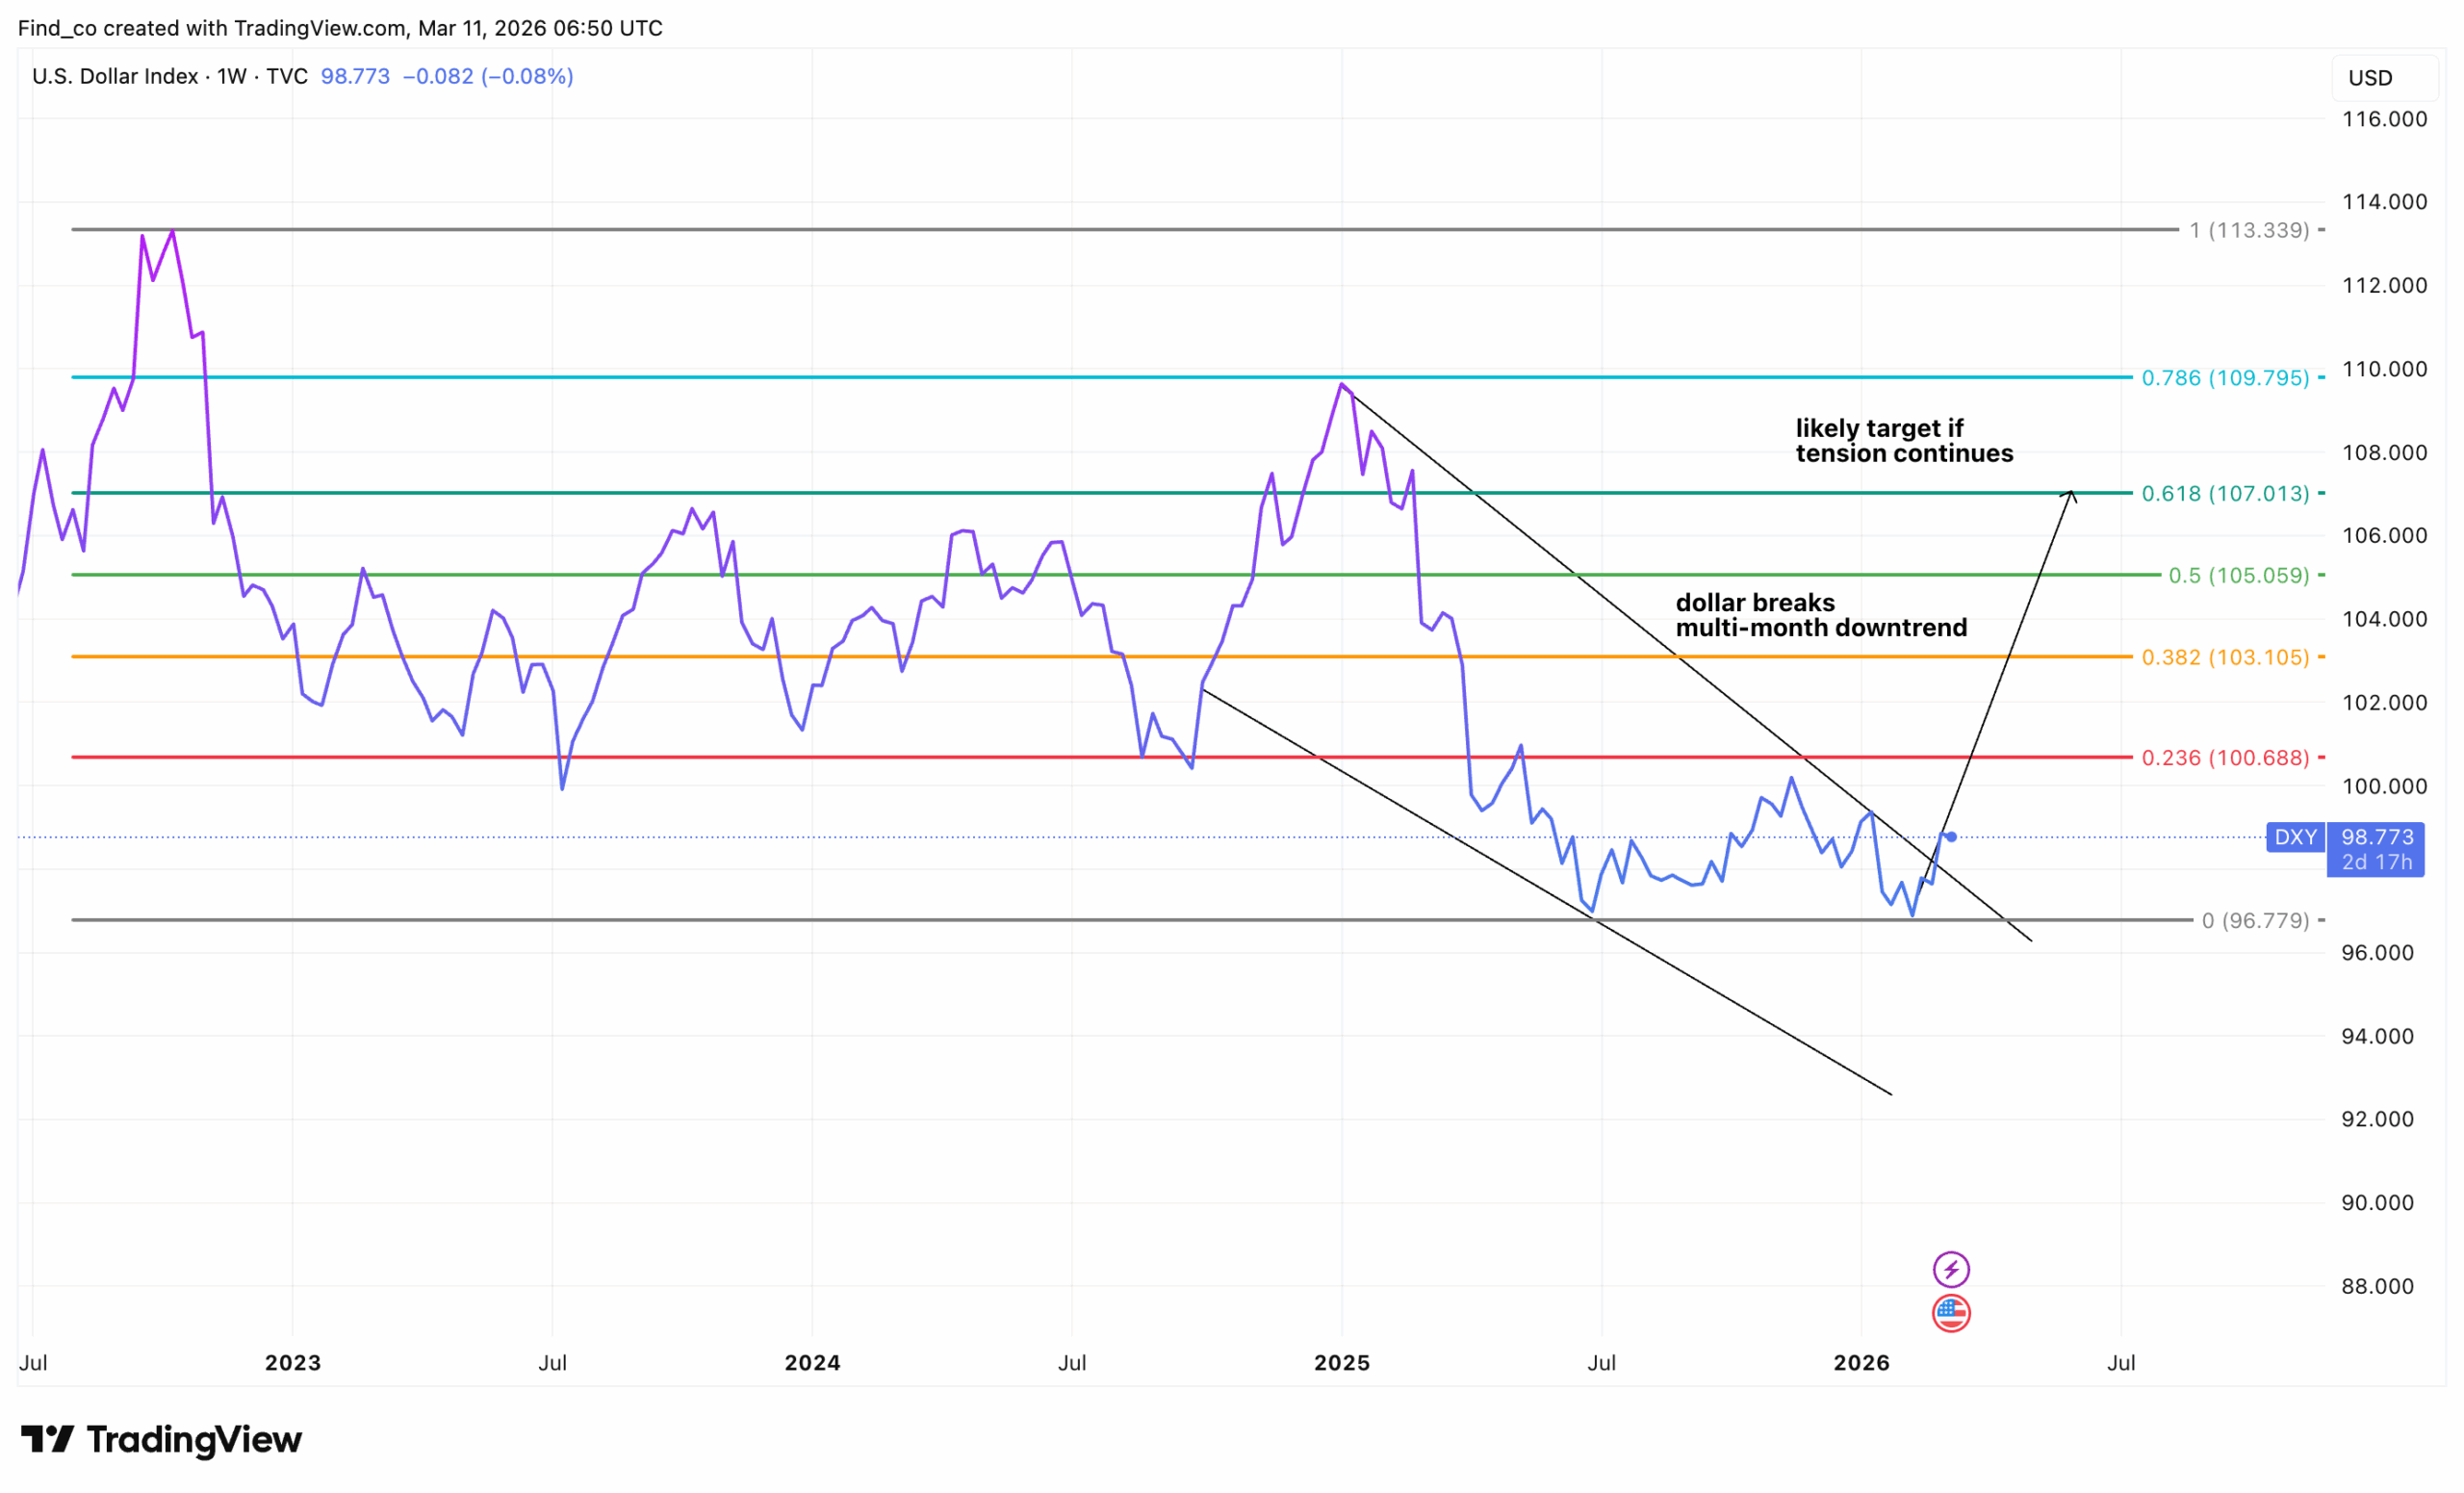
The first complicating factor is the dollar. US military action in the region has, counterintuitively, strengthened the US dollar in the near term.
Historically, a stronger U.S. currency suppresses the prices of dollar-denominated gold and silver. So, this creates a headwind that partially offsets the safe-haven demand the crisis should be generating.
US Dollar Index Weekly Chart | Credit: TradingView
Other Reasons Revealed
The second factor is real interest rates. Despite the inflationary implications of surging oil prices, Brent crude has already surpassed $82 per barrel.
Market participants are simultaneously pricing in the possibility that economic damage from energy disruption could slow growth enough to eventually force the central bank to ease.
That ambiguity between inflation and growth slowdown keeps real interest rate expectations volatile. In turn, volatile real rates are the enemy of clean directional moves in precious metals.
The third and perhaps most underappreciated factor is positioning.
Gold entered this crisis period with already elevated speculative long positioning, meaning many of the buyers who would ordinarily drive a crisis rally have already bought.
Therefore, without a fresh wave of capital to absorb the overhang, the gold and silver may continue to struggle to generate sustained upward momentum.
Gold Price Prediction
On the technical side, it appears gold’s bull run remains intact.
As shown below, the XAU/USD trades at $5,198, holding above both the 20-EMA ($5,114) and 50-EMA ($4,916) in a rising channel that has defined price action since the February low.
After the January spike to $5,599 and the subsequent correction, gold has built an ascending channel of higher lows.
Both EMAs are sloping upward, and the price has respected them on every dip, indicating a healthy uptrend.
The Awesome Oscillator (AO) at 79.81 is positive and rebuilding after a brief red pullback.
The MACD line (74.66) remains above the signal (86.35) line. However, in this case, the indicator has formed a bearish cross.
Amid these mixed signals, gold could ignore the issues at the Strait of Hormuz and possibly target $5,599 (1 Fib).
In the meantime, support remains $5,096 (0.786 Fib). On the contrary, if the precious metal loses the 20-EMA at $5,114, the ascending channel will be under threat.
Silver Price Forecast
Technically, silver is lagging gold, and the indicators are flashing a cautionary signal.
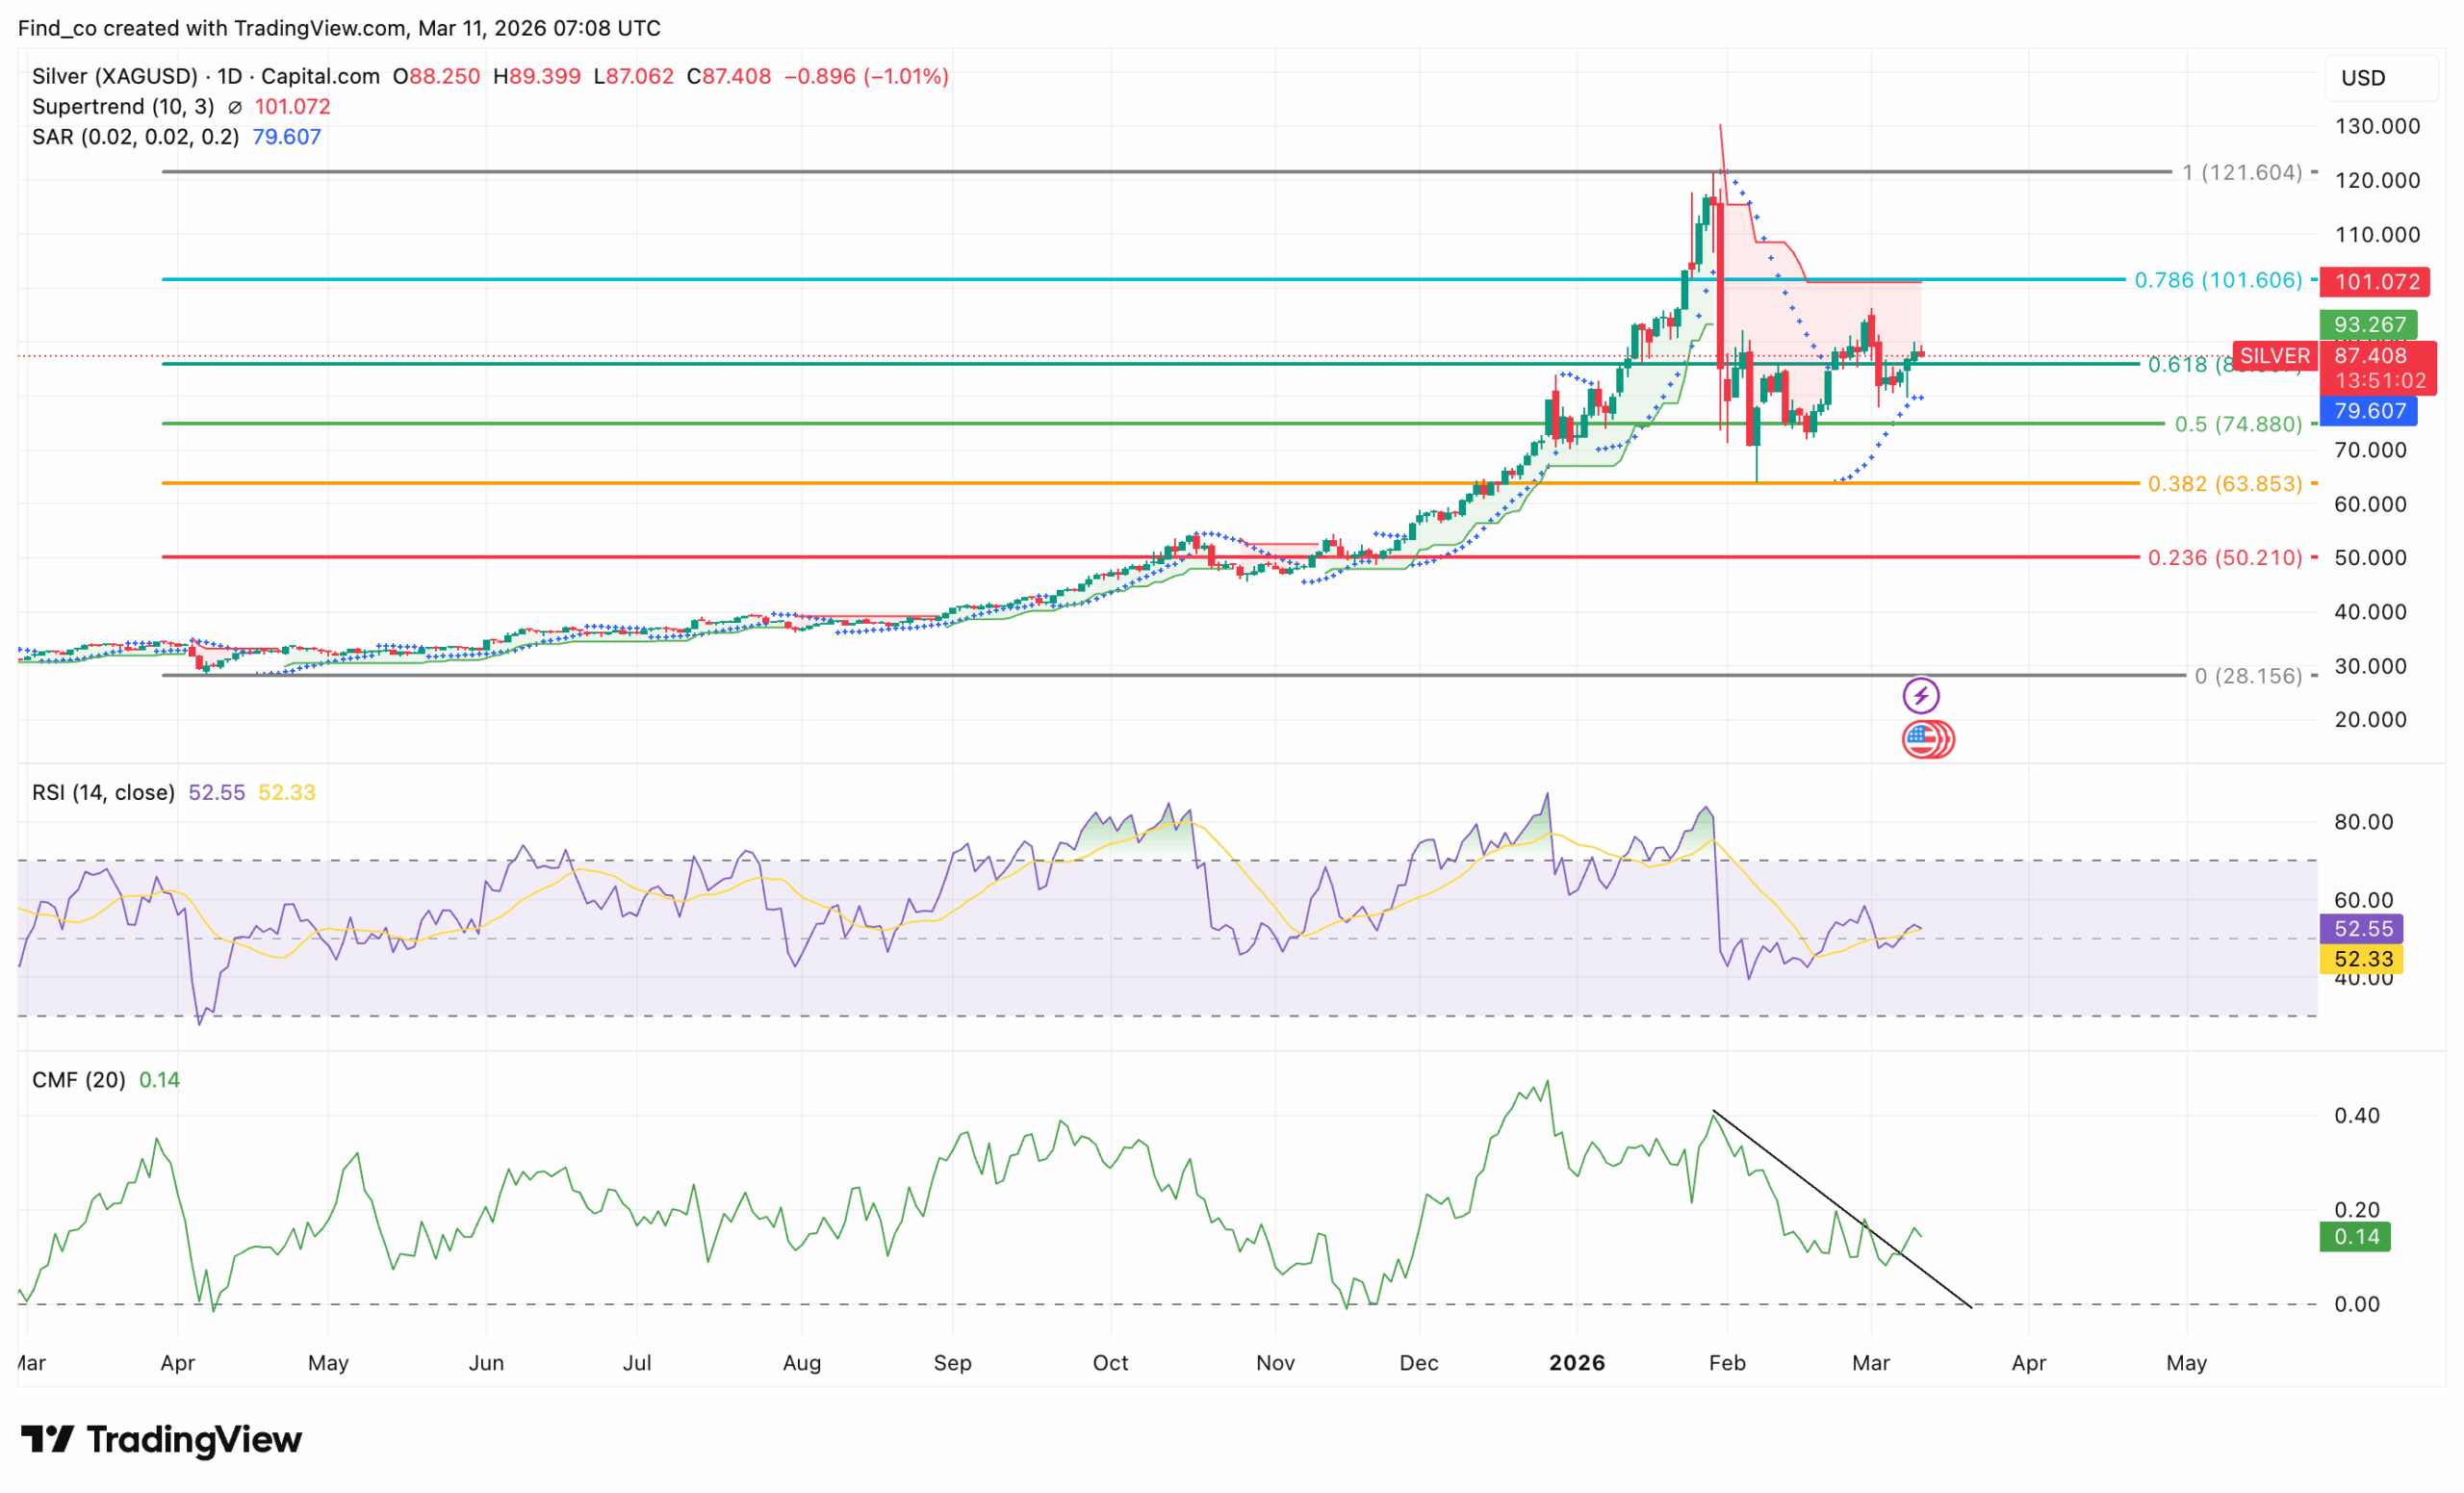
The XAG/USD pair trades at $87.41, struggling to hold the 0.618 Fib at $88.32 after the violent January spike to $121.60 and subsequent crash.
The Supertrend at $101.07 sits well overhead in bearish mode. The Parabolic SAR at $79.61 is below the price, but has been closing in.
Here, a flip above the current price would be a bearish signal.
The Chaikin Money Flow (CMF) divergence is the key warning. Price has stabilised between $87 and $93 for six weeks, but CMF has been steadily declining from 0.40 to 0.14.
In addition, the Relative Strength Index (RSI) at 52.55 is neutral, with no strong directional signal yet.
As it stands, if silver’s price holds $88.32 (0.618 Fib), it could keep consolidating.
However, if the white metal drops below the key support at $74.88 (0.5 Fib), $74.88 (0.5 Fib) could be the next stop.
What Breaks the Stalemate?
The catalyst that resolves precious metals’ current indecision most likely comes from one of two directions.
Either the Strait of Hormuz crisis escalates to a point where supply disruption becomes a physical reality rather than a geopolitical threat.
If that happens, it could trigger an inflationary shock that overrides the U.S. dollar’s strength and rate uncertainty in investors’ minds.
On the other hand, it could drive the Federal Reserve to pivot toward easing amid growth concerns, which would simultaneously weaken the dollar and boost the appeal of non-yielding assets like gold and silver.
Either path leads to the same destination for precious metals.
The question is timing, and in markets shaped by military strikes, Iranian retaliation calculus, and central bank psychology operating simultaneously, timing is the one variable no model can reliably predict
Disclaimer:
The information provided in this article is for informational purposes only. It is not intended to be, nor should it be construed as, financial advice. We do not make any warranties regarding the completeness, reliability, or accuracy of this information. All investments involve risk, and past performance does not guarantee future results. We recommend consulting a financial advisor before making any investment decisions.
Victor Olanrewaju is a crypto analyst and reporter at CCN with deep roots in on-chain research and technical analysis. His crypto journey began in 2017, but it was the 2020 Uniswap airdrop that sparked a full-time pivot into the space.
With a foundation in copywriting, Victor honed his craft creating high-converting content for leading crypto brokers — most notably an XRP price prediction that ranked #1 on Google during the 2021 bull run.
He later joined AMBCrypto in 2022, where he combined storytelling with technical and on-chain analysis to cover key market narratives.
In 2024, he expanded his expertise at BeInCrypto, collaborating with analysts and using tools like Glassnode, Santiment, and IntoTheBlock to break down Bitcoin and altcoin trends.
At CCN, Victor covers the top cryptocurrencies, memecoins, macro shifts, blending real-time insights with deep-dive metrics.
He holds a Bachelor’s degree in Physics from the University of Ibadan, equipping him to simplify complex data for a wide audience. Follow his work or connect on LinkedIn or X.